Global Cyber Physical Systems Market
Market Size in USD Billion
CAGR :
% 
 USD
9.14 Billion
USD
20.39 Billion
2025
2033
USD
9.14 Billion
USD
20.39 Billion
2025
2033
| 2026 –2033 | |
| USD 9.14 Billion | |
| USD 20.39 Billion | |
| % | |
|
Cyber-Physical Systems Market Size
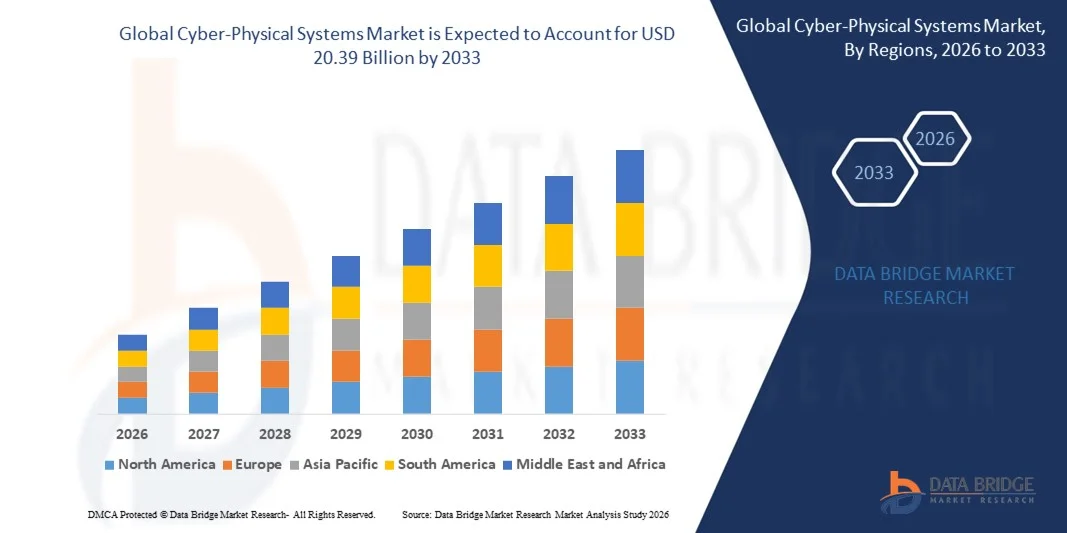
- The global cyber-physical systems market size was valued at USD 9.14 billion in 2025 and is expected to reach USD 20.39 billion by 2033, at a CAGR of 10.55% during the forecast period
- The market growth is largely fuelled by the increasing adoption of smart manufacturing and industrial automation to improve operational efficiency and productivity
- Rising integration of IoT, AI, and real-time monitoring technologies in critical infrastructure such as healthcare, energy, and transportation is accelerating market expansion
Cyber-Physical Systems Market Analysis
- The market is witnessing strong growth due to the increasing convergence of physical assets with digital technologies to enable intelligent decision-making and automation
- Organizations are focusing on enhancing operational efficiency, predictive maintenance, and system reliability, which is increasing the deployment of cyber-physical systems
- North America dominated the cyber-physical systems market with the largest revenue share of 34.50% in 2025, driven by strong adoption of industrial automation, smart manufacturing, and advanced digital infrastructure across industries such as manufacturing, healthcare, and energy
- Asia-Pacific region is expected to witness the highest growth rate in the global cyber-physical systems market, driven by expanding manufacturing sector, rising investment in smart factories and infrastructure, increasing adoption of industrial automation, and strong economic growth across emerging countries such as China, India, and Japan
- The EP-CPS segment held the largest market revenue share in 2025 driven by its extensive use in industrial automation, energy systems, and manufacturing environments where tight integration between physical processes and embedded computing is essential. EP-CPS enables real-time monitoring, control, and optimization of industrial operations, making it a preferred choice for critical infrastructure and production facilities
Report Scope and Cyber-Physical Systems Market Segmentation
|
Attributes |
Cyber-Physical Systems Key Market Insights |
|
Segments Covered |
|
|
Countries Covered |
North America
Europe
Asia-Pacific
Middle East and Africa
South America
|
|
Key Market Players |
|
|
Market Opportunities |
|
|
Value Added Data Infosets |
In addition to the market insights such as market value, growth rate, market segments, geographical coverage, market players, and market scenario, the market report curated by the Data Bridge Market Research team includes in-depth expert analysis, import/export analysis, pricing analysis, production consumption analysis, and pestle analysis. |
Cyber-Physical Systems Market Trends
Increasing Adoption of Industry 4.0 and Smart Manufacturing
- The growing transition toward Industry 4.0 is significantly shaping the cyber-physical systems market, as organizations increasingly integrate physical machinery with digital monitoring and control systems. Cyber-physical systems enable real-time data exchange, predictive maintenance, and intelligent automation, improving operational efficiency and reducing downtime. This trend is strengthening adoption across manufacturing, energy, and logistics sectors, encouraging companies to modernize legacy infrastructure with connected and automated solutions
- Rising demand for real-time monitoring and automation has accelerated the deployment of cyber-physical systems across industries such as healthcare, transportation, and utilities. Businesses are increasingly using these systems to enhance process accuracy, safety, and performance while reducing human intervention. This has also encouraged technology providers and industrial operators to collaborate on advanced automation solutions that improve productivity and operational reliability
- Digital transformation and smart infrastructure trends are influencing investment decisions, with organizations emphasizing intelligent control systems, connected devices, and integrated platforms. These factors are helping companies optimize operational efficiency, improve asset utilization, and enhance decision-making capabilities. In addition, increasing focus on sustainability and energy efficiency is encouraging the deployment of cyber-physical systems to support resource optimization and environmental compliance
- For instance, in 2024, Siemens in Germany and General Electric in the U.S. expanded their cyber-physical system-enabled industrial automation platforms for manufacturing facilities. These solutions were introduced to enhance predictive maintenance, improve operational efficiency, and enable intelligent production. The deployments strengthened their digital industry portfolios and increased adoption among manufacturers seeking smart factory capabilities
- While adoption of cyber-physical systems is increasing, sustained market growth depends on continued technological innovation, cost optimization, and seamless integration with existing infrastructure. Companies are focusing on improving interoperability, scalability, and cybersecurity features to support broader adoption and ensure reliable performance across critical applications
Cyber-Physical Systems Market Dynamics
Driver
Increasing Adoption of Industrial Automation and Smart Infrastructure
- Growing demand for automation and intelligent monitoring is a major driver for the cyber-physical systems market. Organizations are increasingly implementing cyber-physical systems to enhance operational efficiency, enable predictive maintenance, and reduce operational risks. This trend is also encouraging investments in advanced automation technologies and connected industrial ecosystems
- Expanding deployment across manufacturing, healthcare, transportation, and energy sectors is influencing market growth. Cyber-physical systems help improve process control, asset management, and system performance, enabling organizations to optimize operations and reduce downtime. The increasing adoption of smart factories and intelligent infrastructure globally is further reinforcing market expansion
- Technology providers and industrial companies are actively promoting cyber-physical system-based solutions through product innovation and strategic partnerships. These initiatives are supported by the growing focus on digital transformation, operational efficiency, and sustainability. Partnerships between technology developers and industrial operators are helping enhance system capabilities and accelerate implementation
- For instance, in 2023, IBM in the U.S. and Bosch in Germany expanded their cyber-physical system solutions for smart manufacturing and infrastructure projects. These developments enabled real-time monitoring, predictive analytics, and improved asset performance. Both companies emphasized digital transformation benefits to strengthen customer adoption and competitive positioning
- Although increasing automation demand supports growth, wider adoption depends on addressing integration complexity, cybersecurity concerns, and investment costs. Continued advancements in secure connectivity, scalable platforms, and system interoperability will be essential for supporting long-term market expansion
Restraint/Challenge
High Implementation Costs and Cybersecurity Risks
- The high initial cost of implementing cyber-physical systems remains a key challenge, particularly for small and medium-sized enterprises. Expenses related to hardware, software, integration, and maintenance increase overall investment requirements. These financial barriers can limit adoption, especially in cost-sensitive industries and developing markets
- Cybersecurity and data privacy concerns also restrict market growth, as cyber-physical systems involve continuous connectivity and data exchange. Vulnerabilities in connected systems can expose critical infrastructure to cyber threats. This has increased the need for advanced security solutions, which further adds to implementation complexity and cost
- Integration with legacy systems presents additional challenges, as many organizations operate outdated infrastructure not designed for digital connectivity. Compatibility issues and technical limitations increase deployment time and operational risks. Companies must invest in system upgrades and skilled professionals to ensure successful implementation
- For instance, in 2024, industrial operators in India and Brazil working with automation providers such as Schneider Electric and Honeywell reported slower adoption due to high deployment costs and cybersecurity concerns. These factors increased implementation timelines and required additional investments in secure infrastructure, limiting rapid adoption in certain facilities
- Overcoming these challenges will require cost-effective solutions, improved cybersecurity frameworks, and simplified integration technologies. Strengthening technical expertise, enhancing system security, and developing scalable solutions will be essential to support widespread adoption and unlock the full growth potential of the global cyber-physical systems market
Cyber-Physical Systems Market Scope
The market is segmented on the basis of type, component, deployment type, and end-use.
- By Type
On the basis of type, the cyber-physical systems market is segmented into EP-CPS, IT-CPS, and Others. The EP-CPS segment held the largest market revenue share in 2025 driven by its extensive use in industrial automation, energy systems, and manufacturing environments where tight integration between physical processes and embedded computing is essential. EP-CPS enables real-time monitoring, control, and optimization of industrial operations, making it a preferred choice for critical infrastructure and production facilities.
The IT-CPS segment is expected to witness the fastest growth rate from 2026 to 2033, driven by the increasing integration of cyber-physical systems with enterprise IT infrastructure and cloud platforms. IT-CPS enhances data processing, remote monitoring, and intelligent decision-making capabilities, making it highly suitable for smart enterprises, connected healthcare systems, and advanced transportation networks.
- By Component
On the basis of component, the cyber-physical systems market is segmented into Hardware, Software, and Services. The Hardware segment held the largest market revenue share in 2025 driven by the growing deployment of sensors, controllers, embedded systems, and communication devices required to enable physical and digital integration. These hardware components form the foundation of cyber-physical systems, supporting real-time data collection and system control.
The Software segment is expected to witness the fastest growth rate from 2026 to 2033, driven by the increasing demand for analytics platforms, system monitoring tools, and intelligent control software. Software solutions enable data processing, predictive maintenance, and automation, helping organizations improve operational efficiency and decision-making capabilities.
- By Deployment Type
On the basis of deployment type, the cyber-physical systems market is segmented into On Premises and Cloud. The On Premises segment held the largest market revenue share in 2025 driven by its widespread adoption in industries requiring high security, data control, and reliable system performance such as manufacturing, energy, and defense. On premises deployment allows organizations to maintain full control over infrastructure and sensitive operational data.
The Cloud segment is expected to witness the fastest growth rate from 2026 to 2033, driven by its scalability, flexibility, and ability to support remote monitoring and centralized system management. Cloud deployment enables real-time access to system data, reduces infrastructure costs, and supports advanced analytics, making it increasingly attractive for modern industrial and enterprise applications.
- By End-Use
On the basis of end-use, the cyber-physical systems market is segmented into Healthcare, Energy, Automation, Agriculture, Manufacturing, Transportation, and Others. The Manufacturing segment held the largest market revenue share in 2025 driven by the increasing adoption of smart factories, industrial automation, and predictive maintenance solutions. Cyber-physical systems help manufacturers improve productivity, reduce downtime, and enhance operational efficiency.
The Healthcare segment is expected to witness the fastest growth rate from 2026 to 2033, driven by the increasing use of connected medical devices, remote patient monitoring systems, and intelligent healthcare infrastructure. Cyber-physical systems enable real-time patient monitoring, improve healthcare delivery, and support advanced medical technologies, contributing to market growth.
Cyber-Physical Systems Market Regional Analysis
- North America dominated the cyber-physical systems market with the largest revenue share of 34.50% in 2025, driven by strong adoption of industrial automation, smart manufacturing, and advanced digital infrastructure across industries such as manufacturing, healthcare, and energy
- Organizations in the region highly prioritize operational efficiency, predictive maintenance, and real-time monitoring enabled by cyber-physical systems to improve productivity and reduce operational risks
- This widespread adoption is further supported by the presence of advanced technology providers, high digital investment capacity, and growing focus on Industry 4.0, establishing cyber-physical systems as a critical component of modern industrial and infrastructure development
U.S. Cyber-Physical Systems Market Insight
The U.S. cyber-physical systems market captured the largest revenue share in 2025 within North America, fueled by rapid adoption of smart manufacturing, connected infrastructure, and intelligent automation solutions. Organizations are increasingly focusing on improving operational performance, reducing downtime, and enhancing system reliability through real-time monitoring and predictive analytics. The growing deployment of industrial IoT, along with strong investment in digital transformation and smart infrastructure, continues to drive market expansion across multiple sectors.
Europe Cyber-Physical Systems Market Insight
The Europe cyber-physical systems market is expected to witness the fastest growth rate from 2026 to 2033, primarily driven by strong emphasis on industrial automation, digitalization, and smart infrastructure development. Increasing focus on energy efficiency, operational optimization, and intelligent transportation systems is encouraging adoption across industries. The region is experiencing rising implementation of cyber-physical systems in manufacturing, automotive, and energy sectors, supported by innovation initiatives and advanced industrial capabilities.
U.K. Cyber-Physical Systems Market Insight
The U.K. cyber-physical systems market is expected to witness the fastest growth rate from 2026 to 2033, driven by increasing adoption of smart manufacturing and digital industrial solutions. Businesses are focusing on improving productivity, operational efficiency, and system automation to remain competitive. The country’s strong technological base, combined with increasing investments in connected infrastructure and industrial innovation, is contributing to the growing deployment of cyber-physical systems.
Germany Cyber-Physical Systems Market Insight
The Germany cyber-physical systems market is expected to witness the fastest growth rate from 2026 to 2033, fueled by its strong manufacturing sector and leadership in Industry 4.0 initiatives. German industries are increasingly adopting cyber-physical systems to enable smart factories, improve process efficiency, and support intelligent automation. The country’s focus on engineering excellence, innovation, and industrial digitalization is accelerating the integration of cyber-physical systems across production facilities.
Asia-Pacific Cyber-Physical Systems Market Insight
The Asia-Pacific cyber-physical systems market is expected to witness the fastest growth rate from 2026 to 2033, driven by rapid industrialization, expanding manufacturing activities, and increasing investment in digital infrastructure. Governments and businesses across the region are focusing on automation, smart cities, and connected industrial systems to improve efficiency and competitiveness. The region’s emergence as a global manufacturing hub is further accelerating adoption across multiple industries.
Japan Cyber-Physical Systems Market Insight
The Japan cyber-physical systems market is expected to witness the fastest growth rate from 2026 to 2033 due to its advanced technological ecosystem and strong focus on industrial automation and robotics. Japanese industries are increasingly integrating cyber-physical systems to improve production efficiency, enhance system reliability, and support smart manufacturing. The country’s emphasis on innovation and connected infrastructure is further driving market growth.
China Cyber-Physical Systems Market Insight
The China cyber-physical systems market accounted for the largest market revenue share in Asia Pacific in 2025, attributed to rapid industrial expansion, growing adoption of smart manufacturing, and strong government support for digital transformation. China is one of the largest manufacturing economies, and industries are increasingly adopting cyber-physical systems to enhance productivity and automation. The development of smart factories and connected infrastructure, along with the presence of major domestic technology providers, is significantly contributing to market growth.
Cyber-Physical Systems Market Share
The Cyber-Physical Systems industry is primarily led by well-established companies, including:
- Microsoft (U.S.)
- IBM (U.S.)
- Hewlett Packard Enterprise Development LP (U.S.)
- Dell Inc (U.S.)
- VMware, Inc (U.S.)
- Schneider Electric (France)
- SAP SE (Germany)
- Honeywell International Inc (U.S.)
- Hitachi Vantara Corporation (U.S.)
- Intel Corporation (U.S.)
- Oracle (U.S.)
- Siemens (Germany)
Latest Developments in Global Cyber-Physical Systems Market
- In January 2025, Dragos Inc. announced a partnership with Yokogawa Electric Corporation to enhance industrial cybersecurity capabilities, enabling Yokogawa to deliver comprehensive protection solutions for critical infrastructure, which will strengthen asset security, improve operational resilience, and accelerate adoption of secure cyber-physical systems globally
- In March 2024, Claroty announced funding, raising USD 100 million to expand its cyber-physical systems security platform, which will support technology innovation, strengthen protection across critical infrastructure sectors, and drive market growth by increasing adoption of advanced cybersecurity solutions
- In March 2024, Nozomi Networks Inc. announced a partnership with Yokogawa Electric Corporation to deliver managed OT and IoT security services, enabling enhanced threat detection, network visibility, and cybersecurity management, which will improve protection for process industries and support wider cyber-physical system deployment
- In February 2024, Intel announced a product launch, introducing its next-generation embedded cyber-physical systems chipset for automotive and aerospace applications, which offers 48% faster processing and 55% improved energy efficiency, strengthening high-performance system capabilities and accelerating innovation in advanced CPS applications
- In November 2023, Claroty announced a partnership expansion with Rockwell Automation to integrate its xDome cybersecurity platform into Rockwell’s services portfolio, enabling customers to access advanced OT security solutions, enhancing secure digital transformation, and strengthening cybersecurity adoption across industrial cyber-physical systems
- In 2023, Siemens announced a product launch, introducing an advanced cyber-physical automation platform for smart factories, which will enhance industrial automation, improve operational efficiency, and support the expansion of intelligent manufacturing, driving overall growth in the cyber-physical systems market
SKU-
Get online access to the report on the World's First Market Intelligence Cloud

- Interactive Data Analysis Dashboard
- Company Analysis Dashboard for high growth potential opportunities
- Research Analyst Access for customization & queries
- Competitor Analysis with Interactive dashboard
- Latest News, Updates & Trend analysis
- Harness the Power of Benchmark Analysis for Comprehensive Competitor Tracking
Research Methodology
Data collection and base year analysis are done using data collection modules with large sample sizes. The stage includes obtaining market information or related data through various sources and strategies. It includes examining and planning all the data acquired from the past in advance. It likewise envelops the examination of information inconsistencies seen across different information sources. The market data is analysed and estimated using market statistical and coherent models. Also, market share analysis and key trend analysis are the major success factors in the market report. To know more, please request an analyst call or drop down your inquiry.
The key research methodology used by DBMR research team is data triangulation which involves data mining, analysis of the impact of data variables on the market and primary (industry expert) validation. Data models include Vendor Positioning Grid, Market Time Line Analysis, Market Overview and Guide, Company Positioning Grid, Patent Analysis, Pricing Analysis, Company Market Share Analysis, Standards of Measurement, Global versus Regional and Vendor Share Analysis. To know more about the research methodology, drop in an inquiry to speak to our industry experts.
Customization Available
Data Bridge Market Research is a leader in advanced formative research. We take pride in servicing our existing and new customers with data and analysis that match and suits their goal. The report can be customized to include price trend analysis of target brands understanding the market for additional countries (ask for the list of countries), clinical trial results data, literature review, refurbished market and product base analysis. Market analysis of target competitors can be analyzed from technology-based analysis to market portfolio strategies. We can add as many competitors that you require data about in the format and data style you are looking for. Our team of analysts can also provide you data in crude raw excel files pivot tables (Fact book) or can assist you in creating presentations from the data sets available in the report.


