Global Cryptocurrency Mining Market
Market Size in USD Billion
CAGR :
%

![]() |
2025 –2032 |
![]() |
USD 1.55 Billion |
![]() |
USD 2.83 Billion |
![]() |
|
![]() |
Global Cryptocurrency Mining Market Segmentation, By Mining Enterprise (Large Miners and Small Miners), Revenue Source (Transaction Fees and Block Rewards), Mining Type (Self-Mining, Cloud Mining Services, and Remote Hosting Services), Hardware (ASIC, GPU, CPU, And Others), Application (Bitcoin Mining and Ethereum Mining), End User (Personal and Enterprise), Market Capitalization (Bitcoin, Ethereum, Ripple, Bitcoin Cash, and Cardano) - Industry Trends And Forecast To 2032
Cryptocurrency Mining Market Size
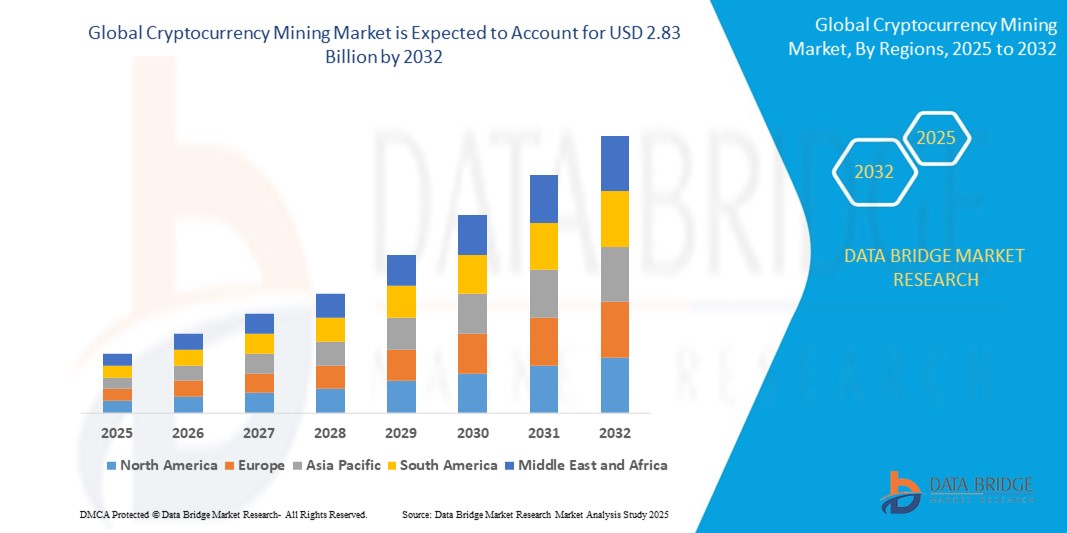
- The global cryptocurrency mining market was valued at USD 1.55 billion in 2024 and is expected to reach USD 2.83 billion by 2032
- During the forecast period of 2025 to 2032 the market is likely to grow at a CAGR of 7.8%, primarily driven by increasing adoption of blockchain technologies and rising interest in decentralized finance
- This growth is driven by factors such as increasing demand for cryptocurrencies, the emergence of energy-efficient mining hardware, and favorable regulatory frameworks in emerging economies
Cryptocurrency Mining Market Analysis
- Cryptocurrency mining is a foundational process in blockchain ecosystems, involving the validation of transactions and the creation of new digital assets such as Bitcoin and Ethereum. It relies on high-performance hardware, such as ASICs and GPUs, to solve complex mathematical problems and maintain decentralized ledgers
- The demand for cryptocurrency mining is significantly driven by the increasing mainstream adoption of digital assets and ongoing technological innovation in mining equipment. For instance, in 2024, Intel launched its second-generation Blockscale ASIC chips, aimed at enhancing energy efficiency in Bitcoin mining, signaling a shift toward sustainable practices in the industry
- The North America region stands out as one of the dominant regions for cryptocurrency mining, driven by large-scale investments and the availability of renewable energy sources
- For instance, Marathon Digital Holdings, one of the largest U.S.-based Bitcoin mining companies, announced its expansion of mining operations using wind and solar power across Texas and North Dakota in 2024 to reduce its carbon footprint and increase mining capacity
- Globally, Bitcoin continues to account for the largest share of mining activity, but the landscape is diversifying. With Ethereum's shift to a Proof-of-Stake (PoS) model completed in 2022, miners are increasingly turning to mine altcoins such as Litecoin and Ethereum Classic. Furthermore, Bitmain's 2024 launch of its Antminer S21 series—offering record-breaking hash rates—has set a new benchmark for performance in the mining hardware market
Report Scope and Cryptocurrency Mining Market Segmentation
Attributes |
Cryptocurrency Mining Microscope Key Market Insights |
Segments Covered |
|
Countries Covered |
North America
Europe
Asia-Pacific
Middle East and Africa
South America
|
Key Market Players |
|
Market Opportunities |
|
Value Added Data Infosets |
In addition to the insights on market scenarios such as market value, growth rate, segmentation, geographical coverage, and major players, the market reports curated by the Data Bridge Market Research also include import export analysis, production capacity overview, production consumption analysis, price trend analysis, climate change scenario, supply chain analysis, value chain analysis, raw material/consumables overview, vendor selection criteria, PESTLE Analysis, Porter Analysis, and regulatory framework. |
Cryptocurrency Mining Market Trends
“Shift Toward Sustainable and Energy-Efficient Mining Solutions”
- One prominent trend in the global cryptocurrency mining market is the accelerating shift toward sustainable and energy-efficient mining solutions
- This trend is being driven by the increasing scrutiny of the environmental impact of mining operations and the growing demand from investors, governments, and communities for greener blockchain practices
- For instance, In 2024, Marathon Digital Holdings expanded its operations using renewable energy sources such as wind and solar in Texas and North Dakota, aiming to power over 50% of its mining facilities with green energy
- In late 2023, Bitmain launched the Antminer S21, boasting a record-breaking energy efficiency of 16 J/TH, setting a new standard for low-power, high-output mining hardware
- In addition, several companies are adopting immersion cooling technology—a method where mining rigs are submerged in liquid coolant—to reduce heat waste and improve hardware longevity. Companies such as LiquidStack and Bitfury have piloted such systems in their 2024 operations.
- This trend is transforming the mining industry’s infrastructure, helping miners cut operational costs, meet environmental compliance, and future-proof their setups—driving continued growth and investment in the global cryptocurrency mining ecosystem
Cryptocurrency Mining Market Dynamics
Driver
“Growing Demand Driven by Surge in Digital Assets and Blockchain Adoption”
- The rising global interest in cryptocurrencies—particularly Bitcoin and other proof-of-work assets—is significantly contributing to the increasing demand for cryptocurrency mining operations
- As digital assets become more integrated into mainstream finance, institutional and retail investors alike are turning to mining as a strategic entry point into blockchain ecosystems
- Bitcoin, the leading mined cryptocurrency, has a capped supply of 21 million coins, and as mining rewards halve every four years, the need for efficient and scalable mining infrastructure is growing among both small-scale and industrial miners
- The advancement of blockchain applications beyond currency—such as in Web3, NFTs, and DeFi (Decentralized Finance)—is driving further demand for mining to support the underlying network activity, especially for cryptocurrencies that still rely on proof-of-work validation
For instance,
- In January 2024, Bitmain launched the Antminer S21, with a 200 TH/s hash rate and 16 J/TH energy efficiency, addressing the growing need for high-performance and energy-optimized mining equipment amid rising mining difficulty
- In March 2024, CleanSpark Inc., a U.S.-based Bitcoin mining firm, acquired two new mining sites in Mississippi, increasing its hash rate capacity by 2.4 EH/s to meet growing network demands while focusing on sustainability through renewable energy integration
- As blockchain usage expands globally, and cryptocurrencies become more recognized in traditional financial systems, the demand for robust, scalable, and energy-efficient mining setups continues to rise—solidifying this trend as a core driver of the cryptocurrency mining market
Opportunity
“Enhancing Mining Operations Through Artificial Intelligence and Automation”
- AI-powered technologies are rapidly transforming the cryptocurrency mining landscape by optimizing energy usage, automating operational workflows, and maximizing hardware efficiency
- AI and machine learning (ML) algorithms can analyze vast datasets in real time to predict optimal mining conditions, identify hardware inefficiencies, and dynamically switch mining strategies across different cryptocurrencies to increase profitability
- In addition, AI systems can monitor energy consumption, detect overheating or equipment malfunction, and perform predictive maintenance—reducing downtime and extending the lifespan of mining rigs
For instance,
- In June 2024, NVIDIA announced a partnership with blockchain firms to integrate its AI capabilities into mining operations, offering advanced analytics to optimize GPU performance and adapt to market shifts in real time
- In December 2023, Bitdeer Technologies Group, a major player in crypto mining services, deployed AI-powered immersion cooling systems to regulate equipment temperatures and improve energy efficiency across its U.S. and Southeast Asia facilities
- The integration of AI into mining infrastructure presents a major opportunity for miners to boost efficiency, comply with environmental regulations, and remain profitable as mining difficulty increases. These innovations are shaping a new generation of intelligent, adaptive, and cost-effective mining ecosystems—poised to meet the future demands of a rapidly evolving digital economy
Restraint/Challenge
“High Equipment and Operational Costs Hindering Market Penetration”
- The high capital expenditure required for cryptocurrency mining operations—particularly for specialized hardware, infrastructure, and energy—continues to pose a significant barrier to market entry, especially for small and medium-sized enterprises
- Advanced mining equipment, such as ASIC miners, can cost thousands of dollars per unit, with top-tier models such as the Antminer S21 exceeding USD 5,000 – USD 7,000, not including the cost of cooling systems, facility setup, and continuous energy expenses
- This financial burden is exacerbated by market volatility, fluctuating coin values, and rising global electricity costs, which collectively reduce profit margins and make it difficult for new entrants to justify long-term investments
For instance,
- In March 2024, Luxor Technologies, a major mining software provider, published a mining profitability report showing that over 30% of Bitcoin miners were operating at or near breakeven, particularly those using older-generation equipment, due to the rising global hash rate and operational costs
- In addition, the U.S. Energy Information Administration’s (EIA) temporary emergency data collection on crypto mining energy use in early 2024 highlighted concerns about the economic and environmental sustainability of high-consumption operations, further deterring smaller players from scaling or entering the market
- As a result, the high upfront and ongoing costs of mining equipment, coupled with the uncertain regulatory and energy landscape, limit broader market participation—especially in emerging economies—ultimately hindering the full potential and decentralization of the global cryptocurrency mining ecosystem
Cryptocurrency Mining Market Scope
The market is segmented on the basis mining enterprise, revenue source, mining type, hardware application, end user, and market capitalization
Segmentation |
Sub-Segmentation |
By Mining Market |
|
By Revenue Source |
|
By Mining Type |
|
By Hardware |
|
By Application |
|
By End-user |
|
By Market Capitalization |
|
Cryptocurrency Mining Market Regional Analysis
“North America is the Dominant Region in the Cryptocurrency Mining Market”
- North America leads the global cryptocurrency mining market, fueled by access to low-cost energy sources, favorable business infrastructure, and a growing number of institutional mining firms
- The U.S. holds the largest share in the region, driven by its robust digital economy, progressive blockchain adoption, and regulatory clarity compared to other regions
- Several large-scale mining companies, such as Riot Platforms, CleanSpark, and Marathon Digital Holdings, have significantly expanded their operations across states such as Texas, Georgia, and North Dakota, leveraging abundant renewable and surplus energy
- In addition, the region benefits from technological innovation and the availability of advanced mining hardware and AI-driven optimization tools, further reinforcing its dominance
“Asia-Pacific is Projected to Register the Highest Growth Rate”
- The Asia-Pacific region is anticipated to experience the fastest growth in the cryptocurrency mining market, driven by technological advancement, increasing digital asset adoption, and favorable government initiatives in select markets
- Countries such as China, Kazakhstan, Malaysia, and Indonesia are emerging as significant contributors due to a combination of affordable electricity, expanding data center infrastructure, and a growing base of crypto-savvy users
- Despite past restrictions, China remains a strategic hub for mining hardware manufacturing (notably in Shenzhen), which continues to fuel hardware accessibility and innovation throughout the region
- Meanwhile, Kazakhstan and Malaysia are attracting mining investments due to crypto-friendly tax frameworks and large-scale infrastructure projects tailored to blockchain and mining operations
Cryptocurrency Mining Market Share
The market competitive landscape provides details by competitor. Details included are company overview, company financials, revenue generated, market potential, investment in research and development, new market initiatives, global presence, production sites and facilities, production capacities, company strengths and weaknesses, product launch, product width and breadth, application dominance. The above data points provided are only related to the companies' focus related to market.
The Major Market Leaders Operating in the Market Are:
- Argo Blockchain Plc (U.K.)
- Bitfarms Ltd. (Canada)
- BitMain Group (China)
- Canaan Inc. (China)
- Ebang International Holdings Inc. (China)
- Elite Mining Inc. (U.S.)
- ePIC Blockchain Technologies Inc. (Canada)
- Genesis Mining Ltd. (Iceland)
- GMO Internet Group Inc. (Japan)
- Helium Systems Inc. (U.S.)
- HIVE Blockchain Technologies Ltd. (Canada)
- Hut 8 Corp. (Canada)
- INNOSILICON Technology Ltd. (China)
- Intelion Mine LLC (Russia)
- Marathon Digital Holdings Inc. (U.S.)
- NiceHash Ltd. (Slovenia)
- Riot Blockchain Inc. (U.S.)
- Shenzhen Jingang Zhuoyue Co. Ltd (China)
- Shenzhen MicroBT Electronics Technology Co. Ltd (China)
- Spacemesh (Israel)
Latest Developments in Global Cryptocurrency Mining Market
- In December 2023, Bitfinex Securities Ltd. raised USD 5.2 million in USDT through its tokenized bond, ALT2612. The funding round was facilitated by ALTERNATIVE, a securitization fund based in Luxembourg, and managed by the well-known microfinancing firm, Mikro Kapita
- In October 2023, Quantstamp, a leading name in Web3 security, launched DeFi Protection—an advanced security solution designed to compensate users for losses incurred in DeFi. This innovative product provides comprehensive smart contract security analysis, real-time risk alerts, and 24/7 support from expert security auditors
- In January 2022, Hut 8 Mining Corp. announced the acquisition of TeraGo Inc.'s cloud and co-location data center business. The deal includes five data centers across Canada and a full suite of scalable cloud services. This strategic move is set to support Hut 8’s expansion efforts, enhancing both its business operations and customer base in the market
- In August 2021, iMining Technologies Inc. announced the acquisition of three operational, cloud-based validators supporting the Ethereum Proof-of-Stake (Eth2.0) blockchain. This strategic acquisition is expected to reduce fees and preserve weeks of staking rewards, contributing to the company’s growth and operational efficiency
SKU-
Get online access to the report on the World's First Market Intelligence Cloud
- Interactive Data Analysis Dashboard
- Company Analysis Dashboard for high growth potential opportunities
- Research Analyst Access for customization & queries
- Competitor Analysis with Interactive dashboard
- Latest News, Updates & Trend analysis
- Harness the Power of Benchmark Analysis for Comprehensive Competitor Tracking
Table of Content
1 INTRODUCTION
1.1 OBJECTIVES OF THE STUDY
1.2 MARKET DEFINITION
1.3 OVERVIEW OF GLOBAL CRYPTOCURRENCY MINING MARKET
1.4 CURRENCY AND PRICING
1.5 LIMITATIONS
1.6 MARKETS COVERED
2 MARKET SEGMENTATION
2.1 MARKETS COVERED
2.2 GEOGRAPHICAL SCOPE
2.3 YEARS CONSIDERED FOR THE STUDY
2.4 DBMR TRIPOD DATA VALIDATION MODEL
2.5 PRIMARY INTERVIEWS WITH KEY OPINION LEADERS
2.6 DBMR MARKET POSITION GRID
2.7 VENDOR SHARE ANALYSIS
2.8 THE MARKET CHALLENGE MATRIX
2.9 MULTIVARIATE MODELING
2.1 MINING ENTERPRISE TIMELINE CURVE
2.11 SECONDARY SOURCES
2.12 ASSUMPTIONS
3 EXECUTIVE SUMMARY
4 PREMIUM INSIGHTS
4.1 CRYPTOCURRENCY MINING ANALYSIS
4.2 BITMAIN ANTMINER S9
4.3 IN THE U.S., THE AVERAGE ELECTRICITY COST IS AROUND USD 0.11 CENTS PER KILOWATT-HOUR.
5 REGIONAL SUMMARY
6 MARKET OVERVIEW
6.1 DRIVERS
6.1.1 RISE IN THE POPULARITY OF MINING POOLS
6.1.2 INCREASING ADOPTION OF CRYPTOCURRENCY IN THE FINANCIAL MARKET
6.1.3 INCREASING DEMAND FOR CRYPTOCURRENCY-SPECIFIC HARDWARE
6.1.4 INCREASING PENETRATION OF THE INTERNET AND SMARTPHONES
6.2 RESTRAINTS
6.2.1 HIGH TRANSACTION FEES
6.2.2 BAN OF CRYPTOCURRENCY MINING
6.3 OPPORTUNITIES
6.3.1 INCREASE IN VARIOUS STRATEGIC DECISIONS SUCH AS PARTNERSHIP AND ACQUISITION
6.3.2 DEVELOPMENTS IN THE HARDWARE AND SOFTWARE
6.4 CHALLENGES
6.4.1 ENVIRONMENTAL IMPACT OF CRYPTOCURRENCY MINING
6.4.2 MISUSE OF VIRTUAL CURRENCY AND SECURITY ATTACK
7 IMPACT ANALYSIS OF COVID-19 ON GLOBAL CRYPTOCURRENCY MINING MARKET
7.1 ANALYSIS ON IMPACT OF COVID-19 ON THE MARKET
7.2 STRATEGIC DECISION BY MANUFACTURERS AFTER COVID-19
7.3 IMPACT ON DEMAND
7.4 IMPACT ON PRICE
7.5 IMPACT ON SUPPLY CHAIN
7.6 CONCLUSION
8 GLOBAL CRYPTOCURRENCY MINING MARKET, BY MINING ENTERPRISE
8.1 OVERVIEW
8.2 LARGE MINERS
8.3 SMALL MINERS
9 GLOBAL CRYPTOCURRENCY MINING MARKET, BY REVENUE SOURCE
9.1 OVERVIEW
9.2 BLOCK REWARDS
9.3 TRANSACTION FEES
10 GLOBAL CRYPTOCURRENCY MINING MARKET, BY MINING TYPE
10.1 OVERVIEW
10.2 REMOTE HOSTING SERVICES
10.3 CLOUD MINING SERVICES
10.4 SELF-MINING
11 GLOBAL CRYPTOCURRENCY MINING MARKET, BY HARDWARE
11.1 OVERVIEW
11.2 ASIC
11.3 GPU
11.4 CPU
11.5 OTHER
12 GLOBAL CRYPTOCURRENCY MINING MARKET, BY REGION
12.1 OVERVIEW
12.2 NORTH AMERICA
12.2.1 U.S.
12.2.2 CANADA
12.2.3 MEXICO
12.3 EUROPE
12.3.1 GERMANY
12.3.2 U.K.
12.3.3 FRANCE
12.3.4 RUSSIA
12.3.5 SWITZERLAND
12.3.6 NETHERLANDS
12.3.7 TURKEY
12.3.8 SPAIN
12.3.9 ITALY
12.3.10 BELGIUM
12.3.11 REST OF EUROPE
12.4 ASIA-PACIFIC
12.4.1 CHINA
12.4.2 AUSTRALIA
12.4.3 JAPAN
12.4.4 SOUTH KOREA
12.4.5 SINGAPORE
12.4.6 INDIA
12.4.7 THAILAND
12.4.8 MALAYSIA
12.4.9 PHILIPPINES
12.4.10 INDONESIA
12.4.11 REST OF ASIA-PACIFIC
12.5 MIDDLE EAST & AFRICA
12.5.1 SAUDI ARABIA
12.5.2 U.A.E.
12.5.3 SOUTH AFRICA
12.5.4 ISRAEL
12.5.5 EGYPT
12.5.6 REST OF MIDDLE EAST & AFRICA
12.6 SOUTH AMERICA
12.6.1 BRAZIL
12.6.2 ARGENTINA
12.6.3 REST OF SOUTH AMERICA
13 GLOBAL CRYPTOCURRENCY MINING MARKET:COMPANY LANDSCAPE
13.1 COMPANY SHARE ANALYSIS: GLOBAL
13.2 COMPANY SHARE ANALYSIS: NORTH AMERICA
13.3 COMPANY SHARE ANALYSIS: EUROPE
13.4 COMPANY SHARE ANALYSIS: ASIA-PACIFIC
14 SWOT ANALYSIS
15 COMPANY PROFILE
15.1 CANAAN INC.
15.1.1 COMPANY SNAPSHOT
15.1.2 REVENUE ANALYSIS
15.1.3 COMPANY SHARE ANALYSIS
15.1.4 PRODUCT PORTFOLIO
15.1.5 RECENT DEVELOPMENTS
15.2 ARGO BLOCKCHAIN
15.2.1 COMPANY SNAPSHOT
15.2.2 REVENUE ANALYSIS
15.2.3 COMPANY SHARE ANALYSIS
15.2.4 PRODUCT PORTFOLIO
15.2.5 RECENT DEVELOPMENTS
15.3 HIVE BLOCKCHAIN TECHNOLOGIES LTD.
15.3.1 COMPANY SNAPSHOT
15.3.2 REVENUE ANALYSIS
15.3.3 COMPANY SHARE ANALYSIS
15.3.4 PRODUCT PORTFOLIO
15.3.5 RECENT DEVELOPMENTS
15.4 BIT DIGITAL, INC.
15.4.1 COMPANY SNAPSHOT
15.4.2 REVENUE ANALYSIS
15.4.3 COMPANY SHARE ANALYSIS
15.4.4 PRODUCT PORTFOLIO
15.4.5 RECENT DEVELOPMENTS
15.5 RIOT BLOCKCHAIN, INC.
15.5.1 COMPANY SNAPSHOT
15.5.2 REVENUE ANALYSIS
15.5.3 COMPANY SHARE ANALYSIS
15.5.4 SERVICE PORTFOLIO
15.5.5 RECENT DEVELOPMENTS
15.6 ASICMINER COMPANY
15.6.1 COMPANY SNAPSHOT
15.6.2 PRODUCT PORTFOLIO
15.6.3 RECENT DEVELOPMENT
15.7 BRAIINS SYSTEMS S.R.O.
15.7.1 COMPANY SNAPSHOT
15.7.2 PRODUCT PORTFOLIO
15.7.3 RECENT DEVELOPMENTS
15.8 BITMAIN TECHNOLOGIES HOLDING COMPANY
15.8.1 COMPANY SNAPSHOT
15.8.2 PRODUCT PORTFOLIO
15.8.3 RECENT DEVELOPMENTS
15.9 CORE SCIENTIFIC, INC., INC., INC.
15.9.1 COMPANY SNAPSHOT
15.9.2 PRODUCT PORTFOLIO
15.9.3 RECENT DEVELOPMENTS
15.1 F2POOL
15.10.1 COMPANY SNAPSHOT
15.10.2 PRODUCT PORTFOLIO
15.10.3 RECENT DEVELOPMENT
15.11 GENESIS MINING LTD
15.11.1 COMPANY SNAPSHOT
15.11.2 PRODUCT PORTFOLIO
15.11.3 RECENT DEVELOPMENT
15.12 GMO INTERNET, INC., INC., INC.
15.12.1 COMPANY SNAPSHOT
15.12.2 REVENUE ANALYSIS
15.12.3 SERVICE PORTFOLIO
15.12.4 RECENT DEVELOPMENTS
15.13 HUT 8 MINING CORP.
15.13.1 COMPANY SNAPSHOT
15.13.2 REVENUE ANALYSIS
15.13.3 SERVICE PORTFOLIO
15.13.4 RECENT DEVELOPMENTS
15.14 IMINING TECHNOLOGIES INC.
15.14.1 COMPANY SNAPSHOT
15.14.2 SERVICE PORTFOLIO
15.14.3 RECENT DEVELOPMENTS
15.15 INNOSILICON TECHNOLOGY LTD.
15.15.1 COMPANY SNAPSHOT
15.15.2 PRODUCT PORTFOLIO
15.15.3 RECENT DEVELOPMENT
15.16 MINERGATE
15.16.1 COMPANY SNAPSHOT
15.16.2 PRODUCT PORTFOLIO
15.16.3 RECENT DEVELOPMENT
15.17 MININGSKY (A SUBSIDIARY OF SKYCHAIN TECHNOLOGIES INC.)
15.17.1 COMPANY SNAPSHOT
15.17.2 REVENUE ANALYSIS
15.17.3 PRODUCT PORTFOLIO
15.17.4 RECENT DEVELOPMENT
15.18 MININGSTORE.COM
15.18.1 COMPANY SNAPSHOT
15.18.2 PRODUCT PORTFOLIO
15.18.3 RECENT DEVELOPMENT
15.19 SHENZHEN MICROBT ELECTRONICS TECHNOLOGY CO., LTD
15.19.1 COMPANY SNAPSHOT
15.19.2 PRODUCT PORTFOLIO
15.19.3 RECENT DEVELOPMENT
15.2 VIABTC
15.20.1 COMPANY SNAPSHOT
15.20.2 PRODUCT PORTFOLIO
15.20.3 RECENT DEVELOPMENTS
16 QUESTIONNAIRE
17 RELATED REPORTS
List of Table
TABLE 1 CRYPTOCURRENCY MINING ANALYSIS
TABLE 2 GLOBAL CRYPTOCURRENCY MINING MARKET, BY MINING ENTERPRISE, 2020-2029 (USD MILLION)
TABLE 3 GLOBAL LARGE MINERS IN CRYPTOCURRENCY MINING MARKET, BY REGION, 2020-2029 (USD MILLION)
TABLE 4 GLOBAL SMALL MINERS IN CRYPTOCURRENCY MINING MARKET, BY REGION, 2020-2029 (USD MILLION)
TABLE 5 GLOBAL CRYPTOCURRENCY MINING MARKET, BY REVENUE SOURCE, 2020-2029 (USD MILLION)
TABLE 6 GLOBAL BLOCK REWARDS IN CRYPTOCURRENCY MINING MARKET, BY REGION, 2020-2029 (USD MILLION)
TABLE 7 GLOBAL TRANSACTION FEES IN CRYPTOCURRENCY MINING MARKET, BY REGION, 2020-2029 (USD MILLION)
TABLE 8 GLOBAL CRYPTOCURRENCY MINING MARKET, BY MINING TYPE, 2020-2029 (USD MILLION)
TABLE 9 GLOBAL REMOTE HOSTING SERVICES IN CRYPTOCURRENCY MINING MARKET, BY REGION, 2020-2029 (USD MILLION)
TABLE 10 GLOBAL CLOUD MINING SERVICES IN CRYPTOCURRENCY MINING MARKET, BY REGION, 2020-2029 (USD MILLION)
TABLE 11 GLOBAL SELF-MINING IN CRYPTOCURRENCY MINING MARKET, BY REGION, 2020-2029 (USD MILLION)
TABLE 12 GLOBAL CRYPTOCURRENCY MINING MARKET, BY HARDWARE, 2020-2029 (USD MILLION)
TABLE 13 GLOBAL ASIC IN CRYPTOCURRENCY MINING MARKET, BY REGION, 2020-2029 (USD MILLION)
TABLE 14 GLOBAL GPU IN CRYPTOCURRENCY MINING MARKET, BY REGION, 2020-2029 (USD MILLION)
TABLE 15 GLOBAL CPU IN CRYPTOCURRENCY MINING MARKET, BY REGION, 2020-2029 (USD MILLION)
TABLE 16 GLOBAL OTHER IN CRYPTOCURRENCY MINING MARKET, BY REGION, 2020-2029 (USD MILLION)
TABLE 17 GLOBAL CRYPTOCURRENCY MINING MARKET, BY REGION, 2020-2029 (USD MILLION)
TABLE 18 NORTH AMERICA CRYPTOCURRENCY MINING MARKET, BY COUNTRY, 2020-2029 (USD MILLION)
TABLE 19 NORTH AMERICA CRYPTOCURRENCY MINING MARKET, BY MINING ENTERPRISES, 2020-2029 (USD MILLION)
TABLE 20 NORTH AMERICA CRYPTOCURRENCY MINING MARKET, BY REVENUE SOURCE, 2020-2029 (USD MILLION)
TABLE 21 NORTH AMERICA CRYPTOCURRENCY MINING MARKET, BY MINING TYPE, 2020-2029 (USD MILLION)
TABLE 22 NORTH AMERICA CRYPTOCURRENCY MINING MARKET, BY HARDWARE, 2020-2029 (USD MILLION)
TABLE 23 U.S. CRYPTOCURRENCY MINING MARKET, BY MINING ENTERPRISES, 2020-2029 (USD MILLION)
TABLE 24 U.S. CRYPTOCURRENCY MINING MARKET, BY REVENUE SOURCE, 2020-2029 (USD MILLION)
TABLE 25 U.S. CRYPTOCURRENCY MINING MARKET, BY MINING TYPE, 2020-2029 (USD MILLION)
TABLE 26 U.S. CRYPTOCURRENCY MINING MARKET, BY HARDWARE, 2020-2029 (USD MILLION)
TABLE 27 CANADA CRYPTOCURRENCY MINING MARKET, BY MINING ENTERPRISES, 2020-2029 (USD MILLION)
TABLE 28 CANADA CRYPTOCURRENCY MINING MARKET, BY REVENUE SOURCE, 2020-2029 (USD MILLION)
TABLE 29 CANADA CRYPTOCURRENCY MINING MARKET, BY MINING TYPE, 2020-2029 (USD MILLION)
TABLE 30 CANADA CRYPTOCURRENCY MINING MARKET, BY HARDWARE, 2020-2029 (USD MILLION)
TABLE 31 MEXICO CRYPTOCURRENCY MINING MARKET, BY MINING ENTERPRISES, 2020-2029 (USD MILLION)
TABLE 32 MEXICO CRYPTOCURRENCY MINING MARKET, BY REVENUE SOURCE, 2020-2029 (USD MILLION)
TABLE 33 MEXICO CRYPTOCURRENCY MINING MARKET, BY MINING TYPE, 2020-2029 (USD MILLION)
TABLE 34 MEXICO CRYPTOCURRENCY MINING MARKET, BY HARDWARE, 2020-2029 (USD MILLION)
TABLE 35 EUROPE CRYPTOCURRENCY MINING MARKET, BY COUNTRY, 2020-2029 (USD MILLION)
TABLE 36 EUROPE CRYPTOCURRENCY MINING MARKET, BY MINING ENTERPRISES, 2020-2029 (USD MILLION)
TABLE 37 EUROPE CRYPTOCURRENCY MINING MARKET, BY REVENUE SOURCE, 2020-2029 (USD MILLION)
TABLE 38 EUROPE CRYPTOCURRENCY MINING MARKET, BY MINING TYPE, 2020-2029 (USD MILLION)
TABLE 39 EUROPE CRYPTOCURRENCY MINING MARKET, BY HARDWARE, 2020-2029 (USD MILLION)
TABLE 40 GERMANY CRYPTOCURRENCY MINING MARKET, BY MINING ENTERPRISES, 2020-2029 (USD MILLION)
TABLE 41 GERMANY CRYPTOCURRENCY MINING MARKET, BY REVENUE SOURCE, 2020-2029 (USD MILLION)
TABLE 42 GERMANY CRYPTOCURRENCY MINING MARKET, BY MINING TYPE, 2020-2029 (USD MILLION)
TABLE 43 GERMANY CRYPTOCURRENCY MINING MARKET, BY HARDWARE, 2020-2029 (USD MILLION)
TABLE 44 U.S. CRYPTOCURRENCY MINING MARKET, BY MINING ENTERPRISES, 2020-2029 (USD MILLION)
TABLE 45 U.K. CRYPTOCURRENCY MINING MARKET, BY REVENUE SOURCE, 2020-2029 (USD MILLION)
TABLE 46 U.K. CRYPTOCURRENCY MINING MARKET, BY MINING TYPE, 2020-2029 (USD MILLION)
TABLE 47 U.K. CRYPTOCURRENCY MINING MARKET, BY HARDWARE, 2020-2029 (USD MILLION)
TABLE 48 FRANCE CRYPTOCURRENCY MINING MARKET, BY MINING ENTERPRISES, 2020-2029 (USD MILLION)
TABLE 49 FRANCE CRYPTOCURRENCY MINING MARKET, BY REVENUE SOURCE, 2020-2029 (USD MILLION)
TABLE 50 FRANCE CRYPTOCURRENCY MINING MARKET, BY MINING TYPE, 2020-2029 (USD MILLION)
TABLE 51 FRANCE CRYPTOCURRENCY MINING MARKET, BY HARDWARE, 2020-2029 (USD MILLION)
TABLE 52 RUSSIA CRYPTOCURRENCY MINING MARKET, BY MINING ENTERPRISES, 2020-2029 (USD MILLION)
TABLE 53 RUSSIA CRYPTOCURRENCY MINING MARKET, BY REVENUE SOURCE, 2020-2029 (USD MILLION)
TABLE 54 RUSSIA CRYPTOCURRENCY MINING MARKET, BY MINING TYPE, 2020-2029 (USD MILLION)
TABLE 55 RUSSIA CRYPTOCURRENCY MINING MARKET, BY HARDWARE, 2020-2029 (USD MILLION)
TABLE 56 SWITZERLAND CRYPTOCURRENCY MINING MARKET, BY MINING ENTERPRISES, 2020-2029 (USD MILLION)
TABLE 57 SWITZERLAND CRYPTOCURRENCY MINING MARKET, BY REVENUE SOURCE, 2020-2029 (USD MILLION)
TABLE 58 SWITZERLAND CRYPTOCURRENCY MINING MARKET, BY MINING TYPE, 2020-2029 (USD MILLION)
TABLE 59 SWITZERLAND CRYPTOCURRENCY MINING MARKET, BY HARDWARE, 2020-2029 (USD MILLION)
TABLE 60 NETHERLANDS CRYPTOCURRENCY MINING MARKET, BY MINING ENTERPRISES, 2020-2029 (USD MILLION)
TABLE 61 NETHERLANDS CRYPTOCURRENCY MINING MARKET, BY REVENUE SOURCE, 2020-2029 (USD MILLION)
TABLE 62 NETHERLANDS CRYPTOCURRENCY MINING MARKET, BY MINING TYPE, 2020-2029 (USD MILLION)
TABLE 63 NETHERLANDS CRYPTOCURRENCY MINING MARKET, BY HARDWARE, 2020-2029 (USD MILLION)
TABLE 64 TURKEY CRYPTOCURRENCY MINING MARKET, BY MINING ENTERPRISES, 2020-2029 (USD MILLION)
TABLE 65 TURKEY CRYPTOCURRENCY MINING MARKET, BY REVENUE SOURCE, 2020-2029 (USD MILLION)
TABLE 66 TURKEY CRYPTOCURRENCY MINING MARKET, BY MINING TYPE, 2020-2029 (USD MILLION)
TABLE 67 TURKEY CRYPTOCURRENCY MINING MARKET, BY HARDWARE, 2020-2029 (USD MILLION)
TABLE 68 SPAIN CRYPTOCURRENCY MINING MARKET, BY MINING ENTERPRISES, 2020-2029 (USD MILLION)
TABLE 69 SPAIN CRYPTOCURRENCY MINING MARKET, BY REVENUE SOURCE, 2020-2029 (USD MILLION)
TABLE 70 SPAIN CRYPTOCURRENCY MINING MARKET, BY MINING TYPE, 2020-2029 (USD MILLION)
TABLE 71 SPAIN CRYPTOCURRENCY MINING MARKET, BY HARDWARE, 2020-2029 (USD MILLION)
TABLE 72 ITALY CRYPTOCURRENCY MINING MARKET, BY MINING ENTERPRISES, 2020-2029 (USD MILLION)
TABLE 73 ITALY CRYPTOCURRENCY MINING MARKET, BY REVENUE SOURCE, 2020-2029 (USD MILLION)
TABLE 74 ITALY CRYPTOCURRENCY MINING MARKET, BY MINING TYPE, 2020-2029 (USD MILLION)
TABLE 75 ITALY CRYPTOCURRENCY MINING MARKET, BY HARDWARE, 2020-2029 (USD MILLION)
TABLE 76 BELGIUM CRYPTOCURRENCY MINING MARKET, BY MINING ENTERPRISES, 2020-2029 (USD MILLION)
TABLE 77 BELGIUM CRYPTOCURRENCY MINING MARKET, BY REVENUE SOURCE, 2020-2029 (USD MILLION)
TABLE 78 BELGIUM CRYPTOCURRENCY MINING MARKET, BY MINING TYPE, 2020-2029 (USD MILLION)
TABLE 79 BELGIUM CRYPTOCURRENCY MINING MARKET, BY HARDWARE, 2020-2029 (USD MILLION)
TABLE 80 REST OF EUROPE CRYPTOCURRENCY MINING MARKET, BY MINING ENTERPRISES, 2020-2029 (USD MILLION)
TABLE 81 ASIA-PACIFIC CRYPTOCURRENCY MINING MARKET, BY COUNTRY, 2020-2029 (USD MILLION)
TABLE 82 ASIA-PACIFIC CRYPTOCURRENCY MINING MARKET, BY MINING ENTERPRISES, 2020-2029 (USD MILLION)
TABLE 83 ASIA-PACIFIC CRYPTOCURRENCY MINING MARKET, BY REVENUE SOURCE, 2020-2029 (USD MILLION)
TABLE 84 ASIA-PACIFIC CRYPTOCURRENCY MINING MARKET, BY MINING TYPE, 2020-2029 (USD MILLION)
TABLE 85 ASIA-PACIFIC CRYPTOCURRENCY MINING MARKET, BY HARDWARE, 2020-2029 (USD MILLION)
TABLE 86 CHINA CRYPTOCURRENCY MINING MARKET, BY MINING ENTERPRISES, 2020-2029 (USD MILLION)
TABLE 87 CHINA CRYPTOCURRENCY MINING MARKET, BY REVENUE SOURCE, 2020-2029 (USD MILLION)
TABLE 88 CHINA CRYPTOCURRENCY MINING MARKET, BY MINING TYPE, 2020-2029 (USD MILLION)
TABLE 89 CHINA CRYPTOCURRENCY MINING MARKET, BY HARDWARE, 2020-2029 (USD MILLION)
TABLE 90 AUSTRALIA CRYPTOCURRENCY MINING MARKET, BY MINING ENTERPRISES, 2020-2029 (USD MILLION)
TABLE 91 AUSTRALIA CRYPTOCURRENCY MINING MARKET, BY REVENUE SOURCE, 2020-2029 (USD MILLION)
TABLE 92 AUSTRALIA CRYPTOCURRENCY MINING MARKET, BY MINING TYPE, 2020-2029 (USD MILLION)
TABLE 93 AUSTRALIA CRYPTOCURRENCY MINING MARKET, BY HARDWARE, 2020-2029 (USD MILLION)
TABLE 94 JAPAN CRYPTOCURRENCY MINING MARKET, BY MINING ENTERPRISES, 2020-2029 (USD MILLION)
TABLE 95 JAPAN CRYPTOCURRENCY MINING MARKET, BY REVENUE SOURCE, 2020-2029 (USD MILLION)
TABLE 96 JAPAN CRYPTOCURRENCY MINING MARKET, BY MINING TYPE, 2020-2029 (USD MILLION)
TABLE 97 JAPAN CRYPTOCURRENCY MINING MARKET, BY HARDWARE, 2020-2029 (USD MILLION)
TABLE 98 SOUTH KOREA CRYPTOCURRENCY MINING MARKET, BY MINING ENTERPRISES, 2020-2029 (USD MILLION)
TABLE 99 SOUTH KOREA CRYPTOCURRENCY MINING MARKET, BY REVENUE SOURCE, 2020-2029 (USD MILLION)
TABLE 100 SOUTH KOREA CRYPTOCURRENCY MINING MARKET, BY MINING TYPE, 2020-2029 (USD MILLION)
TABLE 101 SOUTH KOREA CRYPTOCURRENCY MINING MARKET, BY HARDWARE, 2020-2029 (USD MILLION)
TABLE 102 SINGAPORE CRYPTOCURRENCY MINING MARKET, BY MINING ENTERPRISES, 2020-2029 (USD MILLION)
TABLE 103 SINGAPORE CRYPTOCURRENCY MINING MARKET, BY REVENUE SOURCE, 2020-2029 (USD MILLION)
TABLE 104 SINGAPORE CRYPTOCURRENCY MINING MARKET, BY MINING TYPE, 2020-2029 (USD MILLION)
TABLE 105 SINGAPORE CRYPTOCURRENCY MINING MARKET, BY HARDWARE, 2020-2029 (USD MILLION)
TABLE 106 INDIA CRYPTOCURRENCY MINING MARKET, BY MINING ENTERPRISES, 2020-2029 (USD MILLION)
TABLE 107 INDIA CRYPTOCURRENCY MINING MARKET, BY REVENUE SOURCE, 2020-2029 (USD MILLION)
TABLE 108 INDIA CRYPTOCURRENCY MINING MARKET, BY MINING TYPE, 2020-2029 (USD MILLION)
TABLE 109 INDIA CRYPTOCURRENCY MINING MARKET, BY HARDWARE, 2020-2029 (USD MILLION)
TABLE 110 THAILAND CRYPTOCURRENCY MINING MARKET, BY MINING ENTERPRISES, 2020-2029 (USD MILLION)
TABLE 111 THAILAND CRYPTOCURRENCY MINING MARKET, BY REVENUE SOURCE, 2020-2029 (USD MILLION)
TABLE 112 THAILAND CRYPTOCURRENCY MINING MARKET, BY MINING TYPE, 2020-2029 (USD MILLION)
TABLE 113 THAILAND CRYPTOCURRENCY MINING MARKET, BY HARDWARE, 2020-2029 (USD MILLION)
TABLE 114 MALAYSIA CRYPTOCURRENCY MINING MARKET, BY MINING ENTERPRISES, 2020-2029 (USD MILLION)
TABLE 115 MALAYSIA CRYPTOCURRENCY MINING MARKET, BY REVENUE SOURCE, 2020-2029 (USD MILLION)
TABLE 116 MALAYSIA CRYPTOCURRENCY MINING MARKET, BY MINING TYPE, 2020-2029 (USD MILLION)
TABLE 117 MALAYSIA CRYPTOCURRENCY MINING MARKET, BY HARDWARE, 2020-2029 (USD MILLION)
TABLE 118 PHILIPPINES CRYPTOCURRENCY MINING MARKET, BY MINING ENTERPRISES, 2020-2029 (USD MILLION)
TABLE 119 PHILIPPINES CRYPTOCURRENCY MINING MARKET, BY REVENUE SOURCE, 2020-2029 (USD MILLION)
TABLE 120 PHILIPPINES CRYPTOCURRENCY MINING MARKET, BY MINING TYPE, 2020-2029 (USD MILLION)
TABLE 121 PHILIPPINES CRYPTOCURRENCY MINING MARKET, BY HARDWARE, 2020-2029 (USD MILLION)
TABLE 122 INDONESIA CRYPTOCURRENCY MINING MARKET, BY MINING ENTERPRISES, 2020-2029 (USD MILLION)
TABLE 123 INDONESIA CRYPTOCURRENCY MINING MARKET, BY REVENUE SOURCE, 2020-2029 (USD MILLION)
TABLE 124 INDONESIA CRYPTOCURRENCY MINING MARKET, BY MINING TYPE, 2020-2029 (USD MILLION)
TABLE 125 INDONESIA CRYPTOCURRENCY MINING MARKET, BY HARDWARE, 2020-2029 (USD MILLION)
TABLE 126 REST OF ASIA-PACIFIC CRYPTOCURRENCY MINING MARKET, BY MINING ENTERPRISES, 2020-2029 (USD MILLION)
TABLE 127 MIDDLE EAST & AFRICA CRYPTOCURRENCY MINING MARKET, BY COUNTRY, 2020-2029 (USD MILLION)
TABLE 128 MIDDLE EAST AND AFRICA CRYPTOCURRENCY MINING MARKET, BY MINING ENTERPRISES , 2020-2029 (USD MILLION)
TABLE 129 MIDDLE EAST AND AFRICA CRYPTOCURRENCY MINING MARKET, BY REVENUE SOURCE, 2020-2029 (USD MILLION)
TABLE 130 MIDDLE EAST AND AFRICA CRYPTOCURRENCY MINING MARKET, BY MINING TYPE, 2020-2029 (USD MILLION)
TABLE 131 MIDDLE EAST AND AFRICA CRYPTOCURRENCY MINING MARKET, BY HARDWARE, 2020-2029 (USD MILLION)
TABLE 132 SAUDI ARABIA CRYPTOCURRENCY MINING MARKET, BY MINING ENTERPRISES, 2020-2029 (USD MILLION)
TABLE 133 SAUDI ARABIA CRYPTOCURRENCY MINING MARKET, BY REVENUE SOURCE, 2020-2029 (USD MILLION)
TABLE 134 SAUDI ARABIA CRYPTOCURRENCY MINING MARKET, BY MINING TYPE, 2020-2029 (USD MILLION)
TABLE 135 SAUDI ARABIA CRYPTOCURRENCY MINING MARKET, BY HARDWARE, 2020-2029 (USD MILLION)
TABLE 136 U.A.E. CRYPTOCURRENCY MINING MARKET, BY MINING ENTERPRISES, 2020-2029 (USD MILLION)
TABLE 137 U.A.E. CRYPTOCURRENCY MINING MARKET, BY REVENUE SOURCE, 2020-2029 (USD MILLION)
TABLE 138 U.A.E. CRYPTOCURRENCY MINING MARKET, BY MINING TYPE, 2020-2029 (USD MILLION)
TABLE 139 U.A.E. CRYPTOCURRENCY MINING MARKET, BY HARDWARE, 2020-2029 (USD MILLION)
TABLE 140 SOUTH AFRICA CRYPTOCURRENCY MINING MARKET, BY MINING ENTERPRISES, 2020-2029 (USD MILLION)
TABLE 141 SOUTH AFRICA CRYPTOCURRENCY MINING MARKET, BY REVENUE SOURCE, 2020-2029 (USD MILLION)
TABLE 142 SOUTH AFRICA CRYPTOCURRENCY MINING MARKET, BY MINING TYPE, 2020-2029 (USD MILLION)
TABLE 143 SOUTH AFRICA CRYPTOCURRENCY MINING MARKET, BY HARDWARE, 2020-2029 (USD MILLION)
TABLE 144 ISRAEL CRYPTOCURRENCY MINING MARKET, BY MINING ENTERPRISES, 2020-2029 (USD MILLION)
TABLE 145 ISRAEL CRYPTOCURRENCY MINING MARKET, BY REVENUE SOURCE, 2020-2029 (USD MILLION)
TABLE 146 ISRAEL CRYPTOCURRENCY MINING MARKET, BY MINING TYPE, 2020-2029 (USD MILLION)
TABLE 147 ISRAEL CRYPTOCURRENCY MINING MARKET, BY HARDWARE, 2020-2029 (USD MILLION)
TABLE 148 EGYPT CRYPTOCURRENCY MINING MARKET, BY MINING ENTERPRISES, 2020-2029 (USD MILLION)
TABLE 149 EGYPT CRYPTOCURRENCY MINING MARKET, BY REVENUE SOURCE, 2020-2029 (USD MILLION)
TABLE 150 EGYPT CRYPTOCURRENCY MINING MARKET, BY MINING TYPE, 2020-2029 (USD MILLION)
TABLE 151 EGYPT CRYPTOCURRENCY MINING MARKET, BY HARDWARE, 2020-2029 (USD MILLION)
TABLE 152 REST OF MIDDLE EAST AND AFRICA CRYPTOCURRENCY MINING MARKET, BY MINING ENTERPRISE, 2020-2029 (USD MILLION)
TABLE 153 SOUTH AMERICA CRYPTOCURRENCY MINING MARKET, BY COUNTRY, 2020-2029 (USD MILLION)
TABLE 154 SOUTH AMERICA CRYPTOCURRENCY MINING MARKET, BY MINING ENTERPRISES, 2020-2029 (USD MILLION)
TABLE 155 SOUTH AMERICA CRYPTOCURRENCY MINING MARKET, BY REVENUE SOURCE, 2020-2029 (USD MILLION)
TABLE 156 SOUTH AMERICA CRYPTOCURRENCY MINING MARKET, BY MINING TYPE, 2020-2029 (USD MILLION)
TABLE 157 SOUTH AMERICA CRYPTOCURRENCY MINING MARKET, BY HARDWARE, 2020-2029 (USD MILLION)
TABLE 158 BRAZIL CRYPTOCURRENCY MINING MARKET, BY MINING ENTERPRISES, 2020-2029 (USD MILLION)
TABLE 159 BRAZIL CRYPTOCURRENCY MINING MARKET, BY REVENUE SOURCE, 2020-2029 (USD MILLION)
TABLE 160 BRAZIL CRYPTOCURRENCY MINING MARKET, BY MINING TYPE, 2020-2029 (USD MILLION)
TABLE 161 BRAZIL CRYPTOCURRENCY MINING MARKET, BY HARDWARE, 2020-2029 (USD MILLION)
TABLE 162 ARGENTINA CRYPTOCURRENCY MINING MARKET, BY MINING ENTERPRISES, 2020-2029 (USD MILLION)
TABLE 163 ARGENTINA CRYPTOCURRENCY MINING MARKET, BY REVENUE SOURCE, 2020-2029 (USD MILLION)
TABLE 164 ARGENTINA CRYPTOCURRENCY MINING MARKET, BY MINING TYPE, 2020-2029 (USD MILLION)
TABLE 165 ARGENTINA CRYPTOCURRENCY MINING MARKET, BY HARDWARE, 2020-2029 (USD MILLION)
TABLE 166 REST OF SOUTH AMERICA CRYPTOCURRENCY MINING MARKET, BY MINING ENTERPRISES, 2020-2029 (USD MILLION)
List of Figure
FIGURE 1 GLOBAL CRYPTOCURRENCY MINING MARKET: SEGMENTATION
FIGURE 2 GLOBAL CRYPTOCURRENCY MINING MARKET: DATA TRIANGULATION
FIGURE 3 GLOBAL CRYPTOCURRENCY MINING MARKET: DROC ANALYSIS
FIGURE 4 GLOBAL CRYPTOCURRENCY MINING MARKET: GLOBAL VS REGIONAL MARKET ANALYSIS
FIGURE 5 GLOBAL CRYPTOCURRENCY MINING MARKET: COMPANY RESEARCH ANALYSIS
FIGURE 6 GLOBAL CRYPTOCURRENCY MINING MARKET: INTERVIEW DEMOGRAPHICS
FIGURE 7 GLOBAL CRYPTOCURRENCY MINING MARKET: DBMR MARKET POSITION GRID
FIGURE 8 GLOBAL CRYPTOCURRENCY MINING MARKET: VENDOR SHARE ANALYSIS
FIGURE 9 GLOBAL CRYPTOCURRENCY MINING MARKET: SEGMENTATION
FIGURE 10 RISE IN THE POPULARITY OF MINING POOLS IS EXPECTED TO DRIVE THE GLOBAL CRYPTOCURRENCY MINING MARKET IN THE FORECAST PERIOD OF 2022 TO 2029
FIGURE 11 MINING ENTERPRISE SEGMENT IS EXPECTED TO ACCOUNT FOR THE LARGEST SHARE OF THE GLOBAL CRYPTOCURRENCY MINING MARKET IN 2022 & 2029
FIGURE 12 ASIA-PACIFIC IS EXPECTED TO DOMINATE AND IS THE FASTEST-GROWING REGION IN THE GLOBAL CRYPTOCURRENCY MINING MARKET IN THE FORECAST PERIOD OF 2022 TO 2029
FIGURE 13 ASIA-PACIFIC IS THE FASTEST-GROWING MARKET FOR CRYPTOCURRENCY MINING MANUFACTURERS IN THE FORECAST PERIOD OF 2022 TO 2029
FIGURE 14 DRIVERS, RESTRAINTS, OPPORTUNITIES, AND CHALLENGES OF THE GLOBAL CRYPTOCURRENCY MINING MARKET
FIGURE 15 GLOBAL CRYPTOCURRENCY MINING MARKET: BY MINING ENTERPRISE, 2021
FIGURE 16 GLOBAL CRYPTOCURRENCY MINING MARKET: BY REVENUE SOURCE, 2021
FIGURE 17 GLOBAL CRYPTOCURRENCY MINING MARKET: BY MINING TYPE, 2021
FIGURE 18 GLOBAL CRYPTOCURRENCY MINING MARKET: BY HARDWARE, 2021
FIGURE 19 GLOBAL CRYPTOCURRENCY MINING MARKET: SNAPSHOT (2021)
FIGURE 20 GLOBAL CRYPTOCURRENCY MINING MARKET: BY REGION (2021)
FIGURE 21 GLOBAL CRYPTOCURRENCY MINING MARKET: BY REGION (2022 & 2029)
FIGURE 22 GLOBAL CRYPTOCURRENCY MINING MARKET: BY REGION (2021 & 2029)
FIGURE 23 GLOBAL CRYPTOCURRENCY MINING MARKET: BY MINING ENTERPRISES (2022-2029)
FIGURE 24 NORTH AMERICA CRYPTOCURRENCY MINING MARKET: SNAPSHOT (2021)
FIGURE 25 NORTH AMERICA CRYPTOCURRENCY MINING MARKET: BY COUNTRY (2021)
FIGURE 26 NORTH AMERICA CRYPTOCURRENCY MINING MARKET: BY COUNTRY (2022 & 2029)
FIGURE 27 NORTH AMERICA CRYPTOCURRENCY MINING MARKET: BY COUNTRY (2021 & 2029)
FIGURE 28 NORTH AMERICA CRYPTOCURRENCY MINING MARKET: BY MINING ENTERPRISES (2022-2029)
FIGURE 29 EUROPE CRYPTOCURRENCY MINING MARKET: SNAPSHOT (2021)
FIGURE 30 EUROPE CRYPTOCURRENCY MINING MARKET: BY COUNTRY (2021)
FIGURE 31 EUROPE CRYPTOCURRENCY MINING MARKET: BY COUNTRY (2022 & 2029)
FIGURE 32 EUROPE CRYPTOCURRENCY MINING MARKET: BY COUNTRY (2021 & 2029)
FIGURE 33 EUROPE CRYPTOCURRENCY MINING MARKET: BY MINING ENTERPRISES (2022-2029)
FIGURE 34 ASIA-PACIFIC CRYPTOCURRENCY MINING MARKET: SNAPSHOT (2021)
FIGURE 35 ASIA-PACIFIC CRYPTOCURRENCY MINING MARKET: BY COUNTRY (2021)
FIGURE 36 ASIA-PACIFIC CRYPTOCURRENCY MINING MARKET: BY COUNTRY (2022 & 2029)
FIGURE 37 ASIA-PACIFIC CRYPTOCURRENCY MINING MARKET: BY COUNTRY (2021 & 2029)
FIGURE 38 ASIA-PACIFIC CRYPTOCURRENCY MINING MARKET: BY MINING ENTERPRISES (2022-2029)
FIGURE 39 MIDDLE EAST & AFRICA CRYPTOCURRENCY MINING MARKET: SNAPSHOT (2021)
FIGURE 40 MIDDLE EAST & AFRICA CRYPTOCURRENCY MINING MARKET: BY COUNTRY (2021)
FIGURE 41 MIDDLE EAST & AFRICA CRYPTOCURRENCY MINING MARKET: BY COUNTRY (2022 & 2029)
FIGURE 42 MIDDLE EAST & AFRICA CRYPTOCURRENCY MINING MARKET: BY COUNTRY (2021 & 2029)
FIGURE 43 MIDDLE EAST & AFRICA CRYPTOCURRENCY MINING MARKET: BY MINING ENTERPRISES (2022-2029)
FIGURE 44 SOUTH AMERICA CRYPTOCURRENCY MINING MARKET: SNAPSHOT (2021)
FIGURE 45 SOUTH AMERICA CRYPTOCURRENCY MINING MARKET: BY COUNTRY (2021)
FIGURE 46 SOUTH AMERICA CRYPTOCURRENCY MINING MARKET: BY COUNTRY (2022 & 2029)
FIGURE 47 SOUTH AMERICA CRYPTOCURRENCY MINING MARKET: BY COUNTRY (2021 & 2029)
FIGURE 48 SOUTH AMERICA CRYPTOCURRENCY MINING MARKET: BY MINING ENTERPRISES (2022-2029)
FIGURE 49 GLOBAL CRYPTOCURRENCY MINING MARKET: COMPANY SHARE 2021 (%)
FIGURE 50 NORTH AMERICA CRYPTOCURRENCY MINING MARKET: COMPANY SHARE 2021 (%)
FIGURE 51 EUROPE CRYPTOCURRENCY MINING MARKET: COMPANY SHARE 2021 (%)
FIGURE 52 ASIA-PACIFIC CRYPTOCURRENCY MINING MARKET: COMPANY SHARE 2021 (%)

Global Cryptocurrency Mining Market, Supply Chain Analysis and Ecosystem Framework
To support market growth and help clients navigate the impact of geopolitical shifts, DBMR has integrated in-depth supply chain analysis into its Global Cryptocurrency Mining Market research reports. This addition empowers clients to respond effectively to global changes affecting their industries. The supply chain analysis section includes detailed insights such as Global Cryptocurrency Mining Market consumption and production by country, price trend analysis, the impact of tariffs and geopolitical developments, and import and export trends by country and HSN code. It also highlights major suppliers with data on production capacity and company profiles, as well as key importers and exporters. In addition to research, DBMR offers specialized supply chain consulting services backed by over a decade of experience, providing solutions like supplier discovery, supplier risk assessment, price trend analysis, impact evaluation of inflation and trade route changes, and comprehensive market trend analysis.
Research Methodology
Data collection and base year analysis are done using data collection modules with large sample sizes. The stage includes obtaining market information or related data through various sources and strategies. It includes examining and planning all the data acquired from the past in advance. It likewise envelops the examination of information inconsistencies seen across different information sources. The market data is analysed and estimated using market statistical and coherent models. Also, market share analysis and key trend analysis are the major success factors in the market report. To know more, please request an analyst call or drop down your inquiry.
The key research methodology used by DBMR research team is data triangulation which involves data mining, analysis of the impact of data variables on the market and primary (industry expert) validation. Data models include Vendor Positioning Grid, Market Time Line Analysis, Market Overview and Guide, Company Positioning Grid, Patent Analysis, Pricing Analysis, Company Market Share Analysis, Standards of Measurement, Global versus Regional and Vendor Share Analysis. To know more about the research methodology, drop in an inquiry to speak to our industry experts.
Customization Available
Data Bridge Market Research is a leader in advanced formative research. We take pride in servicing our existing and new customers with data and analysis that match and suits their goal. The report can be customized to include price trend analysis of target brands understanding the market for additional countries (ask for the list of countries), clinical trial results data, literature review, refurbished market and product base analysis. Market analysis of target competitors can be analyzed from technology-based analysis to market portfolio strategies. We can add as many competitors that you require data about in the format and data style you are looking for. Our team of analysts can also provide you data in crude raw excel files pivot tables (Fact book) or can assist you in creating presentations from the data sets available in the report.