Market Defintion
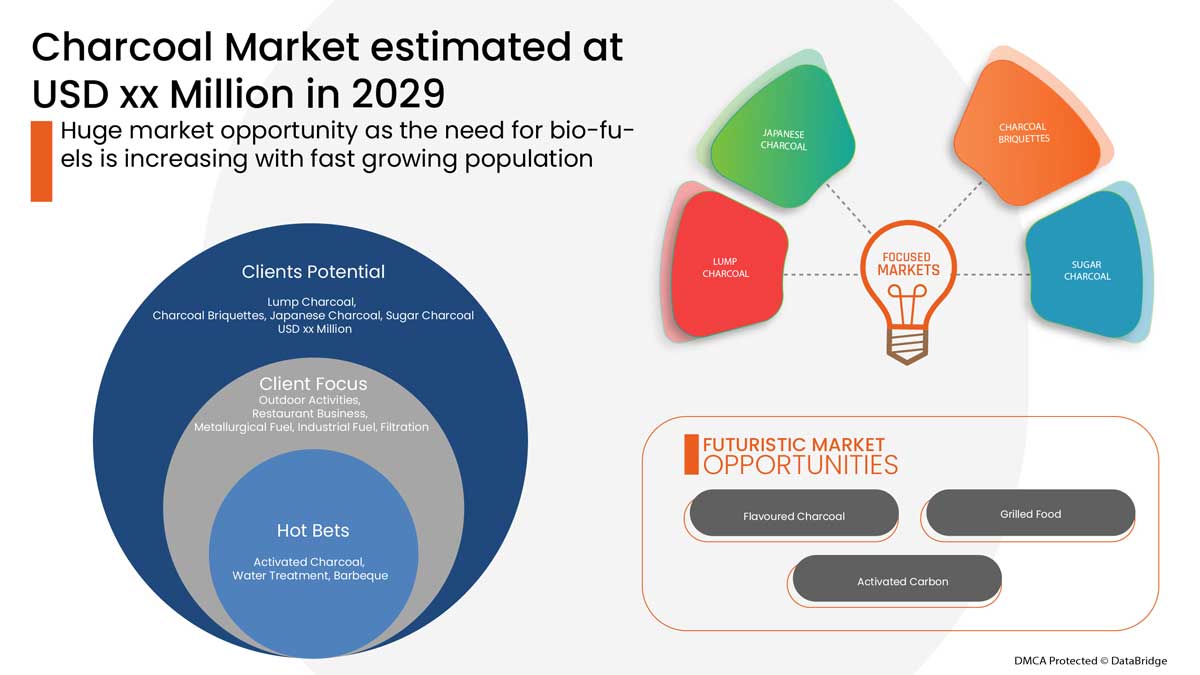
Charcoal is a manmade black carbon residue product that is produced the plant material such as wood. This process is carried out in the presence of oxygen to remove volatile and water constitutes Due to increased demand for the product in recreational cooking and metal manufacturing, building & construction, healthcare, industrial filtration, and pharmaceutical applications, the global charcoal market is estimated to develop significantly over the forecast period. In recreational cooking, charcoal can be used as a substitute for coal. In addition, the increased popularity of barbeque cooking in restaurants is likely to boost demand for charcoal.
Market Analysis and Size
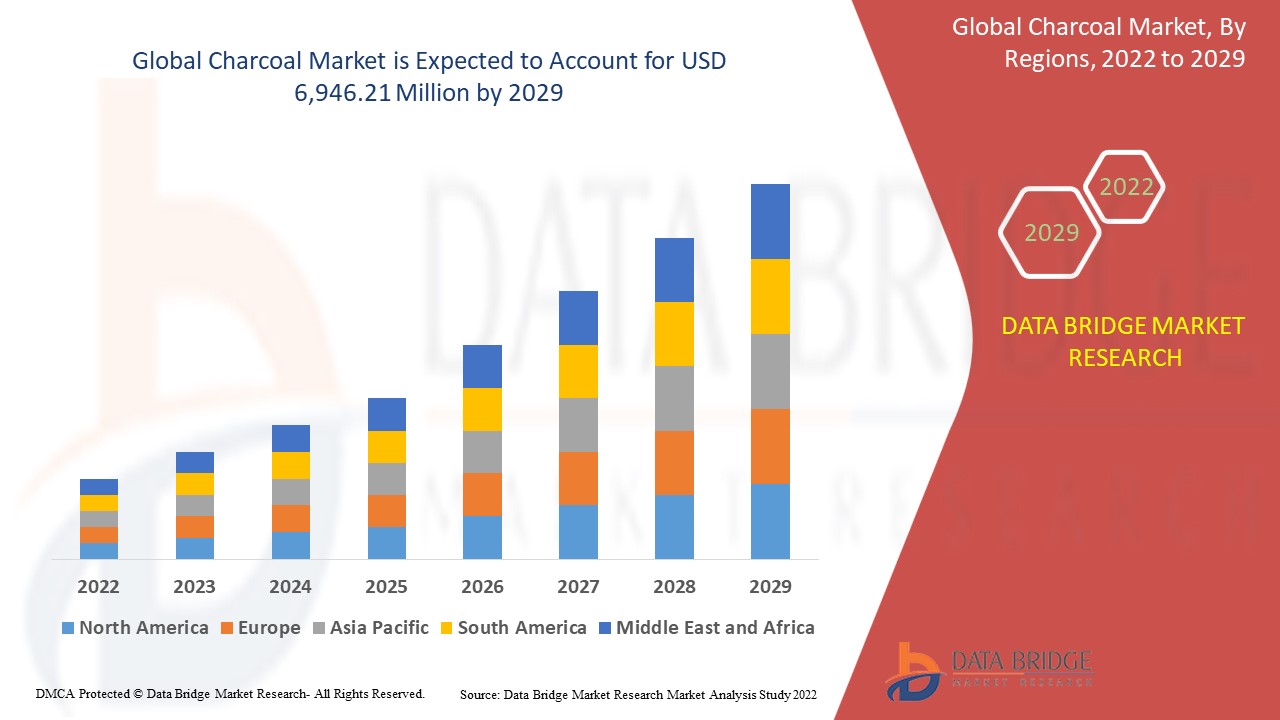
Data Bridge Market Research analyses that the charcoal market is expected to reach the value of USD 6,946.21 million by 2029, at a CAGR of 2.7% during the forecast period. The charcoal market report also covers pricing analysis, patent analysis, and technological advancements in depth.
|
Report Metric |
Details |
|
Forecast Period |
2022 to 2029 |
|
Base Year |
2021 |
|
Historic Years |
2020 |
|
Quantitative Units |
Revenue in USD Million, Pricing in USD |
|
Segments Covered |
By Product (Lump Charcoal, Charcoal Briquettes, Japanese Charcoal, Sugar Charcoal and Others), Application (Outdoor Activities, Restaurant Business, Metallurgical Fuel, Industrial Fuel, Filtration and Others) |
|
Countries Covered |
U.S., Canada and Mexico in North America, Germany, France, U.K., Netherlands, Switzerland, Belgium, Russia, Italy, Spain, Turkey, Rest of Europe in Europe, China, Japan, India, South Korea, Singapore, Malaysia, Australia, Thailand, Indonesia, Philippines, Hong Kong, Taiwan, Rest of Asia-Pacific (APAC) in the Asia-Pacific (APAC), Saudi Arabia, U.A.E, South Africa, Egypt, Israel, Rest of Middle East and Africa (MEA) as a part of Middle East and Africa (MEA), Brazil, Argentina and Rest of South America as part of South America. |
|
Market Players Covered |
Plantar, Rancher Charcoal, E & C Charcoal, Jumbo Charcoal (Pty) Ltd., Sagar Charcoal and Firewood Depot, Subur Tiasa Holdings Berhad, Etosha , The Clorox Company, Fire & Flavor, Timber Charcoal Company LLC, FogoCharcoal.com, NamCo Charcoal and Timber Products, Namchar, Mesjaya Sdn Bhd, Cook In Wood, maurobera.com, Royal Oak Enterprises, LLC., Duraflame, Inc. |
Charcoal Market Dynamics
This section deals with understanding the market drivers, advantages, opportunities, restraints and challenges. All of this is discussed in detail as below:
Drivers
- Increase in urbanization and rapid industrialization had created substantial demand for charcoal
The demand for charcoal is increasing mainly due to urban population in developing countries. More than half the global population now lives in cities, and urban-dwellers are restricted to charcoal use because of easiness of production, access, transport, and tradition. Urbanization have influenced the type of fuels used and also the total energy consumption for different functions which have further increased the demand for charcoal production across the region.
- Rise in consumption of barbequed food
In much of the world, barbecuing is practically very common activity in many regions especially in summer time. And while some people grill with gas and electricity, many people also prefers grilling with charcoal gives their food with a particularly smoky flavour. Furthermore, charcoal is mostly used for recreational barbecuing in places like North America and Europe, but it’s the primary cooking fuel in most African nations. In addition, it is reported that the market is majorly driven by the rising influence of grilled food worldwide and the growing adoption of grilled food among millennials. In addition, lockdown restrictions and the need to maintain social distancing due to the ongoing COVID-19 pandemic have resulted in more number of people staying at home. Thereby, an increasing number of people have been engaged in-home cooking and organizing small social events at home. This situation has resulted in an increasing demand for home cooking equipment and materials.
Opportunity
- Shift towards improved stove and higher efficiencies
Traditional stoves for heating and cooking at the household level are typically inefficient and generate considerable indoor air pollution, which can be deleterious to human health. Improved cook stoves have been deployed in many countries in attempts to improve cooking and heating efficiency and reduce indoor pollution in domestic households. Furthermore, charcoal can be burned cleanly and safely if prepared properly and used correctly in efficient appliances. Improved cook stoves are convex in shape and insulated on all sides. Because of their insulation, they require less charcoal to generate an equivalent amount of useful heat, and they retain heat for longer. Also, recently there is the introduction of improved cook stoves that can reduce GHG emissions by improving fuel efficiency and thereby reducing demand for charcoal for the same quantity of cooking energy.
Restraints/Challenges
- Stringent government regulation for charcoal production
A number of policies and standards have been initiated for charcoal production to ensure the quality and safe handling of the product. For instance, Canada Consumer Product Safety Act (S.C. 2010, c. 21) addresses the prevention to human health or safety that are posed by consumer products in Canada, including those that circulate within Canada and those that are imported.
- Inadequate baseline information for policy formulation related to charcoal
Population growth and the shift from fire-wood to charcoal were highlighted as the main driving factors for the growth of charcoal market. However, wood-fuel exploitation alone clearly does not provide a summary explanation for ongoing deforestation on a national scale. The problems related to wood fuel have increased due to unstructured baseline information related to various polices of charcoal production, which have further created demand and supply gap of charcoal across the region. Therefore, precise data on the charcoal value chain needs to be provided for an excellent entry-point for shaping proper policy frameworks. This will also offer an opportunity to the various stakeholders to add knowledge, innovation capital and technology at each step or link in the value chain of charcoal production. Hence, the inadequate baseline information for policy formulation is creating a major challenge for the market to grow.
Post COVID-19 Impact on Charcoal Market
COVID-19 created a major impact on the charcoal market as almost every country has opted for the shutdown for every production facility except the ones dealing in producing the essential goods.
The COVID-19 pandemic has impacted the charcoal market to an extent in negative manner. So, the market has resulted in a lower estimated year-on-year growth rate as compared with 2019 because of the fewer amounts of activities of the sectors associated with the charcoal market. However, the growth has been high after the market has opened after COVID-19, and it is expected that there would be considerable growth in the sector owing to higher demand of barbequed food. And this factor is further expected to drive the overall growth of the market.
Manufacturers are making various strategic decisions to bounce back post-COVID-19. The players are conducting multiple research and development activities to improve the technology involved in the charcoal. With this, the companies will bring advanced technologies to the market. In addition, government initiatives for usage of electric vehicle has led to the market's growth
Recent Development
- In March 2022, Kingsford Products Company, a subsidiary of The Clorox Company launched new product line of signature flavored charcoals and hardwood pellets. The main objective of this product launch is to improve the grilling experience with various flavor and aroma. This will improve the product portfolio of the company
Global Charcoal Market Scope
The charcoal market is segmented on the basis of product and application. The growth amongst these segments will help you analyze meagre growth segments in the industries and provide the users with a valuable market overview and market insights to help them make strategic decisions for identifying core market applications.
Product
- Lump Charcoal
- Charcoal Briquettes
- Japanese Charcoal
- Sugar Charcoal
- Others
On the basis of product, the global charcoal market is segmented into lump charcoal, charcoal briquettes, Japanese charcoal, sugar charcoal and others.
Application
- Outdoor Activities
- Restaurant Business
- Metallurgical Fuel
- Industrial Fuel
- Filtration
- Others
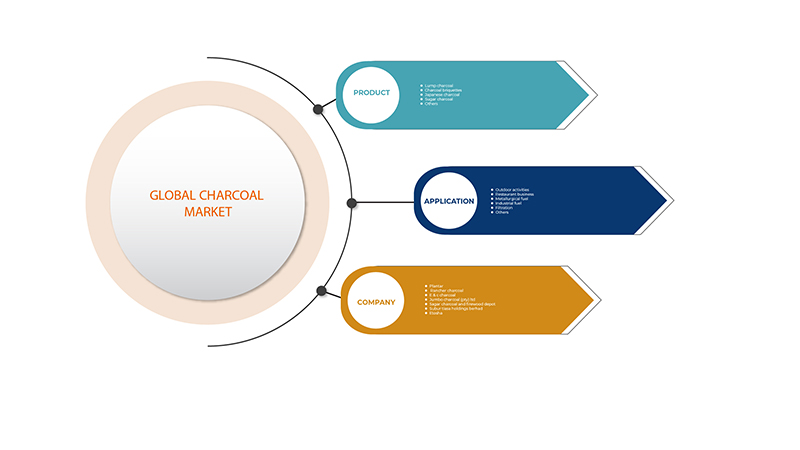
On the basis of application, the global charcoal market has been segmented into below outdoor activities, restaurant business, metallurgical fuel, industrial fuel, filtration and others.
Charcoal Market Regional Analysis/Insights
The charcoal market is analysed and market size insights and trends are provided by country, product and application as referenced above.
The countries covered in the charcoal market report are U.S., Canada and Mexico in North America, Germany, France, U.K., Netherlands, Switzerland, Belgium, Russia, Italy, Spain, Turkey, Rest of Europe in Europe, China, Japan, India, South Korea, Singapore, Malaysia, Australia, Thailand, Indonesia, Philippines, Hong Kong, Taiwan, Rest of Asia-Pacific (APAC) in the Asia-Pacific (APAC), Saudi Arabia, U.A.E, South Africa, Egypt, Israel, Rest of Middle East and Africa (MEA) as a part of Middle East and Africa (MEA), Brazil, Argentina and Rest of South America as part of South America.
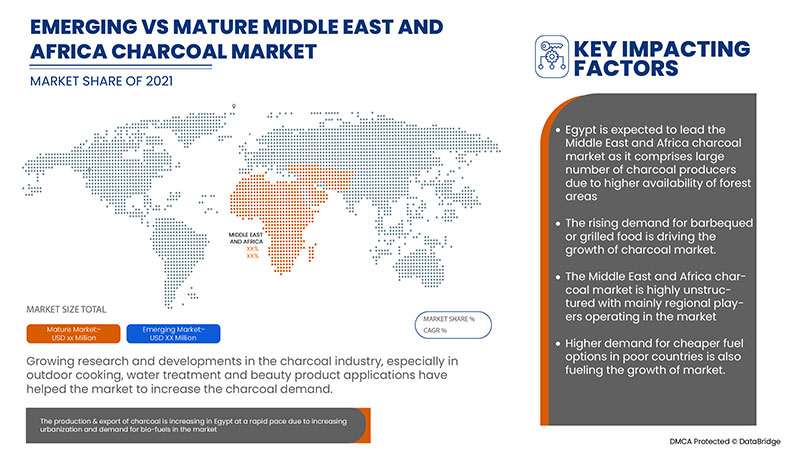
Middle East and Africa region dominates the charcoal market because it has demonstrated strong demand of industrial waste and water treatment using activated carbon.
Egypt dominates in the Middle East and Africa region owing to the massive demand for cheaper and efficient wood fuel in this country.
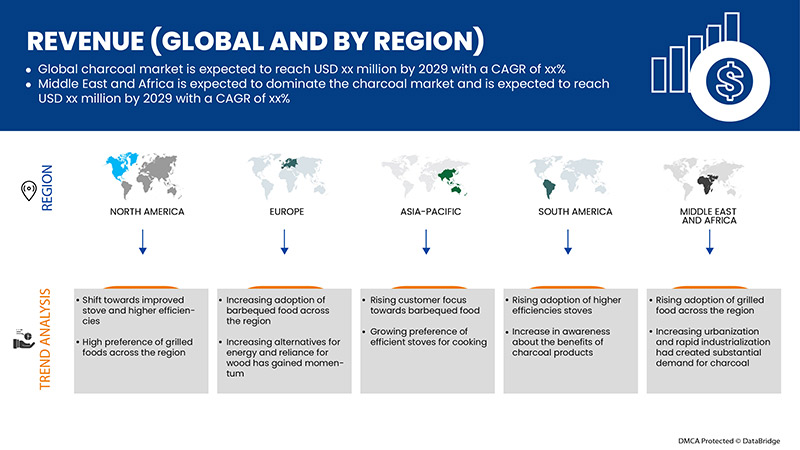
The country section of the report also provides individual market impacting factors and changes in market regulation that impact the current and future trends of the market. Data points like down-stream and upstream value chain analysis, technical trends and porter's five forces analysis, case studies are some of the pointers used to forecast the market scenario for individual countries. Also, the presence and availability of global brands and their challenges faced due to large or scarce competition from local and domestic brands, impact of domestic tariffs and trade routes are considered while providing forecast analysis of the country data.
Competitive Landscape and Charcoal Market Share Analysis
The charcoal market competitive landscape provides details by competitor. Details included are company overview, company financials, revenue generated, market potential, investment in research and development, new market initiatives, global presence, production sites and facilities, production capacities, company strengths and weaknesses, product launch, product width and breadth, application dominance. The above data points provided are only related to the companies' focus related to charcoal market.
Some of the major players operating in the charcoal market are Plantar, Rancher Charcoal, E & C Charcoal, Jumbo Charcoal (Pty) Ltd., Sagar Charcoal and Firewood Depot, Subur Tiasa Holdings Berhad, Etosha , The Clorox Company, Fire & Flavor, Timber Charcoal Company LLC, FogoCharcoal.com, NamCo Charcoal and Timber Products, Namchar , Mesjaya Sdn Bhd, Cook In Wood, maurobera.com, Royal Oak Enterprises, LLC., Duraflame, Inc.
SKU-
Get online access to the report on the World's First Market Intelligence Cloud
- Interactive Data Analysis Dashboard
- Company Analysis Dashboard for high growth potential opportunities
- Research Analyst Access for customization & queries
- Competitor Analysis with Interactive dashboard
- Latest News, Updates & Trend analysis
- Harness the Power of Benchmark Analysis for Comprehensive Competitor Tracking
Table of Content
1 INTRODUCTION
1.1 OBJECTIVES OF THE STUDY
1.2 MARKET DEFINITION
1.3 OVERVIEW OF GLOBAL CHARCOAL MARKET
1.4 CURRENCY AND PRICING
1.5 LIMITATIONS
1.6 MARKETS COVERED
2 MARKET SEGMENTATION
2.1 MARKETS COVERED
2.2 GEOGRAPHICAL SCOPE
2.3 YEARS CONSIDERED FOR THE STUDY
2.4 DBMR TRIPOD DATA VALIDATION MODEL
2.5 PRIMARY INTERVIEWS WITH KEY OPINION LEADERS
2.6 DBMR MARKET POSITION GRID
2.7 VENDOR SHARE ANALYSIS
2.8 MULTIVARIATE MODELING
2.9 PRODUCT TIMELINE CURVE
2.1 MARKET CHALLENGE MATRIX
2.11 SECONDARY SOURCES
2.12 ASSUMPTIONS
3 EXECUTIVE SUMMARY
4 PREMIUM INSIGHTS
4.1 PRODUCTION CONSUMPTION ANALYSIS
4.2 IMPORT-EXPORT SCENARIO
4.3 RAW MATERIAL PRODUCTION COVERAGE
4.4 TECHNOLOGICAL ADVANCEMENTS BY MANUFACTURERS
4.5 LIST OF KEY BUYERS BY REGION
4.5.1 NORTH AMERICA
4.5.2 EUROPE
4.5.3 ASIA-PACIFIC
4.5.4 SOUTH AMERICA
4.5.5 MIDDLE EAST AND AFRICA
4.6 PORTER'S FIVE FORCES
4.7 VENDOR SELECTION CRITERIA
4.8 PESTEL ANALYSIS
4.9 REGULATION COVERAGE
5 SUPPLY CHAIN ANALYSIS
5.1 OVERVIEW
5.2 LOGISTIC COST SCENARIO
5.3 IMPORTANCE OF LOGISTICS SERVICE PROVIDERS
6 CLIMATE CHANGE SCENARIO
6.1 ENVIRONMENTAL CONCERNS
6.2 INDUSTRY RESPONSE
6.3 GOVERNMENT'S ROLE
6.4 ANALYST RECOMMENDATION
7 MARKET OVERVIEW
7.1 DRIVERS
7.1.1 AN INCREASE IN URBANIZATION AND RAPID INDUSTRIALIZATION HAS CREATED SUBSTANTIAL DEMAND FOR CHARCOAL
7.1.2 RISE IN CONSUMPTION OF BARBEQUED FOOD
7.1.3 INCREASING ALTERNATIVES FOR ENERGY AND RELIANCE ON WOOD HAS GAINED MOMENTUM
7.1.4 GROWING DEMAND FOR INDUSTRIAL WASTE AND WATER TREATMENT USING ACTIVATED CARBON
7.2 RESTRAINTS
7.2.1 STRINGENT GOVERNMENT REGULATIONS FOR CHARCOAL PRODUCTION
7.2.2 HIGHER ENVIRONMENTAL IMPACTS OF CHARCOAL PRODUCTION IN TROPICAL ECOSYSTEM
7.3 OPPORTUNITIES
7.3.1 SHIFT TOWARDS IMPROVED STOVE AND HIGHER EFFICIENCIES
7.3.2 INCREASE IN SOURCE OF INCOME FOR RURAL DWELLERS WITH CHARCOAL PRODUCTION
7.3.3 HIGH PREFERENCE FOR GRILLED FOODS ACROSS THE REGION
7.4 CHALLENGES
7.4.1 INADEQUATE BASELINE INFORMATION FOR POLICY FORMULATION RELATED TO CHARCOAL
7.4.2 LACK OF AWARENESS OF THE ENVIRONMENTAL EFFECTS OF CHARCOAL PRODUCTION
8 IMPACT OF COVID-19 ON THE GLOBAL CHARCOAL MARKET
8.1 AFTERMATH AND GOVERNMENT INITIATIVES FOR THE CHARCOAL MARKET
8.2 STRATEGIC DECISIONS FOR MANUFACTURERS AFTER COVID-19 TO GAIN COMPETITIVE MARKET SHARE
8.3 IMPACT ON DEMAND AND PRICE
8.4 IMPACT ON SUPPLY CHAIN
8.5 CONCLUSION
9 GLOBAL CHARCOAL MARKET, BY PRODUCT
9.1 OVERVIEW
9.2 LUMP CHARCOAL
9.3 CHARCOAL BRIQUETTES
9.4 JAPANESE CHARCOAL
9.5 SUGAR CHARCOAL
9.6 OTHERS
10 GLOBAL CHARCOAL MARKET, BY APPLICATION
10.1 OVERVIEW
10.2 OUTDOOR ACTIVITIES
10.3 RESTAURANT BUSINESS
10.4 METALLURGICAL FUEL
10.5 INDUSTRIAL FUEL
10.6 FILTRATION
10.7 OTHERS
11 GLOBAL CHARCOAL MARKET, BY REGION
11.1 OVERVIEW
11.2 MIDDLE EAST & AFRICA
11.2.1 EGYPT
11.2.2 SOUTH AFRICA
11.2.3 SAUDI ARABIA
11.2.4 U.A.E.
11.2.5 ISRAEL
11.2.6 REST OF MIDDLE EAST & AFRICA
11.3 ASIA-PACIFIC
11.3.1 CHINA
11.3.2 INDIA
11.3.3 JAPAN
11.3.4 SOUTH KOREA
11.3.5 THAILAND
11.3.6 INDONESIA
11.3.7 AUSTRALIA
11.3.8 MALAYSIA
11.3.9 SINGAPORE
11.3.10 PHILIPPINES
11.3.11 HONG KONG
11.3.12 TAIWAN
11.3.13 REST OF ASIA-PACIFIC
11.4 SOUTH AMERICA
11.4.1 BRAZIL
11.4.2 ARGENTINA
11.4.3 REST OF SOUTH AMERICA
11.5 NORTH AMERICA
11.5.1 U.S.
11.5.2 CANADA
11.5.3 MEXICO
11.6 EUROPE
11.6.1 GERMANY
11.6.2 FRANCE
11.6.3 U.K.
11.6.4 ITALY
11.6.5 NETHERLANDS
11.6.6 SPAIN
11.6.7 RUSSIA
11.6.8 BELGIUM
11.6.9 SWITZERLAND
11.6.10 TURKEY
11.6.11 REST OF EUROPE
12 GLOBAL CHARCOAL MARKET: COMPANY LANDSCAPE
12.1 COMPANY SHARE ANALYSIS: GLOBAL
12.2 COMPANY SHARE ANALYSIS: ASIA-PACIFIC
12.3 COMPANY SHARE ANALYSIS: NORTH AMERICA
12.4 COMPANY SHARE ANALYSIS: EUROPE
13 SWOT ANALYSIS
14 COMPANY PROFILE
14.1 THE CLOROX COMPANY
14.1.1 COMPANY SNAPSHOT
14.1.2 REVENUE ANALYSIS
14.1.3 COMPANY SHARE ANALYSIS
14.1.4 PRODUCT PORTFOLIO
14.1.5 RECENT DEVELOPMENTS
14.2 ROYAL OAK ENTERPRISES, LLC.
14.2.1 COMPANY SNAPSHOT
14.2.2 COMPANY SHARE ANALYSIS
14.2.3 PRODUCT PORTFOLIO
14.2.4 RECENT DEVELOPMENT
14.3 DURAFLAME, INC.
14.3.1 COMPANY SNAPSHOT
14.3.2 COMPANY SHARE ANALYSIS
14.3.3 PRODUCT PORTFOLIO
14.3.4 RECENT DEVELOPMENT
14.4 SUBUR TIASA HOLDINGS BERHAD
14.4.1 COMPANY SNAPSHOT
14.4.2 REVENUE ANALYSIS
14.4.3 COMPANY SHARE ANALYSIS
14.4.4 PRODUCT PORTFOLIO
14.4.5 RECENT DEVELOPMENT
14.5 NAMCO CHARCOAL AND TIMBER PRODUCTS
14.5.1 COMPANY SNAPSHOT
14.5.2 COMPANY SHARE ANALYSIS
14.5.3 PRODUCT PORTFOLIO
14.5.4 RECENT DEVELOPMENT
14.6 COOK IN WOOD
14.6.1 COMPANY SNAPSHOT
14.6.2 PRODUCT PORTFOLIO
14.6.3 RECENT DEVELOPMENT
14.7 E&C CHARCOAL
14.7.1 COMPANY SNAPSHOT
14.7.2 PRODUCT PORTFOLIO
14.7.3 RECENT DEVELOPMENT
14.8 ETOSHA
14.8.1 COMPANY SNAPSHOT
14.8.2 PRODUCT PORTFOLIO
14.8.3 RECENT DEVELOPMENT
14.9 FIRE & FLAVOR
14.9.1 COMPANY SNAPSHOT
14.9.2 PRODUCT PORTFOLIO
14.9.3 RECENT DEVELOPMENT
14.1 FOGOCHARCOAL.COM
14.10.1 COMPANY SNAPSHOT
14.10.2 PRODUCT PORTFOLIO
14.10.3 RECENT DEVELOPMENT
14.11 JUMBO CHARCOAL (PTY) LTD.
14.11.1 COMPANY SNAPSHOT
14.11.2 PRODUCT PORTFOLIO
14.11.3 RECENT DEVELOPMENT
14.12 MAUROBERA.COM
14.12.1 COMPANY SNAPSHOT
14.12.2 PRODUCT PORTFOLIO
14.12.3 RECENT DEVELOPMENT
14.13 MESJAYA SDN BHD
14.13.1 COMPANY SNAPSHOT
14.13.2 PRODUCT PORTFOLIO
14.13.3 RECENT DEVELOPMENT
14.14 NAMCHAR
14.14.1 COMPANY SNAPSHOT
14.14.2 PRODUCT PORTFOLIO
14.14.3 RECENT DEVELOPMENT
14.15 RANCHER CHARCOAL
14.15.1 COMPANY SNPASHOT
14.15.2 PRODUCT PORTFOLIO
14.15.3 RECENT DEVELOPMENT
14.16 SAGAR CHARCOAL AND FIREWOOD DEPOT
14.16.1 COMPANY SNAPSHOT
14.16.2 PRODUCT PORTFOLIO
14.16.3 RECENT DEVELOPMENT
14.17 TIMBER CHARCOAL CO. LLC
14.17.1 COMPANY SNAPSHOT
14.17.2 PRODUCT PORTFOLIO
14.17.3 RECENT DEVELOPMENT
14.18 PLANTAR
14.18.1 COMPANY SNAPSHOT
14.18.2 SOLUTION PORTFOLIO
14.18.3 RECENT DEVELOPMENT
15 QUESTIONNAIRE
16 RELATED REPORTS
List of Table
TABLE 1 VALUES OF CERTAIN CHARCOAL CHARACTERISTICS PURSUANT TO THE EUROPEAN EN 1860-2 AND GERMAN DIN 51749 STANDARD
TABLE 2 CHARCOAL TRANSPORTATION COSTS WITH DISTANCE TRAVELED THROUGH DIFFERENT DISTRICTS OF THAILAND ARE BELOW:
TABLE 3 GLOBAL CHARCOAL MARKET, BY PRODUCT, 2020-2029 (USD MILLION)
TABLE 4 GLOBAL LUMP CHARCOAL IN CHARCOAL MARKET, BY REGION, 2020-2029 (USD MILLION)
TABLE 5 GLOBAL CHARCOAL BRIQUETTES IN CHARCOAL MARKET, BY REGION, 2020-2029 (USD MILLION)
TABLE 6 GLOBAL JAPANESE CHARCOAL IN CHARCOAL MARKET, BY REGION, 2020-2029 (USD MILLION)
TABLE 7 GLOBAL SUGAR CHARCOAL IN CHARCOAL MARKET, BY REGION, 2020-2029 (USD MILLION)
TABLE 8 GLOBAL OTHERS IN CHARCOAL MARKET, BY REGION, 2020-2029 (USD MILLION)
TABLE 9 GLOBAL CHARCOAL MARKET, BY APPLICATION, 2020-2029 (USD MILLION)
TABLE 10 GLOBAL OUTDOOR ACTIVITIES IN CHARCOAL MARKET, BY REGION, 2020-2029 (USD MILLION)
TABLE 11 GLOBAL RESTAURANT BUSINESS IN CHARCOAL MARKET, BY REGION, 2020-2029 (USD MILLION)
TABLE 12 GLOBAL METALLURGICAL FUEL IN CHARCOAL MARKET, BY REGION, 2020-2029 (USD MILLION)
TABLE 13 GLOBAL INDUSTRIAL FUEL IN CHARCOAL MARKET, BY REGION, 2020-2029 (USD MILLION
TABLE 14 GLOBAL FILTRATION IN CHARCOAL MARKET, BY REGION, 2020-2029 (USD MILLION)
TABLE 15 GLOBAL OTHERS IN CHARCOAL MARKET, BY REGION, 2020-2029 (USD MILLION)
TABLE 17 MIDDLE EAST & AFRICA CHARCOAL MARKET, BY COUNTRY, 2020-2029 (USD MILLION)
TABLE 18 MIDDLE EAST & AFRICA CHARCOAL MARKET, BY PRODUCT, 2020-2029 (USD MILLION)
TABLE 19 MIDDLE EAST & AFRICA CHARCOAL MARKET, BY APPLICATION, 2020-2029 (USD MILLION)
TABLE 20 EGYPT CHARCOAL MARKET, BY PRODUCT, 2020-2029 (USD MILLION)
TABLE 21 EGYPT CHARCOAL MARKET, BY APPLICATION, 2020-2029 (USD MILLION)
TABLE 22 SOUTH AFRICA CHARCOAL MARKET, BY PRODUCT, 2020-2029 (USD MILLION)
TABLE 23 SOUTH AFRICA CHARCOAL MARKET, BY APPLICATION, 2020-2029 (USD MILLION)
TABLE 24 SAUDI ARABIA CHARCOAL MARKET, BY PRODUCT, 2020-2029 (USD MILLION)
TABLE 25 SAUDI ARABIA CHARCOAL MARKET, BY APPLICATION, 2020-2029 (USD MILLION)
TABLE 26 U.A.E. CHARCOAL MARKET, BY PRODUCT, 2020-2029 (USD MILLION)
TABLE 27 U.A.E. CHARCOAL MARKET, BY APPLICATION, 2020-2029 (USD MILLION)
TABLE 28 ISRAEL CHARCOAL MARKET, BY PRODUCT, 2020-2029 (USD MILLION)
TABLE 29 ISRAEL CHARCOAL MARKET, BY APPLICATION, 2020-2029 (USD MILLION)
TABLE 30 REST OF MIDDLE EAST & AFRICA CHARCOAL MARKET, BY PRODUCT, 2020-2029 (USD MILLION)
TABLE 31 ASIA-PACIFIC CHARCOAL MARKET, BY COUNTRY, 2020-2029 (USD MILLION)
TABLE 32 ASIA-PACIFIC CHARCOAL MARKET, BY PRODUCT, 2020-2029 (USD MILLION)
TABLE 33 ASIA-PACIFIC CHARCOAL MARKET, BY APPLICATION, 2020-2029 (USD MILLION)
TABLE 34 CHINA CHARCOAL MARKET, BY PRODUCT, 2020-2029 (USD MILLION)
TABLE 35 CHINA CHARCOAL MARKET, BY APPLICATION, 2020-2029 (USD MILLION)
TABLE 36 INDIA CHARCOAL MARKET, BY PRODUCT, 2020-2029 (USD MILLION)
TABLE 37 INDIA CHARCOAL MARKET, BY APPLICATION, 2020-2029 (USD MILLION)
TABLE 38 JAPAN CHARCOAL MARKET, BY PRODUCT, 2020-2029 (USD MILLION)
TABLE 39 JAPAN CHARCOAL MARKET, BY APPLICATION, 2020-2029 (USD MILLION)
TABLE 40 SOUTH KOREA CHARCOAL MARKET, BY PRODUCT, 2020-2029 (USD MILLION)
TABLE 41 SOUTH KOREA CHARCOAL MARKET, BY APPLICATION, 2020-2029 (USD MILLION)
TABLE 42 THAILAND CHARCOAL MARKET, BY PRODUCT, 2020-2029 (USD MILLION)
TABLE 43 THAILAND CHARCOAL MARKET, BY APPLICATION, 2020-2029 (USD MILLION)
TABLE 44 INDONESIA CHARCOAL MARKET, BY PRODUCT, 2020-2029 (USD MILLION)
TABLE 45 INDONESIA CHARCOAL MARKET, BY APPLICATION, 2020-2029 (USD MILLION)
TABLE 46 AUSTRALIA CHARCOAL MARKET, BY PRODUCT, 2020-2029 (USD MILLION)
TABLE 47 AUSTRALIA CHARCOAL MARKET, BY APPLICATION, 2020-2029 (USD MILLION)
TABLE 48 MALAYSIA CHARCOAL MARKET, BY PRODUCT, 2020-2029 (USD MILLION)
TABLE 49 MALAYSIA CHARCOAL MARKET, BY APPLICATION, 2020-2029 (USD MILLION)
TABLE 50 SINGAPORE CHARCOAL MARKET, BY PRODUCT, 2020-2029 (USD MILLION)
TABLE 51 SINGAPORE CHARCOAL MARKET, BY APPLICATION, 2020-2029 (USD MILLION)
TABLE 52 PHILIPPINES CHARCOAL MARKET, BY PRODUCT, 2020-2029 (USD MILLION)
TABLE 53 PHILIPPINES CHARCOAL MARKET, BY APPLICATION, 2020-2029 (USD MILLION)
TABLE 54 HONG KONG CHARCOAL MARKET, BY PRODUCT, 2020-2029 (USD MILLION)
TABLE 55 HONG KONG CHARCOAL MARKET, BY APPLICATION, 2020-2029 (USD MILLION)
TABLE 56 TAIWAN CHARCOAL MARKET, BY PRODUCT, 2020-2029 (USD MILLION)
TABLE 57 TAIWAN CHARCOAL MARKET, BY APPLICATION, 2020-2029 (USD MILLION)
TABLE 58 REST OF ASIA-PACIFIC CHARCOAL MARKET, BY PRODUCT, 2020-2029 (USD MILLION)
TABLE 59 SOUTH AMERICA CHARCOAL MARKET, BY COUNTRY, 2020-2029 (USD MILLION)
TABLE 60 SOUTH AMERICA CHARCOAL MARKET, BY PRODUCT, 2020-2029 (USD MILLION)
TABLE 61 SOUTH AMERICA CHARCOAL MARKET, BY APPLICATION, 2020-2029 (USD MILLION)
TABLE 62 BRAZIL CHARCOAL MARKET, BY PRODUCT, 2020-2029 (USD MILLION)
TABLE 63 BRAZIL CHARCOAL MARKET, BY APPLICATION, 2020-2029 (USD MILLION)
TABLE 64 ARGENTINA CHARCOAL MARKET, BY PRODUCT, 2020-2029 (USD MILLION)
TABLE 65 ARGENTINA CHARCOAL MARKET, BY APPLICATION, 2020-2029 (USD MILLION)
TABLE 66 REST OF SOUTH AMERICA CHARCOAL MARKET, BY PRODUCT, 2020-2029 (USD MILLION)
TABLE 67 NORTH AMERICA CHARCOAL MARKET, BY COUNTRY, 2020-2029 (USD MILLION)
TABLE 68 NORTH AMERICA CHARCOAL MARKET, BY PRODUCT, 2020-2029 (USD MILLION)
TABLE 69 NORTH AMERICA CHARCOAL MARKET, BY APPLICATION, 2020-2029 (USD MILLION)
TABLE 70 U.S. CHARCOAL MARKET, BY PRODUCT, 2020-2029 (USD MILLION)
TABLE 71 U.S. CHARCOAL MARKET, BY APPLICATION, 2020-2029 (USD MILLION)
TABLE 72 CANADA CHARCOAL MARKET, BY PRODUCT, 2020-2029 (USD MILLION)
TABLE 73 CANADA CHARCOAL MARKET, BY APPLICATION, 2020-2029 (USD MILLION)
TABLE 74 MEXICO CHARCOAL MARKET, BY PRODUCT, 2020-2029 (USD MILLION)
TABLE 75 MEXICO CHARCOAL MARKET, BY APPLICATION, 2020-2029 (USD MILLION)
TABLE 76 EUROPE CHARCOAL MARKET, BY COUNTRY, 2020-2029 (USD MILLION)
TABLE 77 EUROPE CHARCOAL MARKET, BY PRODUCT, 2020-2029 (USD MILLION)
TABLE 78 EUROPE CHARCOAL MARKET, BY APPLICATION, 2020-2029 (USD MILLION)
TABLE 79 GERMANY CHARCOAL MARKET, BY PRODUCT, 2020-2029 (USD MILLION)
TABLE 80 GERMANY CHARCOAL MARKET, BY APPLICATION, 2020-2029 (USD MILLION)
TABLE 81 FRANCE CHARCOAL MARKET, BY PRODUCT, 2020-2029 (USD MILLION)
TABLE 82 FRANCE CHARCOAL MARKET, BY APPLICATION, 2020-2029 (USD MILLION)
TABLE 83 U.K. CHARCOAL MARKET, BY PRODUCT, 2020-2029 (USD MILLION)
TABLE 84 U.K. CHARCOAL MARKET, BY APPLICATION, 2020-2029 (USD MILLION)
TABLE 85 ITALY CHARCOAL MARKET, BY PRODUCT, 2020-2029 (USD MILLION)
TABLE 86 ITALY CHARCOAL MARKET, BY APPLICATION, 2020-2029 (USD MILLION)
TABLE 87 NETHERLANDS CHARCOAL MARKET, BY PRODUCT, 2020-2029 (USD MILLION)
TABLE 88 NETHERLANDS CHARCOAL MARKET, BY APPLICATION, 2020-2029 (USD MILLION)
TABLE 89 SPAIN CHARCOAL MARKET, BY PRODUCT, 2020-2029 (USD MILLION)
TABLE 90 SPAIN CHARCOAL MARKET, BY APPLICATION, 2020-2029 (USD MILLION)
TABLE 91 RUSSIA CHARCOAL MARKET, BY PRODUCT, 2020-2029 (USD MILLION)
TABLE 92 RUSSIA CHARCOAL MARKET, BY APPLICATION, 2020-2029 (USD MILLION)
TABLE 93 BELGIUM CHARCOAL MARKET, BY PRODUCT, 2020-2029 (USD MILLION)
TABLE 94 BELGIUM CHARCOAL MARKET, BY APPLICATION, 2020-2029 (USD MILLION)
TABLE 95 SWITZERLAND CHARCOAL MARKET, BY PRODUCT, 2020-2029 (USD MILLION)
TABLE 96 SWITZERLAND CHARCOAL MARKET, BY APPLICATION, 2020-2029 (USD MILLION)
TABLE 97 TURKEY CHARCOAL MARKET, BY PRODUCT, 2020-2029 (USD MILLION)
TABLE 98 TURKEY CHARCOAL MARKET, BY APPLICATION, 2020-2029 (USD MILLION)
TABLE 99 REST OF EUROPE CHARCOAL MARKET, BY PRODUCT, 2020-2029 (USD MILLION)
List of Figure
FIGURE 1 GLOBAL CHARCOAL MARKET: SEGMENTATION
FIGURE 2 GLOBAL CHARCOAL MARKET: DATA TRIANGULATION
FIGURE 3 GLOBAL CHARCOAL MARKET: DROC ANALYSIS
FIGURE 4 GLOBAL CHARCOAL MARKET: GLOBAL VS REGIONAL MARKET ANALYSIS
FIGURE 5 GLOBAL CHARCOAL MARKET: COMPANY RESEARCH ANALYSIS
FIGURE 6 GLOBAL CHARCOAL MARKET: INTERVIEW DEMOGRAPHICS
FIGURE 7 GLOBAL CHARCOAL MARKET: DBMR MARKET POSITION GRID
FIGURE 8 GLOBAL CHARCOAL MARKET: VENDOR SHARE ANALYSIS
FIGURE 9 GLOBAL CHARCOAL MARKET: SEGMENTATION
FIGURE 10 RISING CONSUMPTION OF BARBEQUED FOOD IS EXPECTED TO DRIVE THE GLOBAL CHARCOAL MARKET IN THE FORECAST PERIOD OF 2022 TO 2029
FIGURE 11 LUMP CHARCOAL SEGMENT IS EXPECTED TO ACCOUNT FOR THE LARGEST SHARE OF GLOBAL CHARCOAL MARKET IN 2022 & 2029
FIGURE 12 MIDDLE EAST & AFRICA IS EXPECTED TO DOMINATE AND IS THE FASTEST GROWING REGION IN THE GLOBAL CHARCOAL MARKET IN THE FORECAST PERIOD OF 2022 TO 2029
FIGURE 13 MIDDLE EAST & AFRICA IS THE FASTEST GROWING MARKET FOR CHARCOAL MANUFACTURERS IN THE FORECAST PERIOD OF 2022 TO 2029
FIGURE 14 WOOD CHARCOAL PRODUCTION QUANTITY SHARE BY REGION (2020)
FIGURE 15 TOP IMPORTERS OF WOOD CHARCOAL 2020
FIGURE 16 TOP EXPORTERS OF WOOD CHARCOAL 2020
FIGURE 17 DRIVERS, RESTRAINTS, OPPORTUNITIES & CHALLENGES OF GLOBAL CHARCOAL MARKET
FIGURE 18 AVERAGE WOOD CHARCOAL PRODUCTION QUANTITY SHARE BY REGION (2019-2020)
FIGURE 19 GLOBAL CHARCOAL MARKET: BY PRODUCT, 2021
FIGURE 20 GLOBAL CHARCOAL MARKET: BY APPLICATION, 2021
FIGURE 21 GLOBAL CHARCOAL MARKET: SNAPSHOT (2021)
FIGURE 22 GLOBAL CHARCOAL MARKET: BY REGION (2021)
FIGURE 23 GLOBAL CHARCOAL MARKET: BY REGION (2022 & 2029)
FIGURE 24 GLOBAL CHARCOAL MARKET: BY REGION (2021 & 2029)
FIGURE 25 GLOBAL CHARCOAL MARKET: BY PRODUCT (2022-2029)
FIGURE 26 MIDDLE EAST & AFRICA CHARCOAL MARKET: SNAPSHOT (2021)
FIGURE 27 MIDDLE EAST & AFRICA CHARCOAL MARKET: BY COUNTRY (2021)
FIGURE 28 MIDDLE EAST & AFRICA CHARCOAL MARKET: BY COUNTRY (2022 & 2029)
FIGURE 29 MIDDLE EAST & AFRICA CHARCOAL MARKET: BY COUNTRY (2021 & 2029)
FIGURE 30 MIDDLE EAST & AFRICA CHARCOAL MARKET: BY PRODUCT (2022-2029)
FIGURE 31 ASIA-PACIFIC CHARCOAL MARKET: SNAPSHOT (2021)
FIGURE 32 ASIA-PACIFIC CHARCOAL MARKET: BY COUNTRY (2021)
FIGURE 33 ASIA-PACIFIC CHARCOAL MARKET: BY COUNTRY (2022 & 2029)
FIGURE 34 ASIA-PACIFIC CHARCOAL MARKET: BY COUNTRY (2021 & 2029)
FIGURE 35 ASIA-PACIFIC CHARCOAL MARKET: BY PRODUCT (2022-2029)
FIGURE 36 SOUTH AMERICA CHARCOAL MARKET: SNAPSHOT (2021)
FIGURE 37 SOUTH AMERICA CHARCOAL MARKET: BY COUNTRY (2021)
FIGURE 38 SOUTH AMERICA CHARCOAL MARKET: BY COUNTRY (2022 & 2029)
FIGURE 39 SOUTH AMERICA CHARCOAL MARKET: BY COUNTRY (2021 & 2029)
FIGURE 40 SOUTH AMERICA CHARCOAL MARKET: BY PRODUCT (2022-2029)
FIGURE 41 NORTH AMERICA CHARCOAL MARKET: SNAPSHOT (2021)
FIGURE 42 NORTH AMERICA CHARCOAL MARKET: BY COUNTRY (2021)
FIGURE 43 NORTH AMERICA CHARCOAL MARKET: BY COUNTRY (2022 & 2029)
FIGURE 44 NORTH AMERICA CHARCOAL MARKET: BY COUNTRY (2021 & 2029)
FIGURE 45 NORTH AMERICA CHARCOAL MARKET: BY PRODUCT (2022-2029)
FIGURE 46 EUROPE CHARCOAL MARKET: SNAPSHOT (2021)
FIGURE 47 EUROPE CHARCOAL MARKET: BY COUNTRY (2021)
FIGURE 48 EUROPE CHARCOAL MARKET: BY COUNTRY (2022 & 2029)
FIGURE 49 EUROPE CHARCOAL MARKET: BY COUNTRY (2021 & 2029)
FIGURE 50 EUROPE CHARCOAL MARKET: BY PRODUCT (2022-2029)
FIGURE 51 GLOBAL CHARCOAL MARKET: COMPANY SHARE 2021 (%)
FIGURE 52 ASIA-PACIFIC CHARCOAL MARKET: COMPANY SHARE 2021 (%)
FIGURE 53 NORTH AMERICA CHARCOAL MARKET: COMPANY SHARE 2021 (%)
FIGURE 54 EUROPE CHARCOAL MARKET: COMPANY SHARE 2021 (%)

Global Charcoal Market, Supply Chain Analysis and Ecosystem Framework
To support market growth and help clients navigate the impact of geopolitical shifts, DBMR has integrated in-depth supply chain analysis into its Global Charcoal Market research reports. This addition empowers clients to respond effectively to global changes affecting their industries. The supply chain analysis section includes detailed insights such as Global Charcoal Market consumption and production by country, price trend analysis, the impact of tariffs and geopolitical developments, and import and export trends by country and HSN code. It also highlights major suppliers with data on production capacity and company profiles, as well as key importers and exporters. In addition to research, DBMR offers specialized supply chain consulting services backed by over a decade of experience, providing solutions like supplier discovery, supplier risk assessment, price trend analysis, impact evaluation of inflation and trade route changes, and comprehensive market trend analysis.
Research Methodology
Data collection and base year analysis are done using data collection modules with large sample sizes. The stage includes obtaining market information or related data through various sources and strategies. It includes examining and planning all the data acquired from the past in advance. It likewise envelops the examination of information inconsistencies seen across different information sources. The market data is analysed and estimated using market statistical and coherent models. Also, market share analysis and key trend analysis are the major success factors in the market report. To know more, please request an analyst call or drop down your inquiry.
The key research methodology used by DBMR research team is data triangulation which involves data mining, analysis of the impact of data variables on the market and primary (industry expert) validation. Data models include Vendor Positioning Grid, Market Time Line Analysis, Market Overview and Guide, Company Positioning Grid, Patent Analysis, Pricing Analysis, Company Market Share Analysis, Standards of Measurement, Global versus Regional and Vendor Share Analysis. To know more about the research methodology, drop in an inquiry to speak to our industry experts.
Customization Available
Data Bridge Market Research is a leader in advanced formative research. We take pride in servicing our existing and new customers with data and analysis that match and suits their goal. The report can be customized to include price trend analysis of target brands understanding the market for additional countries (ask for the list of countries), clinical trial results data, literature review, refurbished market and product base analysis. Market analysis of target competitors can be analyzed from technology-based analysis to market portfolio strategies. We can add as many competitors that you require data about in the format and data style you are looking for. Our team of analysts can also provide you data in crude raw excel files pivot tables (Fact book) or can assist you in creating presentations from the data sets available in the report.

