Global Automated Border Control Market
Market Size in USD Billion
CAGR :
% 
 USD
1.79 Billion
USD
7.01 Billion
2024
2032
USD
1.79 Billion
USD
7.01 Billion
2024
2032
| 2025 –2032 | |
| USD 1.79 Billion | |
| USD 7.01 Billion | |
| % | |
|
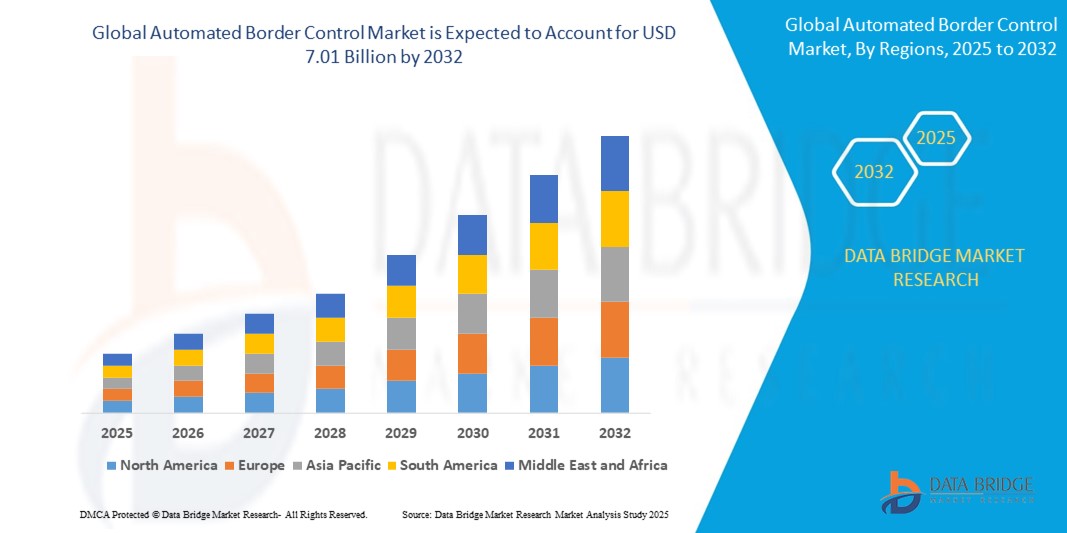
Automated Border Control Market Size
- The global automated border control market size was valued at USD 1.79 billion in 2024 and is expected to reach USD 7.01 billion by 2032, at a CAGR of 18.60% during the forecast period
- The market growth is largely fueled by the growing adoption and technological progress within connected home devices and smart home technology, leading to increased digitalization in both residential and commercial settings.
- Furthermore, rising consumer demand for secure, user-friendly, and integrated solutions for their homes and businesses is establishing automated border controls as the modern access control system of choice. These converging factors are accelerating the uptake of automated border control solutions, thereby significantly boosting the industry's growth
Automated Border Control Market Analysis
- Automated Border Controls, offering electronic or digital access control for doors and gates, are increasingly vital components of modern home security and automation systems in both residential and commercial settings due to their enhanced convenience, remote access capabilities, and seamless integration with smart home ecosystems
- The escalating demand for automated border controls is primarily fueled by the widespread adoption of smart home technologies, growing security concerns among consumers, and a rising preference for the convenience of keyless entry
- North America dominates the automated border control market with the largest revenue share in 2025, characterized by early smart home adoption, high disposable incomes, and a strong presence of key industry players, with the U.S. experiencing substantial growth in automated border control installations, particularly in new smart homes and multi-dwelling units, driven by innovations from both established tech companies and startups focusing on AI and voice-activated features
- Asia-Pacific is expected to be the fastest growing region in the automated border control market during the forecast period due to increasing urbanization and rising disposable incomes
- ABC E-gates segment is expected to dominate the global market in 2025. This is driven by the widespread adoption of e-gates at international airports worldwide to automate the identity verification process, thereby enhancing passenger flow and security. Their efficiency in processing large volumes of travelers makes them indispensable for modern air travel infrastructure globally
Report Scope and Automated Border Control Market Segmentation
|
Attributes |
Automated Border Control Key Market Insights |
|
Segments Covered |
|
|
Countries Covered |
North America
Europe
Asia-Pacific
Middle East and Africa
South America
|
|
Key Market Players |
|
|
Market Opportunities |
|
|
Value Added Data Infosets |
In addition to the insights on market scenarios such as market value, growth rate, segmentation, geographical coverage, and major players, the market reports curated by the Data Bridge Market Research also include in-depth expert analysis, pricing analysis, brand share analysis, consumer survey, demography analysis, supply chain analysis, value chain analysis, raw material/consumables overview, vendor selection criteria, PESTLE Analysis, Porter Analysis, and regulatory framework. |
Automated Border Control Market Trends
“Increasing Adoption of Contactless Technologies for Enhanced Health and Safety”
- A notable and growing trend in the global automated border control market is the heightened demand for contactless technologies. This shift is largely driven by increased awareness of health and hygiene, especially in high-traffic areas such as airports and border crossings
- For instance, many airports globally are now implementing touchless self-service kiosks for check-in and baggage drop, which could be extended to border control processes in the future. Companies such as Vision-Box are developing contactless biometric solutions for passenger identification to minimize physical interaction
- Contactless automated border control systems utilize technologies such as facial recognition, iris scans, and gesture-based interfaces, reducing the need for physical contact with surfaces. This addresses hygiene concerns but can also potentially expedite the passenger flow
- This trend extends to mobile-based solutions, where travelers can complete pre-arrival checks and utilize digital travel documents on their smartphones, further reducing physical interactions at border checkpoints. The International Air Transport Association (IATA) is actively promoting its travel pass app to facilitate contactless travel
- Consequently, companies are innovating to provide more hygienic and efficient border control solutions. For Instance, some manufacturers are incorporating antimicrobial coatings on the surfaces of automated gates and kiosks as an additional layer of safety
- The preference for contactless solutions is expected to continue growing as health and safety remain top priorities for travelers and authorities such as, influencing the design and deployment of future automated border control infrastructure
- The demand for automated border controls that offer seamless AI and voice control integration is growing rapidly across both residential and commercial sectors, as consumers increasingly prioritize convenience and comprehensive smart home functionality.
Automated Border Control Market Dynamics
Driver
“Growing Focus on Enhancing Passenger Experience and Efficiency”
- The increasing volume of international travelers necessitates more efficient border control processes to minimize wait times and improve overall passenger satisfaction, which is a significant driver for the adoption of automated border control solutions
- For instance, airports experiencing peak travel times often face long queues at immigration checkpoints. Implementing automated eGates can significantly reduce processing time per passenger. The deployment of such systems in major international airports such as London Heathrow and Dubai International showcases this drive for efficiency
- Automated systems can process passengers faster than manual checks by border agents, allowing for quicker throughput and reducing congestion. This is particularly crucial during peak travel seasons or events
- Furthermore, the integration of advanced data analytics and passenger profiling within automated border control systems enables authorities to focus resources on potentially higher-risk individuals while streamlining the process for the majority of travelers, thus enhancing efficiency. Programs such as the US Global Entry and the EU's Registered Traveller Scheme exemplify this approach
- The demand for a smoother and faster travel experience is constantly growing, pushing governments and airport authorities to invest in automated border control technologies that can deliver both enhanced security and improved passenger flow
Restraint/Challenge
“Complexity and High Costs of System Integration and Maintenance”
- A key challenge in the widespread adoption of automated border control systems is the complexity involved in integrating new technologies with existing infrastructure and the substantial costs associated with their implementation and ongoing maintenance
- The initial investment in procuring and installing automated border control gates, kiosks, and the associated IT infrastructure can be very high, requiring significant budgetary allocation from governments or airport authorities. A large-scale deployment in a major airport can cost millions of dollars
- Furthermore, these sophisticated systems require specialized personnel for maintenance and technical support. Regular software updates, hardware repairs, and system upgrades contribute to the ongoing operational costs. Ensuring the continuous functionality and security of these systems demands sustained financial and technical resources
- While the long-term benefits of efficiency and security are often compelling, the significant upfront investment and the complexities of integration and maintenance can be a major hurdle for some countries or smaller airports with limited budgets or technical expertise
Automated Border Control Market Scope
The market is segmented on the basis of type, component and application.
- By Type
On the basis of type, the global automated border control market includes ABC E-gates and ABC Kiosks. The ABC E-gates segment likely represents a substantial portion of the global market in 2025. This is driven by the widespread adoption of e-gates at international airports worldwide to automate the identity verification process, thereby enhancing passenger flow and security. Their efficiency in processing large volumes of travelers makes them indispensable for modern air travel infrastructure globally.
The ABC Kiosks segment is also experiencing significant global expansion. These kiosks offer travelers a self-service option to complete crucial pre-border clearance procedures, such as the scanning of passports and the verification of traveler data, before proceeding to immigration checkpoints. The deployment of kiosks across airports, landports, and seaports globally contributes to a more streamlined border control process, improving both efficiency and convenience for international travelers worldwide.
- By Component
On the basis of component, the global automated border control market is divided into Hardware, Software, and Services. The Hardware segment held the largest share of the global market revenue in 2025. This encompasses the essential physical infrastructure deployed for automated border checks, including ABC e-gates, self-service kiosks, advanced biometric scanners for identity verification, and document readers. The reliability and continuous technological advancements in these hardware components are fundamental to ensuring the effective operation and high security standards of ABC systems on a global scale.
The Software segment is projected to experience the most rapid growth rate globally from 2025 to 2032. This growth is fueled by the increasing sophistication of software algorithms used for accurate biometric matching, advanced data analytics employed for comprehensive risk assessment of travelers, and the seamless integration of ABC systems with extensive national and international border management databases. Cutting-edge software solutions are becoming increasingly critical for enhancing the overall accuracy, operational efficiency, and robust security of automated border control processes across the world.
- By Application
On the basis of application, the global automated border control market is segmented into Airport, Landport, and Seaport. The Airport segment likely accounted for the largest share of the global market revenue in 2024. This dominance is driven by the consistently high volume of international air travel worldwide and the paramount need for both efficient and highly secure passenger processing at airports globally. ABC systems have been widely adopted and implemented in airports across the world as a key strategy to expedite border checks for travelers while simultaneously strengthening overall security measures within air transportation hubs.
The Landport segment is expected to witness significant global growth, with a projected CAGR of 13.50% from 2025 to 2032. This expansion is driven by the increasing volume of cross-border travel via land routes and the growing recognition of the need for automated solutions to effectively manage the flow of individuals at international land borders. The strategic implementation of ABC systems at landports worldwide offers the potential to significantly improve operational efficiency, reduce waiting times for travelers, and enhance the overall level of security at these critical border crossing points for both travelers and border control authorities.
Automated Border Control Market Regional Analysis
- North America dominates the automated border control market with the largest revenue share in 2024, driven by a growing demand for home automation and security, coupled with increased awareness of smart home technology.
- Consumers in the region highly value the convenience, advanced security features, and seamless integration offered by automated border controls with other smart devices
- This adoption is supported by high disposable incomes and a technologically inclined population
U.S. Automated Border Control Market Insight
The U.S. automated border control market captured the largest revenue share within North America in 2025. This substantial share is fueled by the rapid uptake of interconnected devices and the expanding trend of complete home automation ecosystems. American consumers are increasingly prioritizing the enhancement of their home security through the implementation of intelligent, keyless entry systems that offer a blend of security and convenience. The growing preference for do-it-yourself smart home setups, combined with a robust demand for voice-controlled systems and seamless mobile application integration for remote access and management, further propels the Automated Border Control industry forward within the United States. Moreover, the increasing integration of smart home technology platforms, such as Amazon Alexa, Google Assistant, and Apple HomeKit, is significantly contributing to the market's continuous expansion by enhancing interoperability and user experience.
Europe Automated Border Control Market Insight
The European automated border control market is projected to expand at a substantial Compound Annual Growth Rate (CAGR) throughout the forecast period. This growth is primarily driven by stringent security regulations implemented across the European Union and the escalating need for enhanced security measures in both residential homes and commercial office spaces. The ongoing increase in urbanization across Europe, coupled with a rising demand for seamlessly connected devices that offer both security and convenience, is fostering the widespread adoption of Automated Border Control systems. European consumers are also increasingly drawn to the added convenience and potential energy efficiency benefits that these intelligent locking devices offer. The region is experiencing significant growth across various application sectors, including residential buildings, commercial establishments, and multi-family housing units, with Automated Border Controls being proactively incorporated into both new construction projects and existing building renovation initiatives aimed at modernizing security infrastructure.
U.K. Automated Border Control Market Insight
The U.K. automated border control market is anticipated to grow at a noteworthy CAGR during the forecast period. This growth is significantly driven by the escalating trend of comprehensive home automation adoption among consumers and a growing desire for heightened levels of security and overall convenience in managing property access. In addition, increasing concerns regarding the prevalence of burglary and the need for enhanced personal and property safety are strongly encouraging both individual homeowners and commercial businesses to choose advanced keyless entry solutions over traditional locking mechanisms . The United Kingdom's considerable embrace of connected smart devices, alongside its well-established e-commerce and retail infrastructure that facilitates easy access to these technologies, is expected to continue to significantly stimulate robust market growth within the country for the foreseeable future .
Germany Automated Border Control Market Insight
The German automated border control market is expected to expand at a considerable CAGR during the forecast period. This expansion is primarily fueled by an increasing level of public awareness regarding the importance of digital security in modern living and a strong consumer demand for technologically advanced and environmentally conscious (eco-conscious) security solutions . Germany’s well-developed technological infrastructure, combined with its national emphasis on innovation across industries and a growing societal focus on sustainability, collectively promotes the broader adoption of Automated Border Control systems, particularly within residential homes and commercial buildings. Furthermore, the seamless integration of Automated Border Controls with comprehensive home automation systems is also becoming increasingly prevalent among German consumers, who exhibit a strong preference for secure and privacy-focused technological solutions that align with local consumer expectations and stringent data protection standards.
Asia-Pacific Automated Border Control Market Insight
The Asia-Pacific automated border control market is poised to grow at the fastest CAGR in 2025. This rapid growth is primarily driven by accelerating urbanization trends across the region, a consistent rise in disposable incomes among the burgeoning middle class, and significant technological advancements being made in key countries such as China, Japan, and India. The region's increasing inclination towards the adoption of smart home technologies, which is further supported by various government initiatives aimed at promoting widespread digitalization across sectors, is a major factor driving the adoption of Automated Border Control systems. Furthermore, as the Asia-Pacific region increasingly emerges as a global manufacturing hub for Automated Border Control components and complete systems, the overall affordability and accessibility of these advanced security solutions are expanding to reach a much wider consumer base throughout the diverse and rapidly evolving markets within APAC .
Japan Automated Border Control Market Insight
The Japan automated border control market is steadily gaining momentum, primarily driven by the country’s deeply ingrained high-tech culture, the ongoing rapid pace of urbanization leading to denser living environments, and a strong consumer demand for enhanced convenience in daily life. The Japanese market places a particularly significant emphasis on security and reliability in all aspects of technology, and the increasing adoption of Automated Border Control systems is directly correlated with the rising number of smart homes and interconnected buildings being developed across the nation . The seamless integration of Automated Border Controls with a wide array of other Internet of Things (IoT) devices, such as sophisticated home security camera systems and intelligent lighting setups, is further fueling market growth. Moreover, Japan's aging population is also such asly to spur increased demand for easier-to-use yet highly secure access solutions in both residential homes and commercial establishments, catering to the specific needs of elderly individuals.
China Automated Border Control Market Insight
The China automated border control market accounted for the largest market revenue share within the Asia Pacific region in 2025. This dominant position can be primarily attributed to the country's rapidly expanding middle class, the continuous and extensive urbanization occurring across its vast landscape, and the remarkably high rates of technological adoption observed among its large consumer base. China stands out as one of the largest global markets for a wide range of smart home devices, and Automated Border Control systems are becoming increasingly popular in private residential properties and in various commercial buildings and rental accommodations . The strong government push towards the development of smart cities throughout China, coupled with the increasing availability of affordable Automated Border Control options offered by strong domestic manufacturers, are identified as key factors that are currently propelling the significant market growth being witnessed within the country.
Automated Border Control Market Share
The Automated Border Control industry is primarily led by well-established companies, including:
- secunet Security Networks AG (Germany)
- IER (France)
- Thales (Netherlands)
- IDEMIA (France)
- DERMALOG Identification Systems GmbH (Malaysia)
- SITA (Switzerland)
- Cognitec Systems GmbH (Germany)
- Securiport (U.S.)
- Veridos GmbH (Greece)
- CrossMatch (U.S.)
- HID Global Corporation (U.S.)
- NEC Corporation (Japan)
- Indra Sistemas (Spain)
- Accenture (Ireland)
- Gunnebo AB (Sweden)
- Vision-Box (Portugal)
- Collins Aerospace (U.S.)
- Aware, Inc. (U.S.)
- Vancouver Airport Authority (Canada)
- Atos SE (France)
Latest Developments in Global Automated Border Control Market
- In July 2022, the U.K. Home Secretary revealed plans to introduce contactless border checkpoints as part of a broader strategy to modernize the country’s border infrastructure. The Home Office announced its intention to pilot new technology in 2024 that would allow select travelers to enter the U.K. and complete automated border checks without using eGates or interacting with a Border Force official. This initiative marks a major step toward fully automated and seamless border crossings in the U.K.
- In June 2022, Bangladesh became the first South Asian country to implement electronic airport checkpoints, introducing e-gates at Hazrat Shahjalal International Airport for e-passport holders. These gates allow passengers to complete immigration procedures efficiently and with minimal manual intervention. This advancement signifies Bangladesh’s commitment to smart border solutions and efficient passenger processing
- In April 2022, Smiths Detection launched iCMORE Money, an advanced automated currency detection software designed to identify concealed money in carry-on luggage. The system can detect up to 100 banknotes, including Euro, U.S. Dollar, and Saudi Riyal, whether rolled or stacked in bags. This technology enhances security by improving the detection of illicit financial transfers at checkpoints
- In February 2021, Tallinn Airport and the Narva Road Border Crossing introduced an automated border control system aimed at streamlining border procedures. This implementation significantly improved operational efficiency at both the airport and the road border checkpoint. This adoption reflects Estonia’s ongoing efforts to modernize border management and improve traveler experience
- In January 2021, Idemia, in collaboration with Sopra Steria, signed a contract to deploy a biometric border control system in France. The solution is based on advanced biometric technologies and is intended to strengthen the security and efficiency of border operations across the country. This move underscores France’s investment in modern biometric systems to secure and automate border control
SKU-
Get online access to the report on the World's First Market Intelligence Cloud

- Interactive Data Analysis Dashboard
- Company Analysis Dashboard for high growth potential opportunities
- Research Analyst Access for customization & queries
- Competitor Analysis with Interactive dashboard
- Latest News, Updates & Trend analysis
- Harness the Power of Benchmark Analysis for Comprehensive Competitor Tracking
Global Automated Border Control Market, Supply Chain Analysis and Ecosystem Framework
To support market growth and help clients navigate the impact of geopolitical shifts, DBMR has integrated in-depth supply chain analysis into its Global Automated Border Control Market research reports. This addition empowers clients to respond effectively to global changes affecting their industries. The supply chain analysis section includes detailed insights such as Global Automated Border Control Market consumption and production by country, price trend analysis, the impact of tariffs and geopolitical developments, and import and export trends by country and HSN code. It also highlights major suppliers with data on production capacity and company profiles, as well as key importers and exporters. In addition to research, DBMR offers specialized supply chain consulting services backed by over a decade of experience, providing solutions like supplier discovery, supplier risk assessment, price trend analysis, impact evaluation of inflation and trade route changes, and comprehensive market trend analysis.
Research Methodology
Data collection and base year analysis are done using data collection modules with large sample sizes. The stage includes obtaining market information or related data through various sources and strategies. It includes examining and planning all the data acquired from the past in advance. It likewise envelops the examination of information inconsistencies seen across different information sources. The market data is analysed and estimated using market statistical and coherent models. Also, market share analysis and key trend analysis are the major success factors in the market report. To know more, please request an analyst call or drop down your inquiry.
The key research methodology used by DBMR research team is data triangulation which involves data mining, analysis of the impact of data variables on the market and primary (industry expert) validation. Data models include Vendor Positioning Grid, Market Time Line Analysis, Market Overview and Guide, Company Positioning Grid, Patent Analysis, Pricing Analysis, Company Market Share Analysis, Standards of Measurement, Global versus Regional and Vendor Share Analysis. To know more about the research methodology, drop in an inquiry to speak to our industry experts.
Customization Available
Data Bridge Market Research is a leader in advanced formative research. We take pride in servicing our existing and new customers with data and analysis that match and suits their goal. The report can be customized to include price trend analysis of target brands understanding the market for additional countries (ask for the list of countries), clinical trial results data, literature review, refurbished market and product base analysis. Market analysis of target competitors can be analyzed from technology-based analysis to market portfolio strategies. We can add as many competitors that you require data about in the format and data style you are looking for. Our team of analysts can also provide you data in crude raw excel files pivot tables (Fact book) or can assist you in creating presentations from the data sets available in the report.

