Europe And Us Rehabilitation Centers And Therapy Services Market
Market Size in USD Billion
CAGR :
% 
 USD
45.78 Billion
USD
65.60 Billion
2024
2032
USD
45.78 Billion
USD
65.60 Billion
2024
2032
| 2025 –2032 | |
| USD 45.78 Billion | |
| USD 65.60 Billion | |
| % | |
|
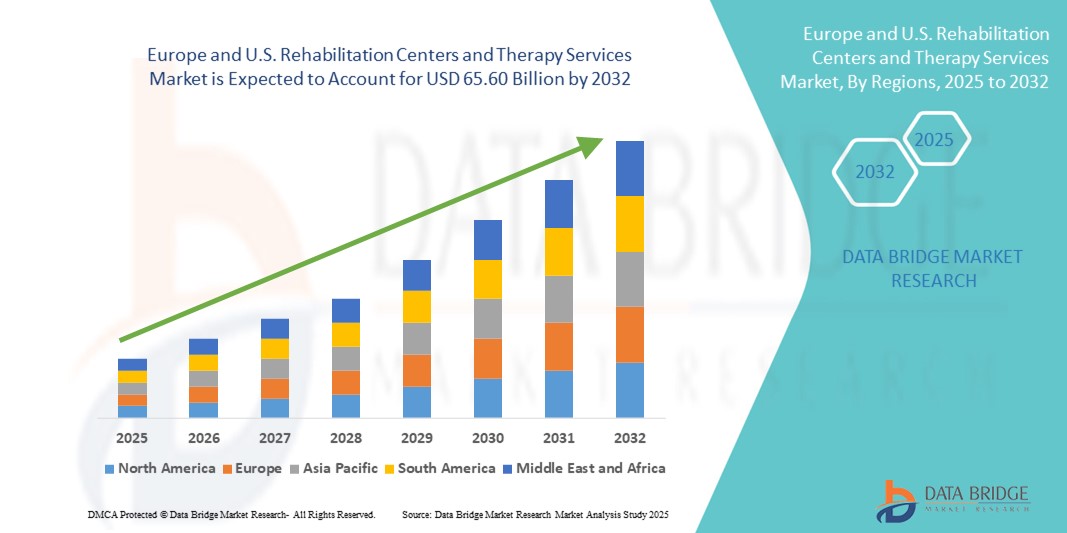
Europe and U.S. Rehabilitation Centers and Therapy Services Market Size
- The Europe and U.S. rehabilitation centers and therapy services market size was valued at USD 45.78 billion in 2024 and is expected to reach USD 65.60 billion by 2032, at a CAGR of 4.60% during the forecast period
- The market growth is largely driven by rising incidences of chronic illnesses, substance abuse, and mental health disorders, leading to increased demand for specialized rehabilitation and therapy services across both regions
- Furthermore, expanding insurance coverage, government support, and the integration of advanced therapeutic technologies such as virtual rehabilitation and teletherapy are establishing rehab centers as essential components in long-term patient care. These reinforcing dynamics are propelling the adoption of comprehensive rehabilitation solutions, thereby significantly boosting the industry's growth
Europe and U.S. Rehabilitation Centers and Therapy Services Market Analysis
- Rehabilitation centers and therapy services, encompassing physical, occupational, speech, and behavioral therapies, are becoming increasingly essential in addressing post-acute care, chronic illness management, and mental health support in both Europe and the U.S., driven by aging populations and increasing incidence of non-communicable diseases
- The growing demand for rehabilitation services is primarily fueled by rising rates of substance abuse, orthopedic injuries, stroke recovery, and neurological conditions, alongside a broader societal focus on holistic and long-term patient recovery outcomes
- U.S. dominated the rehabilitation market with the largest revenue share of 49.1% in 2024, underpinned by strong healthcare infrastructure, advanced therapeutic technologies, and expanded reimbursement frameworks, with a notable rise in outpatient therapy clinics and tele-rehabilitation platforms addressing both urban and rural care gaps
- Germany is expected to be the fastest-growing country in the rehabilitation centers and therapy services market during the forecast period due to its rapidly aging population, strong public insurance coverage, and government investments in integrated, multidisciplinary care models
- Inpatient rehabilitation segment led the market with a share of 40.2% in 2024, driven by the need for intensive, round-the-clock therapeutic support for patients recovering from major surgeries, strokes, or traumatic injuries
Report Scope and Europe and U.S. Rehabilitation Centers and Therapy Services Market Segmentation
|
Attributes |
Europe and U.S. Rehabilitation Centers and Therapy Services Key Market Insights |
|
Segments Covered |
|
|
Countries Covered |
Europe
|
|
Key Market Players |
|
|
Market Opportunities |
|
|
Value Added Data Infosets |
In addition to the insights on market scenarios such as market value, growth rate, segmentation, geographical coverage, and major players, the market reports curated by the Data Bridge Market Research also include in-depth expert analysis, pricing analysis, brand share analysis, consumer survey, demography analysis, supply chain analysis, value chain analysis, raw material/consumables overview, vendor selection criteria, PESTLE Analysis, Porter Analysis, and regulatory framework. |
Europe and U.S. Rehabilitation Centers and Therapy Services Market Trends
Digital Therapeutics and Remote Rehab Transforming Patient Engagement
- A significant and growing trend in the Europe and U.S. rehabilitation market is the integration of digital therapeutics and remote rehabilitation technologies to enhance patient engagement and treatment efficiency
- For instance, platforms such as Hinge Health and Sword Health are delivering digital musculoskeletal therapy via wearables, mobile applications, and virtual coaching, enabling patients to complete therapy plans from home with real-time feedback
- Rehab centers are increasingly adopting AI-driven tools and remote monitoring systems to personalize treatment regimens and track patient progress with greater accuracy. These technologies help reduce readmission rates and optimize resource use, especially in outpatient and post-acute care settings
- Tele-rehabilitation platforms allow therapists to conduct live video sessions, monitor exercises, and adjust therapy plans remotely, improving access for patients in rural or underserved regions
- This digital shift is being driven by healthcare policy changes supporting telehealth, as well as an increase in insurance reimbursement for virtual rehab services. As a result, providers are reimagining rehabilitation as a hybrid care model that blends in-person and digital services
- The widespread adoption of digital therapy tools is redefining the patient-provider relationship and enabling a more proactive, data-driven approach to long-term recovery management, especially in areas such as stroke recovery, orthopedic rehab, and chronic pain therapy
Europe and U.S. Rehabilitation Centers and Therapy Services Market Dynamics
Driver
Increasing Chronic Disease Burden and Aging Demographics Fueling Demand
- The rising prevalence of chronic conditions such as cardiovascular diseases, arthritis, and neurological disorders, along with a rapidly aging population in both Europe and the U.S., is a key driver of market growth for rehabilitation centers and therapy services
- For instance, the U.S. Census Bureau projects that by 2030, one in five Americans will be 65 or older, highlighting the growing need for geriatric-focused rehabilitation services across physical, cognitive, and occupational domains
- Similarly, in Europe, initiatives such as the EU Health Programme are promoting long-term care solutions and rehabilitation accessibility to improve the quality of life for individuals with chronic disabilities or post-operative recovery needs
- This increasing demand is prompting investments in specialized therapy centers, integrated care models, and the expansion of multidisciplinary rehabilitation teams to cater to complex patient needs
- Institutional support, reimbursement incentives, and technological advancements in rehabilitation equipment are further encouraging healthcare providers to scale operations and enhance care delivery
Restraint/Challenge
Workforce Shortages and Regulatory Complexity in Service Delivery
- A major challenge hindering market expansion is the shortage of trained rehabilitation professionals, including physical therapists, occupational therapists, and behavioral health specialists, which limits care capacity in both urban and rural settings
- For instance, the American Physical Therapy Association reports a growing gap between demand and availability of licensed therapists, especially in post-acute care and long-term rehabilitation facilities
- In Europe, disparities in healthcare funding, staffing, and licensing requirements across countries pose additional barriers to standardized and scalable rehab service delivery
- Navigating complex regulatory frameworks, especially for cross-border digital health services or tele-rehab, can delay implementation and limit adoption, particularly in public healthcare systems
- Addressing these workforce and policy challenges through streamlined certification processes, investment in training programs, and harmonized regulations across regions will be essential for sustaining long-term growth in rehabilitation services
Europe and U.S. Rehabilitation Centers and Therapy Services Market Scope
The market is segmented on the basis of service, age group, service type, application, end user, and service channel.
- By Service
On the basis of service, the rehabilitation centers and therapy services market is segmented into physical therapy, occupational therapy, speech therapy, cognitive behavioral therapy, respiratory therapy, and others. The physical therapy segment dominated the market with the largest revenue share in 2024, driven by the increasing prevalence of orthopedic injuries, post-surgical recovery needs, and age-related physical limitations. Patients recovering from musculoskeletal disorders, surgeries, or trauma commonly undergo physical therapy as a core component of their rehabilitation plan.
The cognitive behavioral therapy segment is anticipated to witness the fastest growth rate from 2025 to 2032, fueled by the growing burden of mental health disorders such as anxiety and depression. The expansion of digital mental health platforms and increasing acceptance of virtual therapy models have further accelerated the adoption of CBT services in both outpatient and remote care settings.
- By Age Group
On the basis of age group, the rehabilitation centers and therapy services market is segmented into elderly, adult, and pediatric. The elderly segment accounted for the largest market share in 2024, supported by the rising geriatric population in both the U.S. and Europe, who require rehabilitation services for age-related conditions such as arthritis, stroke, and neurodegenerative diseases.
The pediatric segment is expected to register the fastest CAGR from 2025 to 2032, driven by early screening and intervention programs targeting developmental delays, congenital conditions, and speech or behavioral disorders. Growing parental awareness and supportive healthcare policies are contributing to the rapid expansion of pediatric rehabilitation services.
- By Service Type
On the basis of service type, the rehabilitation centers and therapy services market is segmented into outpatient rehabilitation services and inpatient rehabilitation services. The inpatient rehabilitation services segment held the largest market revenue share of 40.2% in 2024, driven by the need for intensive, 24/7 medical and therapeutic care for patients recovering from surgeries, severe injuries, or neurological events such as strokes.
The outpatient rehabilitation services segment is projected to experience the highest growth during the forecast period, due to the increasing demand for flexible, cost-effective therapy models and the adoption of tele-rehabilitation platforms that allow patients to receive care from the convenience of their homes.
- By Application
On the basis of application, the rehabilitation centers and therapy services market is segmented into orthopedic rehabilitation therapy services, neurological rehabilitation therapy services, speech rehabilitation therapy services, cardiological rehabilitation therapy services, sports-related injuries, pulmonary rehabilitation therapy services, and others. The orthopedic rehabilitation therapy services segment dominated the market with the largest market share in 2024, attributed to the high incidence of musculoskeletal disorders, joint replacements, and physical trauma.
The neurological rehabilitation therapy services segment is expected to witness the fastest growth from 2025 to 2032, driven by the increasing prevalence of stroke, traumatic brain injuries, and neurodegenerative diseases such as Parkinson’s and multiple sclerosis.
- By End User
On the basis of end user, the rehabilitation centers and therapy services market is segmented into rehabilitation centers, sports and fitness facility centers, skilled nursing facilities, hospitals, and others. The rehabilitation centers segment held the largest market revenue share in 2024, supported by specialized treatment offerings, multidisciplinary care models, and rising referral rates from hospitals and primary care providers.
The sports and fitness facility centers segment is projected to grow at the fastest CAGR during the forecast period, driven by the increasing number of sports injuries, a growing emphasis on athletic performance recovery, and the rising integration of physical therapy within sports and wellness programs.
- By Service Channel
On the basis of service channel, the rehabilitation centers and therapy services market is segmented into direct channel and online channel. The direct channel segment accounted for the largest revenue share in 2024, as in-person therapy remains the standard for high-touch rehabilitation services that require specialized equipment and close supervision.
The online channel segment is expected to witness the fastest growth from 2025 to 2032, fueled by the growing adoption of digital health platforms, increased patient comfort with virtual consultations, and the expansion of tele-rehabilitation models offering remote access to therapy services.
Europe and U.S. Rehabilitation Centers and Therapy Services Market Regional Analysis
- The U.S. dominated the rehabilitation market with the largest revenue share of 49.1% in 2024, underpinned by strong healthcare infrastructure, advanced therapeutic technologies, and expanded reimbursement frameworks, with a notable rise in outpatient therapy clinics and tele-rehabilitation platforms addressing both urban and rural care gaps
- Patients and providers in the U.S. value the accessibility, multidisciplinary approach, and integration of advanced technologies such as tele-rehabilitation and digital therapy tools, which enhance patient outcomes and convenience
- This strong market position is further supported by favorable insurance reimbursement policies, a high rate of elderly population growth, and significant investments in outpatient and home-based rehabilitation models, making the U.S. a leader in modern rehabilitation service delivery across both clinical and virtual environments
The U.S. Rehabilitation Centers and Therapy Services Market Insight
The U.S. rehabilitation centers and therapy services market captured the largest revenue share in 2024 across North America, driven by a robust healthcare infrastructure, growing elderly population, and high demand for chronic care management. The expansion of outpatient and home-based therapy models, alongside increased adoption of digital platforms for remote rehabilitation, is transforming the care landscape. In addition, supportive reimbursement policies and rising awareness of mental and physical recovery are accelerating the integration of rehabilitation services into mainstream healthcare delivery.
U.K. Rehabilitation Centers and Therapy Services Market Insight
The U.K. rehabilitation centers and therapy services market is anticipated to grow at a noteworthy CAGR during the forecast period, driven by NHS-backed initiatives to expand physical, cognitive, and behavioral therapy access. Demand is rising across both urban and rural areas for outpatient rehabilitation and virtual therapy solutions. Increasing attention to post-operative care, long COVID recovery, and community-based mental health programs is helping drive rehabilitation service growth across public and private sectors.
Germany Rehabilitation Centers and Therapy Services Market Insight
The Germany rehabilitation centers and therapy services market is expected to expand at the fastest CAGR during the forecast period, supported by a rapidly aging population, increasing prevalence of neurological and orthopedic conditions, and strong insurance coverage. Germany’s emphasis on early intervention, prevention-focused therapy, and integration of AI and digital technologies in rehabilitation care is transforming both inpatient and outpatient services. The country’s investment in innovative, patient-centered rehab models positions it as the fastest-growing market in Europe.
France Rehabilitation Centers and Therapy Services Market Insight
The France rehabilitation centers and therapy services market is projected to experience steady growth, driven by increased demand for post-hospitalization care, mental health services, and elderly support programs. The integration of rehabilitation services into primary healthcare, combined with digital transformation in therapy delivery, is improving patient outcomes. France’s public healthcare initiatives are prioritizing recovery-oriented care models, especially for stroke and orthopedic patients.
Italy Rehabilitation Centers and Therapy Services Market Insight
The Italy rehabilitation centers and therapy services market is anticipated to grow steadily, fueled by demographic shifts and increasing emphasis on chronic disease management. Rising public investment in long-term care, along with the growth of private rehab centers, is expanding service availability. Italy is also adopting tele-rehabilitation and digital health tools to improve access, particularly for mobility-impaired and elderly populations in less urbanized regions.
Europe and U.S. Rehabilitation Centers and Therapy Services Market Share
The Europe and U.S. Rehabilitation Centers and Therapy Services industry is primarily led by well-established companies, including:
- Select Medical Holdings Corporation (U.S.)
- Encompass Health Corporation (U.S.)
- Kindred Rehabilitation Services (U.S.)
- Genesis HealthCare (U.S.)
- RehabCare Group, Inc. (U.S.)
- ATI Physical Therapy, Inc. (U.S.)
- U.S. Physical Therapy, Inc. (U.S.)
- Brooks Rehabilitation (U.S.)
- Kessler Institute for Rehabilitation (U.S.)
- Acadia Healthcare Company, Inc. (U.S.)
- MEDIAN Kliniken (Germany)
- Fresenius Vamed (Germany)
- Nuffield Health (U.K.)
- Circle Health Group (U.K.)
- Spire Healthcare Group plc (U.K.)
- Bupa (U.K.)
- Helios Kliniken GmbH (Germany)
- Amita Health Rehabilitation Hospital (U.S.)
- Royal Rehab (U.K.)
- The Priory Group (U.K.)
What are the Recent Developments in Europe and U.S. Rehabilitation Centers and Therapy Services Market?
- In May 2024, Select Medical Corporation (U.S.), a prominent provider of specialized healthcare services, expanded its rehabilitation network by opening new inpatient rehabilitation hospitals across Texas and California. These facilities are designed to provide advanced neurorehabilitation, orthopedic, and cardiac recovery services. This strategic expansion aligns with the growing demand for specialized, patient-centered rehabilitative care across the U.S., reinforcing Select Medical’s leadership in the therapy services domain
- In April 2024, Fresenius Vamed (Germany), a key player in post-acute care, announced the launch of its “Hybrid Rehabilitation Model” across multiple European clinics. Combining in-person treatment with digital therapy platforms, the initiative aims to improve access and continuity of care. This hybrid model addresses the challenges of patient mobility and geographic accessibility, while enhancing long-term treatment adherence and outcomes
- In March 2024, Brooks Rehabilitation (U.S.) introduced a comprehensive telerehabilitation program focused on stroke and spinal cord injury recovery. By integrating wearable sensors and AI-driven monitoring tools, the program enables therapists to deliver high-quality remote care and track patient progress in real time. This development marks a major step in enhancing home-based recovery and expanding access to therapy services nationwide
- In February 2024, Nuffield Health (U.K.) partnered with the National Health Service (NHS) to provide community-based rehabilitation for long COVID patients. The program combines respiratory therapy, mental health support, and physical rehabilitation, reflecting a multidisciplinary approach tailored to post-viral recovery. This collaboration highlights the growing role of private-public partnerships in addressing complex rehabilitation needs across the U.K.
- In January 2024, MEDIAN Kliniken (Germany), one of Europe’s largest private rehabilitation providers, inaugurated a new state-of-the-art facility in Baden-Württemberg, focused on musculoskeletal and psychosomatic rehabilitation. Equipped with cutting-edge robotics and personalized therapy platforms, the facility exemplifies the integration of advanced technology into rehabilitative care. This move strengthens MEDIAN’s position as a leader in evidence-based, tech-enhanced recovery solutions across Europe
SKU-
Get online access to the report on the World's First Market Intelligence Cloud

- Interactive Data Analysis Dashboard
- Company Analysis Dashboard for high growth potential opportunities
- Research Analyst Access for customization & queries
- Competitor Analysis with Interactive dashboard
- Latest News, Updates & Trend analysis
- Harness the Power of Benchmark Analysis for Comprehensive Competitor Tracking
Research Methodology
Data collection and base year analysis are done using data collection modules with large sample sizes. The stage includes obtaining market information or related data through various sources and strategies. It includes examining and planning all the data acquired from the past in advance. It likewise envelops the examination of information inconsistencies seen across different information sources. The market data is analysed and estimated using market statistical and coherent models. Also, market share analysis and key trend analysis are the major success factors in the market report. To know more, please request an analyst call or drop down your inquiry.
The key research methodology used by DBMR research team is data triangulation which involves data mining, analysis of the impact of data variables on the market and primary (industry expert) validation. Data models include Vendor Positioning Grid, Market Time Line Analysis, Market Overview and Guide, Company Positioning Grid, Patent Analysis, Pricing Analysis, Company Market Share Analysis, Standards of Measurement, Global versus Regional and Vendor Share Analysis. To know more about the research methodology, drop in an inquiry to speak to our industry experts.
Customization Available
Data Bridge Market Research is a leader in advanced formative research. We take pride in servicing our existing and new customers with data and analysis that match and suits their goal. The report can be customized to include price trend analysis of target brands understanding the market for additional countries (ask for the list of countries), clinical trial results data, literature review, refurbished market and product base analysis. Market analysis of target competitors can be analyzed from technology-based analysis to market portfolio strategies. We can add as many competitors that you require data about in the format and data style you are looking for. Our team of analysts can also provide you data in crude raw excel files pivot tables (Fact book) or can assist you in creating presentations from the data sets available in the report.

