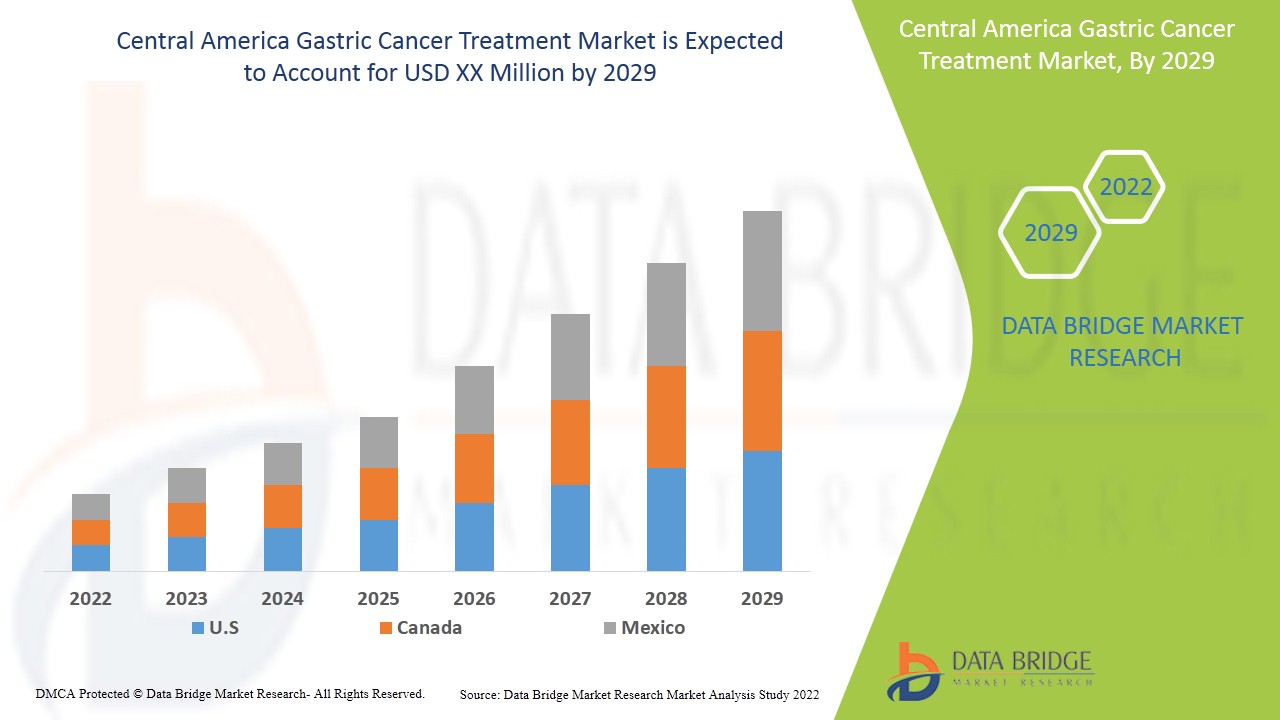
Central America Gastric Cancer Treatment Market Analysis and Insights
Gastric adenocarcinoma is the fourth most common type of cancer and the second leading cause of cancer death in the world. Stomach cancer is an abnormal growth of cells that begins in the stomach. Stomach cancer, also known as gastric cancer, can affect any part of the stomach. In most of the world, stomach cancers form in the main part of the stomach (stomach body). But in the U.S., stomach cancer is more likely to affect the area where the esophagus meets the stomach. This area is called the gastroesophageal junction.
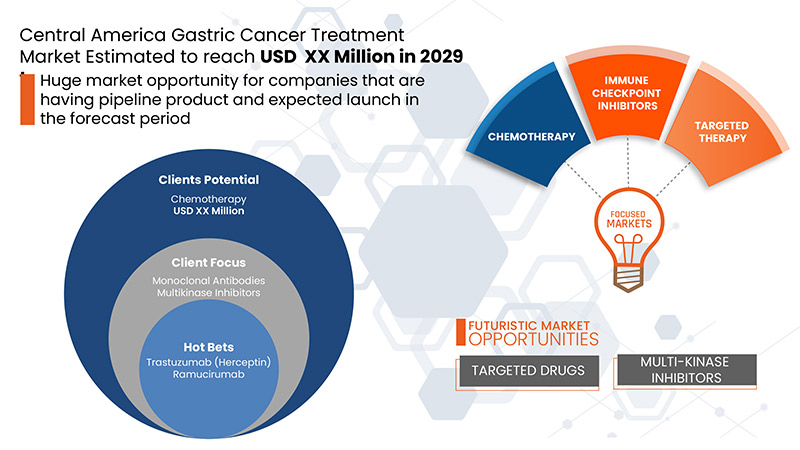
Increase in incidence of gastrointestinal tumors with the growing pace of geriatric population is demonstrating the escalation in the number of gastric cancer treatment. Owning to this, it is estimated that growing geriatric population is a major driving factor for the growth of the market.
The gastric cancer treatment is supportive and aims to reduce the progression of the disease. Data Bridge Market Research analyses that the inherited gastric cancer treatment will grow at a CAGR of 7.2% during the forecast period of 2022 to 2029.
|
Report Metric |
Details |
|
Forecast Period |
2022 to 2029 |
|
Base Year |
2021 |
|
Historic Years |
2020 (Customizable to 2019 - 2014) |
|
Quantitative Units |
Revenue in USD Million, Pricing in USD |
|
Segments Covered |
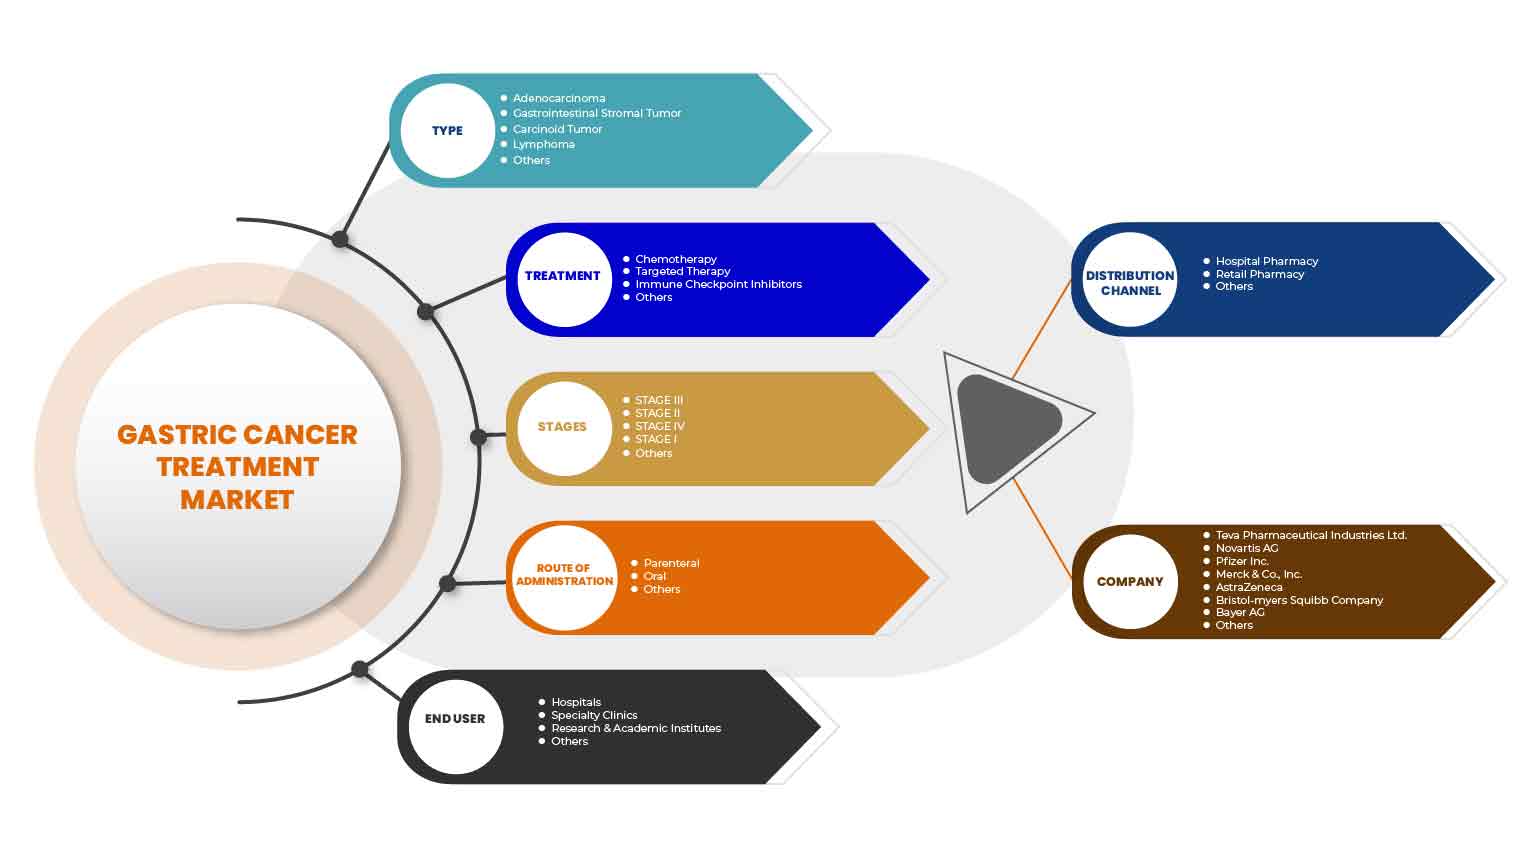
By Type (Adenocarcinoma, Gastrointestinal Stromal Tumor, Carcinoid Tumor, Lymphoma, and Others), Stages (Stage I, Stage II, Stage III, Stage IV, and Others), Treatment (Chemotherapy, Targeted Therapy, Immune Checkpoint Inhibitors and Others), Route of Administration (Oral, Parenteral and Others), End user (Hospitals, Specialty Clinics, Research & Academic Institutes and Others), Distribution Channel (Hospital Pharmacy, Retail Pharmacy and Others) |
|
Countries Covered |
Costa Rica, Guatemala, Panama, Dominican Republic and Rest of Central America |
|
Market Players Covered |
Hoffmann-La Roche Ltd., Merck & Co., Inc., Pfizer Inc., Teva Pharmaceutical Industries Ltd., AstraZeneca, Bayer AG, Novartis AG, Bristol-Myers Squibb Company, Eli Lilly and Company, Laboratorio Varifarma SA, Seven pharma, Janssen Global Services, LLC (A subsidiary of Johnson & Johnson Services, Inc.) and Sanofi among others |
Gastric Cancer Treatment Market Dynamics
Drivers
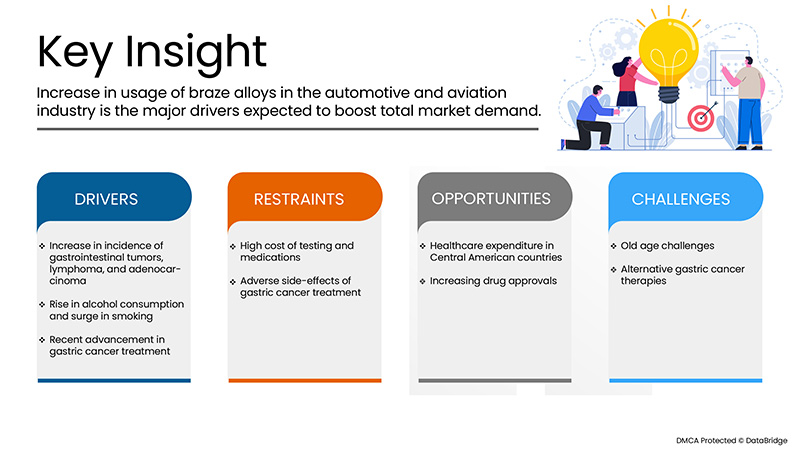
- Increase in Incidence of Gastrointestinal Tumours, Lymphoma, and Adenocarcinoma
The increased incidence of gastrointestinal tumors, lymphoma, and adenocarcinoma is increasing the demand for the early detection and diagnosis via utilizing the latest technology, thereby propelling the growth of the Central America gastric cancer treatment market.
- Rise in Alcohol Consumption and Surge in Smoking
The combined use of cigarettes and alcohol poses health concerns and severe public health issue that collectively lead to gastric cancer. A chemical chain reaction occurs every time a smoker inhales a lit cigarette, producing dozens of hazardous chemicals. Cigarette smoke contains substances inhaled through the lips, through the tongue and mouth, down the throat, and into the lungs, producing inflammation and exposing that aero-digestive tract to cancer-causing chemicals.
Also, the high incidence of obesity in these countries is expected to drive the growth of Central America gastric cancer treatment market.
Furthermore, Increase in strategic initiatives by key players, advancement in medical technology, recent advancements in gastric cancer treatment, rising initiatives by public and private organizations to spread awareness and growing government funding are the factors that will expand the gastric cancer treatment market.
Opportunities
- Healthcare Expenditure of Central American Countries
Moreover, the increase in awareness and treatment-seeking rate and emerging reimbursement policies for the treatment will boost new opportunities for the market's growth rate.
Also, the increasing drug approvals will provide beneficial opportunities for the gastric cancer treatment market in the forecast period of 2022-2029. Also, the partnership and agreement by major players will escalate the growth rate of the gastric cancer treatment market in the future.
Restraints/Challenges
However, the costs associated with other medical care and interventions (such as surgical interventions and radiotherapy) and supportive care (such as anti-emetics and hematopoietic growth factors) would make overall care even more unaffordable. Even with insurance coverage, patients living with cancer in many countries have reported financial stress, to the extent that they may lower the treatment dose, partially fill prescriptions, or even forego treatment altogether.
This gastric cancer treatment market report provides details of new recent developments, trade regulations, import-export analysis, production analysis, value chain optimization, market share, the impact of domestic and localized market players, analyses opportunities in terms of emerging revenue pockets, changes in market regulations, strategic market growth analysis, market size, category market growths, application niches and dominance, product approvals, product launches, geographic expansions, technological innovations in the market. To gain more info on Gastric Cancer treatment market contact Data Bridge Market Research for an Analyst Brief, our team will help you take an informed market decision to achieve market growth.
Patient Epidemiology Analysis
Gastric cancer disease is the 5th most commonly diagnosed cancer in the world, and the 7th most prevalent. Gastric cancer is more prevalent in males. In developed countries, gastric cancer is 2.2 times more likely to be diagnosed in males than females. In developing countries, this ratio is 1.83. In 5 countries worldwide, gastric cancer has the highest incidence among all cancers for males.
Most cancers of the stomach (about 90% to 95%) are adenocarcinomas. These cancers develop from the gland cells in the innermost lining of the stomach (the mucosa). Stomach cancer mostly affects older people. The average age of people when they are diagnosed is 68. About 6 of every 10 people diagnosed with stomach cancer each year are 65 or older. The lifetime risk of developing stomach cancer is higher in men (about 1 in 96) than in women (about 1 in 152). But each person's risk can be affected by many other factors
The gastric cancer treatment market also provides you with detailed market analysis for patient analysis, prognosis and cures. Prevalence, incidence, mortality, adherence rates are some of the data variables that are available in the report. Direct or indirect impact analyses of epidemiology to market growth are analyzed to create a more robust and cohort multivariate statistical model for forecasting the market in the growth period.
Post COVID-19 Impact on Gastric Cancer Treatment Market
The COVID-19 has negatively affected the market. Lockdowns and isolation during pandemics complicate the disease management and medication adherence. The lack of access to health-care facilities for routine treatment and medication administration will further affect the market. Social isolation increases stress, despair, and social support, all of which may cause a reduction in anticonvulsant medication adherence during the pandemic.
Recent Development
- In March 2021, Amgen and Five Prime Therapeutics, a clinical-stage biotechnology company that is focused on developing immuno-oncology and targeted cancer therapies, announced an agreement under which Amgen will acquire Five Prime Therapeutics. The acquisition will also include Bemarituzumab, A Phase 3 program for gastric cancer
Central America Gastric Cancer Treatment Market Scope
Central America gastric cancer treatment market is categorized into six notable segments, which are based on type, stage, treatment, route of administration, end user, and distribution channel. The growth amongst these segments will help you analyze meagre growth segments in the industries and provide the users with a valuable market overview and market insights to make strategic decisions to identify core market applications.
Type
- Adenocarcinoma
- Lymphoma
- Gastrointestinal stromal tumor
- Carcinoid tumor
- Others
On the basis of type, the market is segmented into adenocarcinoma, lymphoma, gastrointestinal stromal tumor, carcinoid tumor, and others.
Stage
- Stage I
- Stage II
- Stage III
- Stage IV
- Others
On the basis of stage, the market is segmented into stage I, stage II, stage III, stage IV, and others.
Treatment
- Chemotherapy
- Targeted Therapy
- Immune Checkpoint Inhibitors
- Others
On the basis of treatment, the market is segmented into chemotherapy, targeted therapy, immunotherapy, and others.
Route of Administration
- Oral
- Parenteral
On the basis of route of administration, the market is segmented into oral and parenteral.
End User
- Hospitals
- Specialty Clinics
- Research and Academic Institutes
- Others
On the basis of end-users, the Central America gastric cancer treatment market is segmented into hospitals, specialty clinics, research and academic institutes and others.
Distribution Channel
- Retail Pharmacy
- Hospital Pharmacy
- Others
Central America gastric cancer treatment market is also segmented on the basis of distribution channel into retail pharmacy, hospital pharmacy and others.
Pipeline Analysis
The pipeline analysis of drugs includes various pipeline therapies such as Zolbetuximab (IMAB362) plus mFOLFOX6, Nivolumab and Ipilimumab, Pembrolizumab (MK-3745) + Cisplatin, Regorafenib (Stivarga, BAY73-4506), lapatinib, NCT03653507, Durvalumab or Placebo and FLOT Chemotherapy. Astellas Pharma Inc., Bristol-Myers Squibb Company, Merck Sharp & Dohme Corp., Bayer AG, Novartis AG are involved in the development of potential drugs for the improvement of treatment of gastric cancer.
Gastric Cancer Treatment Market Regional Analysis/Insights
The gastric cancer treatment market is analysed and market size insights and trends are provided by country, type, stages, treatment, route of administration, end-user and distribution channel as referenced above.
The countries covered in the gastric cancer treatment market report are Costa Rica, Guatemala, Panama, Dominican Republic and rest of Central America.
Costa Rica dominates the gastric cancer treatment market in terms of market share and market revenue and will continue to flourish its dominance during the forecast period. This is due to the presence of major key players and well-developed healthcare infrastructure in this country.
The country section of the report also provides individual market impacting factors and changes in regulations in the market that impact the current and future trends of the market. Data points, such as new and replacement sales, country demographics, disease epidemiology, and import-export tariffs, are some of the major pointers used to forecast the market scenario for individual countries. In addition, the presence and availability of global brands and their challenges faced due to high competition from local and domestic brands, and impact of sales channels are considered while providing forecast analysis of the country data.
Competitive Landscape and Central America Gastric Cancer Treatment Market Share Analysis
The gastric cancer treatment market competitive landscape provides details by the competitors. Details included are company overview, company financials, revenue generated, market potential, investment in research and development, new market initiatives, global presence, production sites and facilities, production capacities, company strengths and weaknesses, product launch, product width and breadth, and application dominance. The above data points provided are only related to the companies' focus on gastric cancer treatment.
Some of the major companies operating in the Central America gastric cancer treatment market are F. Hoffmann-La Roche Ltd., Merck & Co., Inc., Pfizer Inc., Teva Pharmaceutical Industries Ltd., AstraZeneca, Bayer AG, Novartis AG, Bristol-Myers Squibb Company, Eli Lilly and Company, Laboratorio Varifarma SA, Seven pharma, Janssen Global Services, LLC (A subsidiary of Johnson & Johnson Services, Inc.) and Sanofi, and others.
Research Methodology
Data collection and base year analysis are done using data collection modules with large sample sizes. The market data is analysed and estimated using market statistical and coherent models. In addition, market share analysis and key trend analysis are the major success factors in the market report. The key research methodology used by DBMR research team is data triangulation which involves data mining, analysis of the impact of data variables on the market, and primary (industry expert) validation. Apart from this, data models include Vendor Positioning Grid, Market Time Line Analysis, Market Overview and Guide, Company Positioning Grid, Company Market Share Analysis, Standards of Measurement, Global Vs Regional and Vendor Share Analysis. Please request analyst call in case of further inquiry.
SKU-
Get online access to the report on the World's First Market Intelligence Cloud
- Interactive Data Analysis Dashboard
- Company Analysis Dashboard for high growth potential opportunities
- Research Analyst Access for customization & queries
- Competitor Analysis with Interactive dashboard
- Latest News, Updates & Trend analysis
- Harness the Power of Benchmark Analysis for Comprehensive Competitor Tracking
Table of Content
1 INTRODUCTION
1.1 OBJECTIVES OF THE STUDY
1.2 MARKET DEFINITION
1.3 OVERVIEW OF CENTRAL AMERICA GASTRIC CANCER TREATMENT MARKET
1.4 LIMITATIONS
1.5 MARKETS COVERED
2 MARKET SEGMENTATION
2.1 MARKETS COVERED
2.2 GEOGRAPHICAL SCOPE
2.3 YEARS CONSIDERED FOR THE STUDY
2.4 CURRENCY AND PRICING
2.5 DBMR TRIPOD DATA VALIDATION MODEL
2.6 PRIMARY INTERVIEWS WITH KEY OPINION LEADERS
2.7 MULTIVARIATE MODELLING
2.8 TYPE LIFELINE CURVE
2.9 DBMR MARKET POSITION GRID
2.1 VENDOR SHARE ANALYSIS
2.11 MARKET END USER COVERAGE GRID
2.12 SECONDARY SOURCES
2.13 ASSUMPTIONS
3 EXECUTIVE SUMMARY
4 PREMIUM INSIGHTS
4.1 PESTEL ANALYSIS
4.2 PORTERS FIVE FORCES
4.3 INNOVATIVE TREATMENT VS CHEMOTHERAPY
4.3.1 TARGETED THERAPIES
4.3.2 CHEMOTHERAPY
4.3.3 CONCLUSION
4.3.4 PRIMARY LINE OF TREATMENT OF GASTRIC CANCER
5 EPIDERMOLOGY
6 PIPELINE ANALYSIS FOR CHILE GASTRIC CANCER TREATMENT MARKET
7 REGULATIONS OF CENTRAL AMERICA GASTRIC CANCER TREATMENT MARKET
7.1 COSTA RICA
7.2 GUATEMALA
7.3 PANAMA
8 MARKET OVERVIEW
8.1 DRIVERS
8.1.1 INCREASE IN INCIDENCE OF GASTROINTESTINAL TUMORS, LYMPHOMA, AND ADENOCARCINOMA
8.1.2 RISE IN ALCOHOL CONSUMPTION AND SURGE IN SMOKING
8.1.3 HIGH INCIDENCE OF OBESITY
8.1.4 RECENT ADVANCEMENT IN GASTRIC CANCER TREATMENT
8.2 RESTRAINTS
8.2.1 HIGH COST OF TESTING AND MEDICATIONS
8.2.2 ADVERSE SIDE-EFFECTS OF GASTRIC CANCER TREATMENT
8.3 OPPORTUNITIES
8.3.1 HEALTHCARE EXPENDITURE IN CENTRAL AMERICAN COUNTRIES
8.3.2 INCREASING DRUG APPROVALS
8.3.3 PARTNERSHIP AND AGREEMENT BY MAJOR PLAYERS
8.3.4 INCREASING SUPPORT OF PRIVATE AND GOVERNMENT AGENCIES FOR TREATMENT
8.4 CHALLENGES
8.4.1 OLD AGE CHALLENGES
8.4.2 ALTERNATIVE GASTRIC CANCER THERAPIES
9 CENTRAL AMERICA GASTRIC CANCER TREATMENT MARKET, BY TYPE
9.1 OVERVIEW
9.2 ADENOCARCINOMA
9.3 GASTROINTESTINAL STROMAL TUMOR
9.4 CARCINOID TUMOR
9.5 LYMPHOMA
9.6 OTHERS
10 CENTRAL AMERICA GASTRIC CANCER TREATMENT MARKET, BY STAGES
10.1 OVERVIEW
10.2 STAGE III
10.3 STAGE II
10.4 STAGE IV
10.5 STAGE I
10.6 OTHERS
11 CENTRAL AMERICA GASTRIC CANCER TREATMENT MARKET, BY TREATMENT
11.1 OVERVIEW
11.2 CHEMOTHERAPY
11.2.1 FLUOROURACIL
11.2.2 OXALIPLATIN
11.2.3 CISPLATIN
11.2.4 DOCETAXEL
11.2.5 PACLITAXEL
11.2.6 IRINOTECAN
11.2.7 CAPECITABINE
11.2.8 CARBOPLATIN
11.2.9 EPIRUBICIN
11.2.10 OTHERS
11.3 TARGETED THERAPY
11.3.1 MONOCLONAL ANTIBODY THERAPY
11.3.1.1 TRASTUZUMAB (HERCEPTIN)
11.3.1.2 RAMUCIRUMAB
11.3.2 MULTIKINASE INHIBITORS
11.3.2.1 SUNITINIB
11.3.2.2 REGORAFENIB
11.4 IMMUNE CHECKPOINT INHIBITORS
11.5 OTHERS
12 CENTRAL AMERICA GASTRIC CANCER TREATMENT MARKET, BY ROUTE OF ADMINISTRATION
12.1 OVERVIEW
12.2 PARENTERAL
12.2.1 INTRAVENOUS
12.2.2 SUBCUTANEOUS
12.2.3 OTHERS
12.3 ORAL
12.3.1 TABLET
12.3.2 CAPSULE
12.3.3 OTHERS
12.4 OTHERS
13 CENTRAL AMERICA GASTRIC CANCER TREATMENT MARKET, BY END USER
13.1 OVERVIEW
13.2 HOSPITALS
13.3 SPECIALITY CLINICS
13.4 RESEARCH & ACADEMIC INSTITUTES
13.5 OTHERS
14 CENTRAL AMERICA GASTRIC CANCER TREATMENT MARKET, BY DISTRIBUTION CHANNEL
14.1 OVERVIEW
14.2 HOSPITAL PHARMACY
14.3 RETAIL PHARMACY
14.4 OTHERS
15 CENTRAL AMERICA GASTRIC CANCER TREATMENT MARKET, BY COUNTRY
15.1 CENTRAL AMERICA
15.1.1 COSTA RICA
15.1.2 PANAMA
15.1.3 GUATEMALA
15.1.4 DOMINICAN REPUBLIC
15.1.5 REST OF CENTRAL AMERICA
16 CENTRAL AMERICA GASTRIC CANCER TREATMENT MARKET, COMPANY LANDSCAPE
16.1 COMPANY SHARE ANALYSIS: CENTRAL AMERICA
17 SWOT ANALYSIS
18 COMPANY PROFILE
18.1 MERCK & CO., INC
18.1.1 COMPANY SNAPSHOT
18.1.2 REVENUE ANALYSIS
18.1.3 PRODUCT PORTFOLIO
18.1.4 RECENT DEVELOPMENTS
18.1.4.1 PRODUCT APPROVAL
18.1.4.2 EVENTS
18.2 F.HOFFMANN-LA ROCHE AG
18.2.1 COMPANY SNAPSHOT
18.2.2 REVENUE ANALYSIS
18.2.3 PRODUCT PORTFOLIO
18.2.4 RECENT DEVELOPMENT
18.2.4.1 AGREEMENT
18.3 ELI LILLY AND COMPANY
18.3.1 COMPANY SNAPSHOT
18.3.2 REVENUE ANALYSIS
18.3.3 PRODUCT PORTFOLIO
18.3.4 RECENT DEVELOPMENT
18.3.4.1 APPROVAL
18.4 TEVA PHARMACEUTICAL INDUSTRIES LTD
18.4.1 COMPANY SNAPSHOT
18.4.2 REVENUE ANALYSIS
18.4.3 PRODUCT PORTFOLIO
18.4.4 RECENT DEVELOPMENT
18.4.4.1 COLLABORATION
18.5 BRISTOL-MYERS SQUIBB COMPANY
18.5.1 COMPANY SNAPSHOT
18.5.2 REVENUE ANALYSIS
18.5.3 PRODUCT PORTFOLIO
18.5.4 RECENT DEVELOPMENT
18.5.4.1 PRODUCT APPROVAL
18.6 BAYER AG
18.6.1 COMPANY SNAPSHOT
18.6.2 REVENUE ANALYSIS
18.6.3 PRODUCT PORTFOLIO
18.6.4 RECENT DEVELOPMENT
18.6.4.1 COLLABORATION
18.7 SEVEN PHARMA
18.7.1 COMPANY SNAPSHOT
18.7.2 PRODUCT PORTFOLIO
18.7.3 RECENT DEVELOPMENT
18.8 JANSSEN GLOBAL SERVICES, LLC (A SUBSIDIARY OF JOHNSON & JOHNSON SERVICES, INC.)
18.8.1 COMPANY SNAPSHOT
18.8.2 REVENUE ANALYSIS
18.8.3 PRODUCT PORTFOLIO
18.8.4 RECENT DEVELOPMENT
18.9 ASTRAZENECA
18.9.1 COMPANY SNAPSHOT
18.9.2 REVENUE ANALYSIS
18.9.3 PRODUCT PORTFOLIO
18.9.4 RECENT DEVELOPMENT
18.9.4.1 PRODUCT APPROVAL
18.1 LABORATORIO VARIFARMA SA
18.10.1 COMPANY SNAPSHOT
18.10.2 PRODUCT PORTFOLIO
18.10.3 RECENT DEVELOPMENT
18.10.3.1 EXPANSION
18.11 NOVARTIS AG
18.11.1 COMPANY SNAPSHOT
18.11.2 REVENUE ANALYSIS
18.11.3 PRODUCT PORTFOLIO
18.11.4 RECENT DEVELOPMENT
18.11.4.1 PRODUCT LAUNCH
18.12 PFIZER INC.
18.12.1 COMPANY SNAPSHOT
18.12.2 REVENUE ANALYSIS
18.12.3 PRODUCT PORTFOLIO
18.12.4 RECENT DEVELOPMENTS
18.12.4.1 MERGER
18.12.4.2 COLLABORATION
18.13 SANOFI
18.13.1 COMPANY SNAPSHOT
18.13.2 REVENUE ANALYSIS
18.13.3 PRODUCT PORTFOLIO
18.13.4 RECENT DEVELOPMENT
18.13.4.1 ACQUISITION
19 QUESTIONNAIRE
20 RELATED REPORTS
List of Table
T, BY STAGES, 2020-2029 (USD MILLION)
TABLE 5 CENTRAL AMERICA GASTRIC CANCER TREATMENT MARKET, BY TREATMENT, 2020-2029 (USD MILLION)
TABLE 6 CENTRAL AMERICA CHEMOTHERAPY IN GASTRIC CANCER TREATMENT MARKET, BY TREATMENT, 2020-2029 (USD MILLION)
TABLE 7 CENTRAL AMERICA TARGETED THERAPY IN GASTRIC CANCER TREATMENT MARKET, BY TREATMENT, 2020-2029 (USD MILLION)
TABLE 8 CENTRAL AMERICA MONOCLONAL ANTIBODY THERAPY IN GASTRIC CANCER TREATMENT MARKET, BY TREATMENT, 2020-2029 (USD MILLION)
TABLE 9 CENTRAL AMERICA MULTIKINASE INHIBITORS IN GASTRIC CANCER TREATMENT MARKET, BY TREATMENT, 2020-2029 (USD MILLION)
TABLE 10 CENTRAL AMERICA GASTRIC CANCER TREATMENT MARKET, BY ROUTE OF ADMINISTRATION, 2020-2029 (USD MILLION)
TABLE 11 CENTRAL AMERICA PARENTERAL IN GASTRIC CANCER TREATMENT MARKET, BY ROUTE OF ADMINISTRATION, 2020-2029 (USD MILLION)
TABLE 12 CENTRAL AMERICA ORAL IN GASTRIC CANCER TREATMENT MARKET, BY ROUTE OF ADMINISTRATION, 2020-2029 (USD MILLION)
TABLE 13 CENTRAL AMERICA GASTRIC CANCER TREATMENT MARKET, BY END USER, 2020-2029 (USD MILLION)
TABLE 14 CENTRAL AMERICA GASTRIC CANCER TREATMENT MARKET, BY DISTRIBUTION CHANNEL, 2020-2029 (USD MILLION)
TABLE 15 CENTRAL AMERICA GASTRIC CANCER TREATMENT MARKET, BY COUNTRY, 2020-2029 (USD MILLION)
TABLE 16 COSTA RICA GASTRIC CANCER TREATMENT MARKET, BY TYPE, 2020-2029 (USD MILLION)
TABLE 17 COSTA RICA GASTRIC CANCER TREATMENT MARKET, BY STAGES, 2020-2029 (USD MILLION)
TABLE 18 COSTA RICA GASTRIC CANCER TREATMENT MARKET, BY TREATMENT, 2020-2029 (USD MILLION)
TABLE 19 COSTA RICA CHEMOTHERAPY IN GASTRIC CANCER TREATMENT MARKET, BY TREATMENT, 2020-2029 (USD MILLION)
TABLE 20 COSTA RICA TARGETED THERAPY IN GASTRIC CANCER TREATMENT MARKET, BY TREATMENT, 2020-2029 (USD MILLION)
TABLE 21 COSTA RICA MONOCLONAL ANTIBODY THERAPY IN GASTRIC CANCER TREATMENT MARKET, BY TREATMENT, 2020-2029 (USD MILLION)
TABLE 22 COSTA RICA MULTIKINASE INHIBITORS IN GASTRIC CANCER TREATMENT MARKET, BY TREATMENT, 2020-2029 (USD MILLION)
TABLE 23 COSTA RICA GASTRIC CANCER TREATMENT MARKET, BY ROUTE OF ADMINISTRATION, 2020-2029 (USD MILLION)
TABLE 24 COSTA RICA PARENTERAL IN GASTRIC CANCER TREATMENT MARKET, BY ROUTE OF ADMINISTRATION, 2020-2029 (USD MILLION)
TABLE 25 COSTA RICA ORAL IN GASTRIC CANCER TREATMENT MARKET, BY ROUTE OF ADMINISTRATION, 2020-2029 (USD MILLION)
TABLE 26 COSTA RICA GASTRIC CANCER TREATMENT MARKET, BY END USER, 2020-2029 (USD MILLION)
TABLE 27 COSTA RICA GASTRIC CANCER TREATMENT MARKET, BY DISTRIBUTION CHANNEL, 2020-2029 (USD MILLION)
TABLE 28 PANAMA GASTRIC CANCER TREATMENT MARKET, BY TYPE, 2020-2029 (USD MILLION)
TABLE 29 PANAMA GASTRIC CANCER TREATMENT MARKET, BY STAGES, 2020-2029 (USD MILLION)
TABLE 30 PANAMA GASTRIC CANCER TREATMENT MARKET, BY TREATMENT, 2020-2029 (USD MILLION)
TABLE 31 PANAMA CHEMOTHERAPY IN GASTRIC CANCER TREATMENT MARKET, BY TREATMENT, 2020-2029 (USD MILLION)
TABLE 32 PANAMA TARGETED THERAPY IN GASTRIC CANCER TREATMENT MARKET, BY TREATMENT, 2020-2029 (USD MILLION)
TABLE 33 PANAMA MONOCLONAL ANTIBODY THERAPY IN GASTRIC CANCER TREATMENT MARKET, BY TREATMENT, 2020-2029 (USD MILLION)
TABLE 34 PANAMA MULTIKINASE INHIBITORS IN GASTRIC CANCER TREATMENT MARKET, BY TREATMENT, 2020-2029 (USD MILLION)
TABLE 35 PANAMA GASTRIC CANCER TREATMENT MARKET, BY ROUTE OF ADMINISTRATION, 2020-2029 (USD MILLION)
TABLE 36 PANAMA PARENTERAL IN GASTRIC CANCER TREATMENT MARKET, BY ROUTE OF ADMINISTRATION, 2020-2029 (USD MILLION)
TABLE 37 PANAMA ORAL IN GASTRIC CANCER TREATMENT MARKET, BY ROUTE OF ADMINISTRATION, 2020-2029 (USD MILLION)
TABLE 38 PANAMA GASTRIC CANCER TREATMENT MARKET, BY END USER, 2020-2029 (USD MILLION)
TABLE 39 PANAMA GASTRIC CANCER TREATMENT MARKET, BY DISTRIBUTION CHANNEL, 2020-2029 (USD MILLION)
TABLE 40 GUATEMALA GASTRIC CANCER TREATMENT MARKET, BY TYPE, 2020-2029 (USD MILLION)
TABLE 41 GUATEMALA GASTRIC CANCER TREATMENT MARKET, BY STAGES, 2020-2029 (USD MILLION)
TABLE 42 GUATEMALA GASTRIC CANCER TREATMENT MARKET, BY TREATMENT, 2020-2029 (USD MILLION)
TABLE 43 GUATEMALA CHEMOTHERAPY IN GASTRIC CANCER TREATMENT MARKET, BY TREATMENT, 2020-2029 (USD MILLION)
TABLE 44 GUATEMALA TARGETED THERAPY IN GASTRIC CANCER TREATMENT MARKET, BY TREATMENT, 2020-2029 (USD MILLION)
TABLE 45 GUATEMALA MONOCLONAL ANTIBODY THERAPY IN GASTRIC CANCER TREATMENT MARKET, BY TREATMENT, 2020-2029 (USD MILLION)
TABLE 46 GUATEMALA MULTIKINASE INHIBITORS IN GASTRIC CANCER TREATMENT MARKET, BY TREATMENT, 2020-2029 (USD MILLION)
TABLE 47 GUATEMALA GASTRIC CANCER TREATMENT MARKET, BY ROUTE OF ADMINISTRATION, 2020-2029 (USD MILLION)
TABLE 48 GUATEMALA PARENTERAL IN GASTRIC CANCER TREATMENT MARKET, BY ROUTE OF ADMINISTRATION, 2020-2029 (USD MILLION)
TABLE 49 GUATEMALA ORAL IN GASTRIC CANCER TREATMENT MARKET, BY ROUTE OF ADMINISTRATION, 2020-2029 (USD MILLION)
TABLE 50 GUATEMALA GASTRIC CANCER TREATMENT MARKET, BY END USER, 2020-2029 (USD MILLION)
TABLE 51 GUATEMALA GASTRIC CANCER TREATMENT MARKET, BY DISTRIBUTION CHANNEL, 2020-2029 (USD MILLION)
TABLE 52 DOMINICAN REPUBLIC GASTRIC CANCER TREATMENT MARKET, BY TYPE, 2020-2029 (USD MILLION)
TABLE 53 DOMINICAN REPUBLIC GASTRIC CANCER TREATMENT MARKET, BY STAGES, 2020-2029 (USD MILLION)
TABLE 54 DOMINICAN REPUBLIC GASTRIC CANCER TREATMENT MARKET, BY TREATMENT, 2020-2029 (USD MILLION)
TABLE 55 DOMINICAN REPUBLIC CHEMOTHERAPY IN GASTRIC CANCER TREATMENT MARKET, BY TREATMENT, 2020-2029 (USD MILLION)
TABLE 56 DOMINICAN REPUBLIC TARGETED THERAPY IN GASTRIC CANCER TREATMENT MARKET, BY TREATMENT, 2020-2029 (USD MILLION)
TABLE 57 DOMINICAN REPUBLIC MONOCLONAL ANTIBODY THERAPY IN GASTRIC CANCER TREATMENT MARKET, BY TREATMENT, 2020-2029 (USD MILLION)
TABLE 58 DOMINICAN REPUBLIC MULTIKINASE INHIBITORS IN GASTRIC CANCER TREATMENT MARKET, BY TREATMENT, 2020-2029 (USD MILLION)
TABLE 59 DOMINICAN REPUBLIC GASTRIC CANCER TREATMENT MARKET, BY ROUTE OF ADMINISTRATION, 2020-2029 (USD MILLION)
TABLE 60 DOMINICAN REPUBLIC PARENTERAL IN GASTRIC CANCER TREATMENT MARKET, BY ROUTE OF ADMINISTRATION, 2020-2029 (USD MILLION)
TABLE 61 DOMINICAN REPUBLIC ORAL IN GASTRIC CANCER TREATMENT MARKET, BY ROUTE OF ADMINISTRATION, 2020-2029 (USD MILLION)
TABLE 62 DOMINICAN REPUBLIC GASTRIC CANCER TREATMENT MARKET, BY END USER, 2020-2029 (USD MILLION)
TABLE 63 DOMINICAN REPUBLIC GASTRIC CANCER TREATMENT MARKET, BY DISTRIBUTION CHANNEL, 2020-2029 (USD MILLION)
TABLE 64 REST OF CENTRAL AMERICA GASTRIC CANCER TREATMENT MARKET, BY TYPE, 2020-2029 (USD MILLION)
List of Figure
FIGURE 1 CENTRAL AMERICA GASTRIC CANCER TREATMENT MARKET: SEGMENTATION
FIGURE 2 CENTRAL AMERICA GASTRIC CANCER TREATMENT MARKET: DATA TRIANGULATION
FIGURE 3 CENTRAL AMERICA GASTRIC CANCER TREATMENT MARKET: DROC ANALYSIS
FIGURE 4 CENTRAL AMERICA GASTRIC CANCER TREATMENT MARKET: REGIONAL VS COUNTRY MARKET ANALYSIS
FIGURE 5 CENTRAL AMERICA GASTRIC CANCER TREATMENT MARKET: COMPANY RESEARCH ANALYSIS
FIGURE 6 CENTRAL AMERICA GASTRIC CANCER TREATMENT MARKET: INTERVIEW DEMOGRAPHICS
FIGURE 7 CENTRAL AMERICA GASTRIC CANCER TREATMENT MARKET: MULTIVARIATE MODELLING
FIGURE 8 CENTRAL AMERICA GASTRIC CANCER TREATMENT MARKET: DBMR MARKET POSITION GRID
FIGURE 9 CENTRAL AMERICA GASTRIC CANCER TREATMENT MARKET: VENDOR SHARE ANALYSIS
FIGURE 10 CENTRAL AMERICA GASTRIC CANCER TREATMENT MARKET: END USER OVERAGE GRID
FIGURE 11 CENTRAL AMERICA GASTRIC CANCER TREATMENT MARKET: SEGMENTATION
FIGURE 12 INCREASING IN INCIDENCE OF GASTROINTESTINAL TUMORS, LYMPHOMA AND ADENOCARCINOMA AND HIGH PREVALENCE OF OBESITY ARE EXPECTED TO DRIVE THE CENTRAL AMERICA GASTRIC CANCER TREATMENT MARKET IN THE FORECAST PERIOD OF 2022 TO 2029
FIGURE 13 ADENOCARCINOMA SEGMENT IS EXPECTED TO ACCOUNT FOR THE LARGEST SHARE OF THE CENTRAL AMERICA GASTRIC CANCER TREATMENT MARKET IN 2022 & 2029
FIGURE 14 CONDITIONALLY RECOMMENDED REGIME
FIGURE 15 DRIVERS, RESTRAINTS, OPPORTUNITIES, AND CHALLENGES OF THE CENTRAL AMERICA GASTRIC CANCER TREATMENT MARKET
FIGURE 16 PER CAPITA EXPENSE AND HEALTHCARE EXPEDITURE (% OF GDP) OF COSTA RICA
FIGURE 17 PER CAPITA EXPENSE AND CURRENT HEALTHCARE EXPEDITURE (% OF GDP) OF GUATEMALA
FIGURE 18 PER CAPITA EXPENSE AND CURRENT HEALTHCARE EXPEDITURE (% OF GDP) OF GUATEMALA
FIGURE 19 CENTRAL AMERICA GASTRIC CANCER TREATMENT MARKET: BY TYPE, 2021
FIGURE 20 CENTRAL AMERICA GASTRIC CANCER TREATMENT MARKET: BY TYPE, 2022-2029 (USD MILLION)
FIGURE 21 CENTRAL AMERICA GASTRIC CANCER TREATMENT MARKET: BY TYPE, CAGR (2022-2029)
FIGURE 22 CENTRAL AMERICA GASTRIC CANCER TREATMENT MARKET: BY TYPE, 2020-2029, LIFELINE CURVE
FIGURE 23 CENTRAL AMERICA GASTRIC CANCER TREATMENT MARKET: BY STAGES, 2021
FIGURE 24 CENTRAL AMERICA GASTRIC CANCER TREATMENT MARKET: BY STAGES, 2022-2029 (USD MILLION)
FIGURE 25 CENTRAL AMERICA GASTRIC CANCER TREATMENT MARKET: BY STAGES, CAGR (2022-2029)
FIGURE 26 CENTRAL AMERICA GASTRIC CANCER TREATMENT MARKET: BY STAGES, LIFELINE CURVE
FIGURE 27 CENTRAL AMERICA GASTRIC CANCER TREATMENT MARKET: BY TREATMENT, 2021
FIGURE 28 CENTRAL AMERICA GASTRIC CANCER TREATMENT MARKET: BY TREATMENT, 2022-2029 (USD MILLION)
FIGURE 29 CENTRAL AMERICA GASTRIC CANCER TREATMENT MARKET: BY TREATMENT, CAGR (2022-2029)
FIGURE 30 CENTRAL AMERICA GASTRIC CANCER TREATMENT MARKET: BY TREATMENT, LIFELINE CURVE
FIGURE 31 CENTRAL AMERICA GASTRIC CANCER TREATMENT MARKET: BY ROUTE OF ADMINISTRATION, 2021
FIGURE 32 CENTRAL AMERICA GASTRIC CANCER TREATMENT MARKET: BY ROUTE OF ADMINISTRATION, 2022-2029 (USD MILLION)
FIGURE 33 CENTRAL AMERICA GASTRIC CANCER TREATMENT MARKET: BY ROUTE OF ADMINISTRATION, CAGR (2022-2029)
FIGURE 34 CENTRAL AMERICA GASTRIC CANCER TREATMENT MARKET: BY ROUTE OF ADMINISTRATION, 2020-2029, LIFELINE CURVE
FIGURE 35 CENTRAL AMERICA GASTRIC CANCER TREATMENT MARKET: BY END USER 2021
FIGURE 36 CENTRAL AMERICA GASTRIC CANCER TREATMENT MARKET: BY END USER, 2022-2029 (USD MILLION)
FIGURE 37 CENTRAL AMERICA GASTRIC CANCER TREATMENT MARKET: BY END USER, CAGR (2022-2029)
FIGURE 38 CENTRAL AMERICA GASTRIC CANCER TREATMENT MARKET: BY END USER, 2020-2029, LIFELINE CURVE
FIGURE 39 CENTRAL AMERICA GASTRIC CANCER TREATMENT MARKET: BY DISTRIBUTION CHANNEL, 2021
FIGURE 40 CENTRAL AMERICA GASTRIC CANCER TREATMENT MARKET: BY DISTRIBUTION CHANNEL, 2022-2029 (USD MILLION)
FIGURE 41 CENTRAL AMERICA GASTRIC CANCER TREATMENT MARKET: BY DISTRIBUTION CHANNEL, CAGR (2022-2029)
FIGURE 42 CENTRAL AMERICA GASTRIC CANCER TREATMENT MARKET: BY DISTRIBUTION CHANNEL, LIFELINE CURVE
FIGURE 43 CENTRAL AMERICA GASTRIC CANCER TREATMENT MARKET: SNAPSHOT (2021)
FIGURE 44 CENTRAL AMERICA GASTRIC CANCER TREATMENT MARKET: BY COUNTRY (2021)
FIGURE 45 CENTRAL AMERICA GASTRIC CANCER TREATMENT MARKET: BY COUNTRY (2022 & 2029)
FIGURE 46 CENTRAL AMERICA GASTRIC CANCER TREATMENT MARKET: BY COUNTRY (2021 & 2029)
FIGURE 47 CENTRAL AMERICA GASTRIC CANCER TREATMENT MARKET: BY TYPE (2022-2029)
FIGURE 48 CENTRAL AMERICA GASTRIC CANCER TREATMENT MARKET: COMPANY SHARE 2021 (%)

Research Methodology
Data collection and base year analysis are done using data collection modules with large sample sizes. The stage includes obtaining market information or related data through various sources and strategies. It includes examining and planning all the data acquired from the past in advance. It likewise envelops the examination of information inconsistencies seen across different information sources. The market data is analysed and estimated using market statistical and coherent models. Also, market share analysis and key trend analysis are the major success factors in the market report. To know more, please request an analyst call or drop down your inquiry.
The key research methodology used by DBMR research team is data triangulation which involves data mining, analysis of the impact of data variables on the market and primary (industry expert) validation. Data models include Vendor Positioning Grid, Market Time Line Analysis, Market Overview and Guide, Company Positioning Grid, Patent Analysis, Pricing Analysis, Company Market Share Analysis, Standards of Measurement, Global versus Regional and Vendor Share Analysis. To know more about the research methodology, drop in an inquiry to speak to our industry experts.
Customization Available
Data Bridge Market Research is a leader in advanced formative research. We take pride in servicing our existing and new customers with data and analysis that match and suits their goal. The report can be customized to include price trend analysis of target brands understanding the market for additional countries (ask for the list of countries), clinical trial results data, literature review, refurbished market and product base analysis. Market analysis of target competitors can be analyzed from technology-based analysis to market portfolio strategies. We can add as many competitors that you require data about in the format and data style you are looking for. Our team of analysts can also provide you data in crude raw excel files pivot tables (Fact book) or can assist you in creating presentations from the data sets available in the report.
