
Asia Pacific Powder Sulfur Market
Market Size in USD Thousand
CAGR :
% 
 USD
422,922.18 Thousand
USD
559,699.00 Thousand
2022
2030
USD
422,922.18 Thousand
USD
559,699.00 Thousand
2022
2030
| 2023 –2030 | |
| USD 422,922.18 Thousand | |
| USD 559,699.00 Thousand | |
| % | |
Asia-Pacific Powder Sulfur Market Analysis and Size
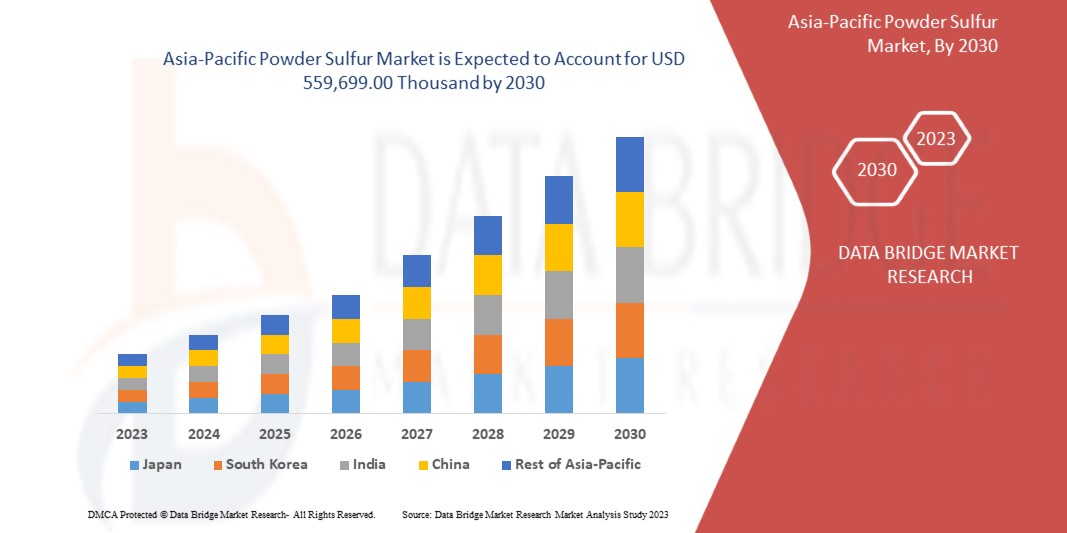
Data Bridge Market Research analyzes that the Asia-Pacific powder sulfur market is expected to reach USD 559,699.00 thousand by 2030 from USD 422,922.18 thousand in 2022, growing with a substantial CAGR of 3.6% in the forecast period of 2023 to 2030.
A positive outlook toward the agriculture industry and the gaining acceptance as a dermatological ingredient in the pharma sector are some of the driving factors expected to drive market growth. However, hazardous issues associated with the chemical nature of powder sulfur and the availability of substitutes in some of the application segments are expected to restrain the market growth. The rising R&D spending in EV (Electric Vehicle) and renewable energy segments are expected to provide opportunities for market growth. However, the implementation of rules and regulations aimed at preventing the usage of chemical storage is expected to challenge market growth.
The Asia-Pacific powder sulfur market report provides details of market share, new developments, and the impact of domestic and localized market players, analyzes opportunities in terms of emerging revenue pockets, changes in market regulations, products approvals, strategic decisions, product launches, geographic expansions, and technological innovations in the market. To understand the analysis and the market scenario, contact us for an analyst brief. Our team will help you create a revenue-impact solution to achieve your desired goal.
|
Report Metric |
Details |
|
Forecast Period |
2023 to 2030 |
|
Base Year |
2022 |
|
Historic Year |
2021 (Customizable to 2015 - 2020) |
|
Quantitative Units |
Revenue in USD Thousand |
|
Segments Covered |
Grade (Agricultural Grade, Rubber Grade, Industrial Grade, Pharma Grade, Food Grade, and Others), Product (Non-Oil Filled Powder Sulfur and Oil-Filled Powder Sulfur), Fineness (200 Mesh, 300 Mesh, 325 Mesh, 400 Mesh, 500 Mesh, and Others) |
|
Countries Covered |
China, Japan, India, South Korea, Australia & New Zealand, Thailand, Singapore, Philippines, Malaysia, Indonesia, Rest of Asia-Pacific |
|
Market Players Covered |
Grupa Azoty, Kaycee Chem Industries, M. K. CHEMICAL INDUSTRIES, Jordan Sulphur, Golden Chemicals, Sulphur., J K Industries, Solar Chemferts Pvt Ltd, American Elements, JAINSON CHEMICALS, and Jaishil Sulphur & Chemical Industries among others |
Market Definition
Powder sulfur refers to a finely ground form of elemental sulfur, commonly used in various industries and applications. It is characterized by its powdered consistency, typically composed of small particles with a high degree of purity. It serves as a key ingredient in the production of fertilizers, pesticides, and fungicides and in the manufacturing of chemicals and pharmaceuticals. Its versatile nature allows it to be used as an additive in industrial processes, such as rubber vulcanization and metallurgical applications. It plays a vital role in diverse sectors due to its unique chemical properties and wide-ranging industrial utility.
Asia-Pacific Powder Sulfur Market Dynamics
Drivers
- Positive Outlook Towards Agriculture Industry
Sulfur stands out in agriculture for many uses such as crop protection as a phytosanitary product, fungicidal and acaricidal properties, and the potential it offers as an agro nutrient due to its potential as a fertilizer and natural biostimulant. This is because sulfur encourages plants to produce essential amino acids such as cysteine, cystine, and methionine on their own, strengthening their natural defenses against fungi.
The sulfur powder will benefit all plants if soil sulfur levels are low as sulfur is required for plant growth. Some veggies, such as onion, garlic, and mustard, require sulfur to become more flavorful. As a result, the agricultural sector will benefit significantly, which is expected to drive market growth because it is the most effective ingredient for outstanding crop growth.
- Favorable Scenario in Automotive Sector
The tire industry is one of the most important vehicle components in the automobile market. The tire and tube, which are essential components of automobile vehicles, are critical to a country's economy. Tires are used by passenger vehicles, commercial vehicles, big trucks, light trucks, and other types of vehicles.
Tire sales, demand, and production are all generally on the rise globally as a result. There is consequently a rising demand for effective tires. To increase elasticity, strength, and durability, it is added to both natural and synthetic rubber. Crosslinks are created by sulfur and rubber molecules, giving rubber its distinctive characteristics. These factors make it a necessary raw material in the production of tires. Sulfur powder is consequently heavily utilized in the manufacture of tires. Moreover, tires have the potential to be a significant driver for market growth due to their increasing demand, production, and sales.
Opportunity
- Supportive Outlook Towards Chemical Processing in Around the Globe
Chemicals such as sulfuric acid, sulfites, and sulfur dioxide are all produced using sulfur powder. The manufacturing of paper, water filtration, and metal processing are just a few industrial uses for these compounds. The production of explosives such as TNT (Trinitrotoluene) and fuel oil containing ammonium nitrate also uses it as a component. It gives the explosive mixture the essential amount of sulfur it needs while also assisting in keeping the reaction stable. Sulfur powder is sometimes used in water purification to eliminate contaminants and to prevent the growth of bacteria and algae in water systems, as well as a bleaching agent in the manufacturing of paper, wool, and silk. In addition, it is used in the production of several types of soap and detergents
The use of chemicals processed from sulfur powder has been in many industries such as water treatment, fireworks, and construction among others. Furthermore, it is expected that the different uses of chemicals in various industries will present prospects for the industry.
Restraints/Challenges
- Credible Threat of Substitutes in Some of the Application Segments
Powdered sulfur plays various roles in the production of different products in different segments such as automotive, agricultural, pharmaceuticals, and others. The multi-segment role can have both positive and negative impacts on the overall market as each application segment may have various substitutes which can effectively overturn the usage of powdered sulfur.
From the above instances, it is understandable that there are many substitute chemical compounds established already that can be used as substitutes for powdered sulfur. Hence, the availability of these substitutes is expected to restrain market growth.
- Implementation of Rules and Regulations Aimed at Preventing the Usage of Chemical Usage
Increasing concern about the use of hazardous chemicals in its manufacturing process has led to strict rules and regulations being applied to the powdered sulfur sector. These guidelines and laws cover the use of chemicals involved in the production of sulfur itself as well as the usage of sulfur in the production of other products. Thus, stringent regulations are expected to restrain market growth.
The restriction to use certain materials, chemicals, and production process makes the company invest more in new R&D methods and materials, production schemes, technology, and equipment to meet the requirements of the regulation, which in turn, will have an impact on the product cost and availability which ultimately affect the market. On the other hand, the true purpose of these rules and regulations is to emphasize sustainability and innovation, and collaboration among various companies for long-term viability and delivering harmless products to the customer. So, manufacturers should take these regulations as a challenge and take the required steps to overcome and stand alone among the other manufacturers.
Asia-Pacific Powder Sulfur Market Scope
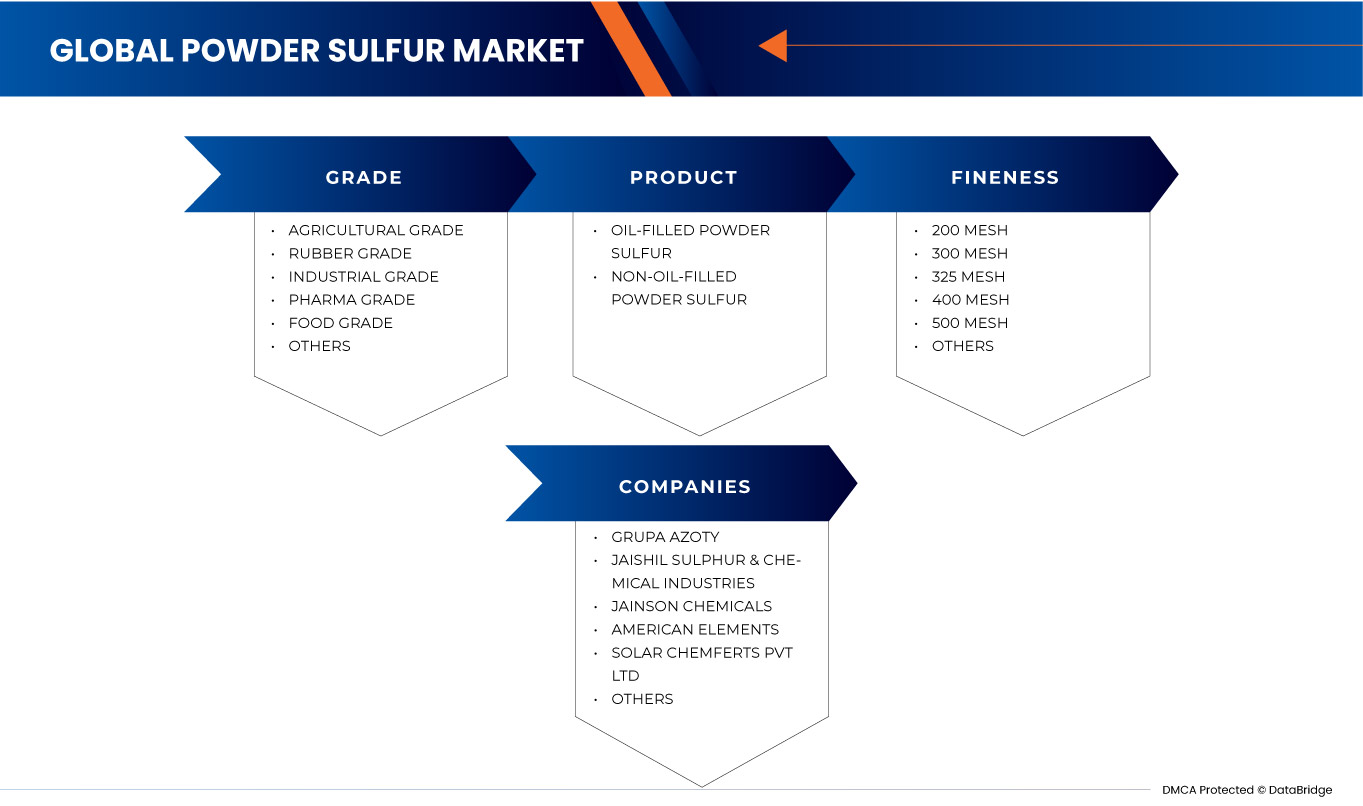
The Asia-Pacific powder sulfur market is segmented into three notable segments based on grade, product, and fineness. The growth amongst these segments will help you analyze major growth segments in the industries and provide the users with a valuable market overview and market insights to make strategic decisions to identify core market applications.
Grade
- Agricultural Grade
- Rubber Grade
- Industrial Grade
- Pharma Grade
- Food Grade
- Others
On the basis of grade, the Asia-Pacific powder sulfur market is segmented into agricultural grade, rubber grade, industrial grade, pharma grade, food grade, and others.
Product
- Oil-Filled Powder Sulfur
- Non-Oil Filled Powder Sulfur
On the basis of product, the Asia-Pacific powder sulfur market is segmented into oil-filled powder sulfur and non-oil filled powder sulfur.
Fineness
- 200 Mesh
- 300 Mesh
- 325 Mesh
- 400 Mesh
- 500 Mesh
- Others
On the basis of fineness, the Asia-Pacific powder sulfur market is segmented into 200 mesh, 300 mesh, 325 mesh, 400 mesh, 500 mesh, and others.
Asia-Pacific Powder Sulfur Market Regional Analysis/Insights
The Asia-Pacific powder sulfur market is segmented into three notable segments based on grade, product, and fineness.
The countries covered in this market report are China, Japan, India, South Korea, Australia & New Zealand, Thailand, Singapore, Philippines, Malaysia, Indonesia, Rest of Asia-Pacific.
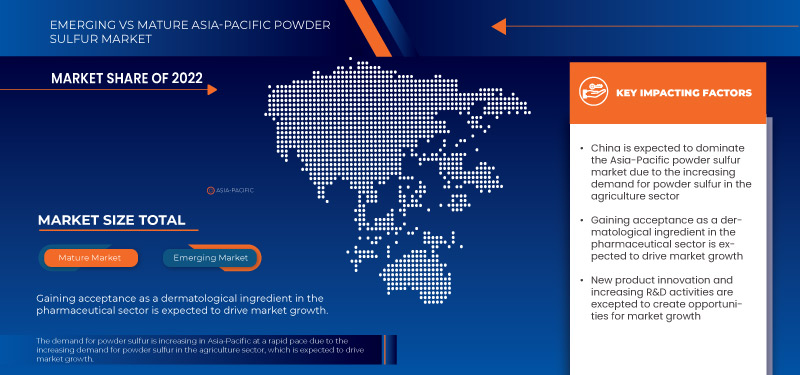
China is expected to dominate the Asia-Pacific powder sulfur market due to the increasing demand for powder sulfur in the agriculture sector.
The country section of the report also provides individual market-impacting factors and changes in market regulation that impact the current and future trends of the market. Data point downstream and upstream value chain analysis, technical trends, Porter's five forces analysis, and case studies are some of the pointers used to forecast the market scenario for individual countries. Also, the presence and availability of regional brands and their challenges faced due to large or scarce competition from local and domestic brands, the impact of domestic tariffs, and trade routes are considered while providing forecast analysis of the country data.
Competitive Landscape and Asia-Pacific Powder Sulfur Market Share Analysis
The Asia-Pacific powder sulfur market competitive landscape provides details of competitors. Details included are company overview, company financials, revenue generated, market potential, investment in research and development, new market initiatives, production sites and facilities, company strengths and weaknesses, product launch, product trials pipelines, product approvals, patents, product width and breadth, application dominance, and technology lifeline curve. The above data points provided are only related to the companies’ focus related to the market.
Some of the major market players operating in the Asia-Pacific powder sulfur market are Grupa Azoty, Kaycee Chem Industries, M. K. CHEMICAL INDUSTRIES, Jordan Sulphur, Golden Chemicals, Sulphur., J K Industries, Solar Chemferts Pvt Ltd, American Elements, JAINSON CHEMICALS, and Jaishil Sulphur & Chemical Industries among others.
SKU-
Get online access to the report on the World's First Market Intelligence Cloud

- Interactive Data Analysis Dashboard
- Company Analysis Dashboard for high growth potential opportunities
- Research Analyst Access for customization & queries
- Competitor Analysis with Interactive dashboard
- Latest News, Updates & Trend analysis
- Harness the Power of Benchmark Analysis for Comprehensive Competitor Tracking
Table of Content
1 INTRODUCTION
1.1 OBJECTIVES OF THE STUDY
1.2 MARKET DEFINITION
1.3 OVERVIEW
1.4 LIMITATIONS
1.5 MARKETS COVERED
2 MARKET SEGMENTATION
2.1 MARKETS COVERED
2.2 GEOGRAPHICAL SCOPE
2.3 YEARS CONSIDERED FOR THE STUDY
2.4 CURRENCY AND PRICING
2.5 DBMR TRIPOD DATA VALIDATION MODEL
2.6 PRODUCT LIFELINE CURVE
2.7 MULTIVARIATE MODELING
2.8 PRIMARY INTERVIEWS WITH KEY OPINION LEADERS
2.9 DBMR MARKET POSITION GRID
2.1 DBMR MARKET CHALLENGE MATRIX
2.11 DBMR VENDOR SHARE ANALYSIS
2.12 SECONDARY SOURCES
2.13 ASSUMPTIONS
3 EXECUTIVE SUMMARY
4 PREMIUM INSIGHTS
4.1 PESTLE ANALYSIS
4.1.1 POLITICAL FACTORS
4.1.2 ECONOMIC FACTORS
4.1.3 SOCIAL FACTORS
4.1.4 TECHNOLOGICAL FACTORS
4.1.5 LEGAL FACTORS
4.1.6 ENVIRONMENTAL FACTORS
4.2 PORTER’S FIVE FORCES
4.2.1 THREAT OF NEW ENTRANTS
4.2.2 THREAT OF SUBSTITUTES
4.2.3 CUSTOMER BARGAINING POWER
4.2.4 SUPPLIER BARGAINING POWER
4.2.5 INTERNAL COMPETITION (RIVALRY)
4.3 CLIMATE CHANGE SCENARIO
4.3.1 ENVIRONMENTAL CONCERNS
4.3.2 INDUSTRY RESPONSE
4.3.3 GOVERNMENT’S ROLE
4.3.4 ANALYST RECOMMENDATION
4.4 IMPORT-EXPORT SCENARIO
4.5 PRICE ANALYSIS
4.6 PRODUCTION CONSUMPTION ANALYSIS
4.7 PRODUCTION CAPACITY OVERVIEW
4.8 SUPPLY CHAIN ANALYSIS
4.8.1 OVERVIEW
4.8.2 LOGISTICS COST SCENARIO
4.8.3 IMPORTANCE OF LOGISTICS SERVICE PROVIDERS
4.9 TECHNOLOGICAL ADVANCEMENTS BY MANUFACTURERS
4.1 VENDOR SELECTION CRITERIA
5 REGULATION COVERAGE
6 MARKET OVERVIEW
6.1 DRIVERS
6.1.1 POSITIVE OUTLOOK TOWARDS AGRICULTURE INDUSTRY
6.1.2 FAVORABLE SCENARIO IN THE AUTOMOTIVE SECTOR
6.1.3 GAINING ACCEPTANCE AS A DERMATOLOGICAL INGREDIENT IN PHARMA SECTOR
6.2 RESTRAINTS
6.2.1 CREDIBLE THREAT OF SUBSTITUTES IN SOME OF THE APPLICATION SEGMENTS
6.2.2 HAZARDOUS ISSUES ASSOCIATED WITH THE CHEMICAL NATURE OF POWDERED SULFUR
6.3 OPPORTUNITIES
6.3.1 SUPPORTIVE OUTLOOK TOWARD CHEMICAL PROCESSING AROUND THE GLOBE
6.3.2 RISING R&D SPENDING IN EV AND RENEWABLE ENERGY SEGMENTS
6.4 CHALLENGES
6.4.1 IMPLEMENTATION OF RULES AND REGULATIONS AIMED AT PREVENTING THE USAGE OF CHEMICAL USAGE
6.4.2 FLUCTUATING DEMAND-SUPPLY DYNAMICS OF SULFUR
7 ASIA PACIFIC POWDER SULFUR MARKET, BY REGION
7.1 ASIA-PACIFIC
7.1.1 CHINA
7.1.2 INDIA
7.1.3 INDONESIA
7.1.4 JAPAN
7.1.5 SOUTH KOREA
7.1.6 THAILAND
7.1.7 MALAYSIA
7.1.8 AUSTRALIA & NEW ZEALAND
7.1.9 SINGAPORE
7.1.10 PHILIPPINES
7.1.11 REST OF ASIA-PACIFIC
8 ASIA PACIFIC POWDER SULFUR MARKET: COMPANY LANDSCAPE
8.1 COMPANY SHARE ANALYSIS: ASIA PACIFIC
9 COMPANY PROFILES
9.1 GRUPA AZOTY
9.1.1 COMPANY SNAPSHOT
9.1.2 REVENUE ANALYSIS
9.1.3 SWOT ANALYSIS
9.1.4 COMPANY SHARE ANALYSIS
9.1.5 PRODUCT PORTFOLIO
9.1.6 RECENT DEVELOPMENTS
9.2 JAISHIL SULPHUR & CHEMICAL INDUSTRIES
9.2.1 COMPANY SNAPSHOT
9.2.2 SWOT
9.2.3 COMPANY SHARE ANALYSIS
9.2.4 PRODUCT PORTFOLIO
9.2.5 RECENT DEVELOPMENTS
9.3 JAINSON CHEMICALS
9.3.1 COMPANY SNAPSHOT
9.3.2 SWOT
9.3.3 COMPANY SHARE ANALYSIS
9.3.4 PRODUCT PORTFOLIO
9.3.5 RECENT DEVELOPMENTS
9.4 AMERICAN ELEMENTS
9.4.1 COMPANY SNAPSHOT
9.4.2 SWOT ANALYSIS
9.4.3 COMPANY SHARE ANALYSIS
9.4.4 PRODUCT PORTFOLIO
9.4.5 RECENT DEVELOPMENTS
9.5 SOLAR CHEMFERTS PVT LTD
9.5.1 COMPANY SNAPSHOT
9.5.2 SWOT ANALYSIS
9.5.3 COMPANY SHARE ANALYSIS
9.5.4 PRODUCT PORTFOLIO
9.5.5 RECENT DEVELOPMENTS
9.6 GOLDEN CHEMICALS
9.6.1 COMPANY SNAPSHOT
9.6.2 SWOT
9.6.3 PRODUCT PORTFOLIO
9.6.4 RECENT DEVELOPMENTS
9.7 J K INDUSTRIES
9.7.1 COMPANY SNAPSHOT
9.7.2 SWOT
9.7.3 PRODUCT PORTFOLIO
9.7.4 RECENT DEVELOPMENTS
9.8 JORDAN SULPHUR
9.8.1 COMPANY SNAPSHOT
9.8.2 SWOT ANALYSIS
9.8.3 PRODUCT PORTFOLIO
9.8.4 RECENT DEVELOPMENT
9.9 KAYCEE CHEM INDUSTRIES
9.9.1 COMPANY SNAPSHOT
9.9.2 SWOT
9.9.3 PRODUCT PORTFOLIO
9.9.4 RECENT DEVELOPMENTS
9.1 M. K. CHEMICAL INDUSTRIES
9.10.1 COMPANY SNAPSHOT
9.10.2 SWOT
9.10.3 PRODUCT PORTFOLIO
9.10.4 RECENT DEVELOPMENTS
9.11 SULPHUR.
9.11.1 COMPANY SNAPSHOT
9.11.2 SWOT ANALYSIS
9.11.3 PRODUCT PORTFOLIO
9.11.4 RECENT DEVELOPMENTS
10 QUESTIONNAIRE
11 RELATED REPORTS
List of Table
TABLE 1 REGULATORY COVERAGE
TABLE 2 ASIA-PACIFIC POWDER SULFUR MARKET, BY COUNTRY, 2021-2030 (USD THOUSAND)
TABLE 3 ASIA-PACIFIC POWDER SULFUR MARKET, BY COUNTRY, 2021-2030 (TONS)
TABLE 4 ASIA-PACIFIC POWDER SULFUR MARKET, BY GRADE, 2021-2030 (USD THOUSAND)
TABLE 5 ASIA-PACIFIC POWDER SULFUR MARKET, BY GRADE, 2021-2030 (TONS)
TABLE 6 ASIA-PACIFIC AGRICULTURAL GRADE IN POWDER SULFUR MARKET, BY PRODUCT, 2021-2030 (USD THOUSAND)
TABLE 7 ASIA-PACIFIC RUBBER GRADE IN POWDER SULFUR MARKET, BY PRODUCT, 2021-2030 (USD THOUSAND)
TABLE 8 ASIA-PACIFIC RUBBER GRADE IN POWDER SULFUR MARKET, BY TYPE, 2021-2030 (USD THOUSAND)
TABLE 9 ASIA-PACIFIC INDUSTRIAL GRADE IN POWDER SULFUR MARKET, BY PRODUCT, 2021-2030 (USD THOUSAND)
TABLE 10 ASIA-PACIFIC PHARMA GRADE IN POWDER SULFUR MARKET, BY PRODUCT, 2021-2030 (USD THOUSAND)
TABLE 11 ASIA-PACIFIC FOOD GRADE IN POWDER SULFUR MARKET, BY PRODUCT, 2021-2030 (USD THOUSAND)
TABLE 12 ASIA-PACIFIC OTHERS IN POWDER SULFUR MARKET, BY PRODUCT, 2021-2030 (USD THOUSAND)
TABLE 13 ASIA-PACIFIC POWDER SULFUR MARKET, BY PRODUCT, 2021-2030 (USD THOUSAND)
TABLE 14 ASIA-PACIFIC POWDER SULFUR MARKET, BY PRODUCT, 2021-2030 (TONS)
TABLE 15 ASIA-PACIFIC POWDER SULFUR MARKET, BY FINENESS, 2021-2030 (USD THOUSAND)
TABLE 16 ASIA-PACIFIC POWDER SULFUR MARKET, BY FINENESS, 2021-2030 (TONS)
TABLE 17 CHINA POWDER SULFUR MARKET, BY GRADE, 2021-2030 (USD THOUSAND)
TABLE 18 CHINA POWDER SULFUR MARKET, BY GRADE, 2021-2030 (TONS)
TABLE 19 CHINA AGRICULTURAL GRADE IN POWDER SULFUR MARKET, BY PRODUCT, 2021-2030 (USD THOUSAND)
TABLE 20 CHINA RUBBER GRADE IN POWDER SULFUR MARKET, BY PRODUCT, 2021-2030 (USD THOUSAND)
TABLE 21 CHINA RUBBER GRADE IN POWDER SULFUR MARKET, BY TYPE, 2021-2030 (USD THOUSAND)
TABLE 22 CHINA INDUSTRIAL GRADE IN POWDER SULFUR MARKET, BY PRODUCT, 2021-2030 (USD THOUSAND)
TABLE 23 CHINA PHARMA GRADE IN POWDER SULFUR MARKET, BY PRODUCT, 2021-2030 (USD THOUSAND)
TABLE 24 CHINA FOOD GRADE IN POWDER SULFUR MARKET, BY PRODUCT, 2021-2030 (USD THOUSAND)
TABLE 25 CHINA OTHERS IN POWDER SULFUR MARKET, BY PRODUCT, 2021-2030 (USD THOUSAND)
TABLE 26 CHINA POWDER SULFUR MARKET, BY PRODUCT, 2021-2030 (USD THOUSAND)
TABLE 27 CHINA POWDER SULFUR MARKET, BY PRODUCT, 2021-2030 (TONS)
TABLE 28 CHINA POWDER SULFUR MARKET, BY FINENESS, 2021-2030 (USD THOUSAND)
TABLE 29 CHINA POWDER SULFUR MARKET, BY FINENESS, 2021-2030 (TONS)
TABLE 30 INDIA POWDER SULFUR MARKET, BY GRADE, 2021-2030 (USD THOUSAND)
TABLE 31 INDIA POWDER SULFUR MARKET, BY GRADE, 2021-2030 (TONS)
TABLE 32 INDIA AGRICULTURAL GRADE IN POWDER SULFUR MARKET, BY PRODUCT, 2021-2030 (USD THOUSAND)
TABLE 33 INDIA RUBBER GRADE IN POWDER SULFUR MARKET, BY PRODUCT, 2021-2030 (USD THOUSAND)
TABLE 34 INDIA RUBBER GRADE IN POWDER SULFUR MARKET, BY TYPE, 2021-2030 (USD THOUSAND)
TABLE 35 INDIA INDUSTRIAL GRADE IN POWDER SULFUR MARKET, BY PRODUCT, 2021-2030 (USD THOUSAND)
TABLE 36 INDIA PHARMA GRADE IN POWDER SULFUR MARKET, BY PRODUCT, 2021-2030 (USD THOUSAND)
TABLE 37 INDIA FOOD GRADE IN POWDER SULFUR MARKET, BY PRODUCT, 2021-2030 (USD THOUSAND)
TABLE 38 INDIA OTHERS IN POWDER SULFUR MARKET, BY PRODUCT, 2021-2030 (USD THOUSAND)
TABLE 39 INDIA POWDER SULFUR MARKET, BY PRODUCT, 2021-2030 (USD THOUSAND)
TABLE 40 INDIA POWDER SULFUR MARKET, BY PRODUCT, 2021-2030 (TONS)
TABLE 41 INDIA POWDER SULFUR MARKET, BY FINENESS, 2021-2030 (USD THOUSAND)
TABLE 42 INDIA POWDER SULFUR MARKET, BY FINENESS, 2021-2030 (TONS)
TABLE 43 INDONESIA POWDER SULFUR MARKET, BY GRADE, 2021-2030 (USD THOUSAND)
TABLE 44 INDONESIA POWDER SULFUR MARKET, BY GRADE, 2021-2030 (TONS)
TABLE 45 INDONESIA AGRICULTURAL GRADE IN POWDER SULFUR MARKET, BY PRODUCT, 2021-2030 (USD THOUSAND)
TABLE 46 INDONESIA RUBBER GRADE IN POWDER SULFUR MARKET, BY PRODUCT, 2021-2030 (USD THOUSAND)
TABLE 47 INDONESIA RUBBER GRADE IN POWDER SULFUR MARKET, BY TYPE, 2021-2030 (USD THOUSAND)
TABLE 48 INDONESIA INDUSTRIAL GRADE IN POWDER SULFUR MARKET, BY PRODUCT, 2021-2030 (USD THOUSAND)
TABLE 49 INDONESIA PHARMA GRADE IN POWDER SULFUR MARKET, BY PRODUCT, 2021-2030 (USD THOUSAND)
TABLE 50 INDONESIA FOOD GRADE IN POWDER SULFUR MARKET, BY PRODUCT, 2021-2030 (USD THOUSAND)
TABLE 51 INDONESIA OTHERS IN POWDER SULFUR MARKET, BY PRODUCT, 2021-2030 (USD THOUSAND)
TABLE 52 INDONESIA POWDER SULFUR MARKET, BY PRODUCT, 2021-2030 (USD THOUSAND)
TABLE 53 INDONESIA POWDER SULFUR MARKET, BY PRODUCT, 2021-2030 (TONS)
TABLE 54 INDONESIA POWDER SULFUR MARKET, BY FINENESS, 2021-2030 (USD THOUSAND)
TABLE 55 INDONESIA POWDER SULFUR MARKET, BY FINENESS, 2021-2030 (TONS)
TABLE 56 JAPAN POWDER SULFUR MARKET, BY GRADE, 2021-2030 (USD THOUSAND)
TABLE 57 JAPAN POWDER SULFUR MARKET, BY GRADE, 2021-2030 (TONS)
TABLE 58 JAPAN AGRICULTURAL GRADE IN POWDER SULFUR MARKET, BY PRODUCT, 2021-2030 (USD THOUSAND)
TABLE 59 JAPAN RUBBER GRADE IN POWDER SULFUR MARKET, BY PRODUCT, 2021-2030 (USD THOUSAND)
TABLE 60 JAPAN RUBBER GRADE IN POWDER SULFUR MARKET, BY TYPE, 2021-2030 (USD THOUSAND)
TABLE 61 JAPAN INDUSTRIAL GRADE IN POWDER SULFUR MARKET, BY PRODUCT, 2021-2030 (USD THOUSAND)
TABLE 62 JAPAN PHARMA GRADE IN POWDER SULFUR MARKET, BY PRODUCT, 2021-2030 (USD THOUSAND)
TABLE 63 JAPAN FOOD GRADE IN POWDER SULFUR MARKET, BY PRODUCT, 2021-2030 (USD THOUSAND)
TABLE 64 JAPAN OTHERS IN POWDER SULFUR MARKET, BY PRODUCT, 2021-2030 (USD THOUSAND)
TABLE 65 JAPAN POWDER SULFUR MARKET, BY PRODUCT, 2021-2030 (USD THOUSAND)
TABLE 66 JAPAN POWDER SULFUR MARKET, BY PRODUCT, 2021-2030 (TONS)
TABLE 67 JAPAN POWDER SULFUR MARKET, BY FINENESS, 2021-2030 (USD THOUSAND)
TABLE 68 JAPAN POWDER SULFUR MARKET, BY FINENESS, 2021-2030 (TONS)
TABLE 69 SOUTH KOREA POWDER SULFUR MARKET, BY GRADE, 2021-2030 (USD THOUSAND)
TABLE 70 SOUTH KOREA POWDER SULFUR MARKET, BY GRADE, 2021-2030 (TONS)
TABLE 71 SOUTH KOREA AGRICULTURAL GRADE IN POWDER SULFUR MARKET, BY PRODUCT, 2021-2030 (USD THOUSAND)
TABLE 72 SOUTH KOREA RUBBER GRADE IN POWDER SULFUR MARKET, BY PRODUCT, 2021-2030 (USD THOUSAND)
TABLE 73 SOUTH KOREA RUBBER GRADE IN POWDER SULFUR MARKET, BY TYPE, 2021-2030 (USD THOUSAND)
TABLE 74 SOUTH KOREA INDUSTRIAL GRADE IN POWDER SULFUR MARKET, BY PRODUCT, 2021-2030 (USD THOUSAND)
TABLE 75 SOUTH KOREA PHARMA GRADE IN POWDER SULFUR MARKET, BY PRODUCT, 2021-2030 (USD THOUSAND)
TABLE 76 SOUTH KOREA FOOD GRADE IN POWDER SULFUR MARKET, BY PRODUCT, 2021-2030 (USD THOUSAND)
TABLE 77 SOUTH KOREA OTHERS IN POWDER SULFUR MARKET, BY PRODUCT, 2021-2030 (USD THOUSAND)
TABLE 78 SOUTH KOREA POWDER SULFUR MARKET, BY PRODUCT, 2021-2030 (USD THOUSAND)
TABLE 79 SOUTH KOREA POWDER SULFUR MARKET, BY PRODUCT, 2021-2030 (TONS)
TABLE 80 SOUTH KOREA POWDER SULFUR MARKET, BY FINENESS, 2021-2030 (USD THOUSAND)
TABLE 81 SOUTH KOREA POWDER SULFUR MARKET, BY FINENESS, 2021-2030 (TONS)
TABLE 82 THAILAND POWDER SULFUR MARKET, BY GRADE, 2021-2030 (USD THOUSAND)
TABLE 83 THAILAND POWDER SULFUR MARKET, BY GRADE, 2021-2030 (TONS)
TABLE 84 THAILAND AGRICULTURAL GRADE IN POWDER SULFUR MARKET, BY PRODUCT, 2021-2030 (USD THOUSAND)
TABLE 85 THAILAND RUBBER GRADE IN POWDER SULFUR MARKET, BY PRODUCT, 2021-2030 (USD THOUSAND)
TABLE 86 THAILAND RUBBER GRADE IN POWDER SULFUR MARKET, BY TYPE, 2021-2030 (USD THOUSAND)
TABLE 87 THAILAND INDUSTRIAL GRADE IN POWDER SULFUR MARKET, BY PRODUCT, 2021-2030 (USD THOUSAND)
TABLE 88 THAILAND PHARMA GRADE IN POWDER SULFUR MARKET, BY PRODUCT, 2021-2030 (USD THOUSAND)
TABLE 89 THAILAND FOOD GRADE IN POWDER SULFUR MARKET, BY PRODUCT, 2021-2030 (USD THOUSAND)
TABLE 90 THAILAND OTHERS IN POWDER SULFUR MARKET, BY PRODUCT, 2021-2030 (USD THOUSAND)
TABLE 91 THAILAND POWDER SULFUR MARKET, BY PRODUCT, 2021-2030 (USD THOUSAND)
TABLE 92 THAILAND POWDER SULFUR MARKET, BY PRODUCT, 2021-2030 (TONS)
TABLE 93 THAILAND POWDER SULFUR MARKET, BY FINENESS, 2021-2030 (USD THOUSAND)
TABLE 94 THAILAND POWDER SULFUR MARKET, BY FINENESS, 2021-2030 (TONS)
TABLE 95 MALAYSIA POWDER SULFUR MARKET, BY GRADE, 2021-2030 (USD THOUSAND)
TABLE 96 MALAYSIA POWDER SULFUR MARKET, BY GRADE, 2021-2030 (TONS)
TABLE 97 MALAYSIA AGRICULTURAL GRADE IN POWDER SULFUR MARKET, BY PRODUCT, 2021-2030 (USD THOUSAND)
TABLE 98 MALAYSIA RUBBER GRADE IN POWDER SULFUR MARKET, BY PRODUCT, 2021-2030 (USD THOUSAND)
TABLE 99 MALAYSIA RUBBER GRADE IN POWDER SULFUR MARKET, BY TYPE, 2021-2030 (USD THOUSAND)
TABLE 100 MALAYSIA INDUSTRIAL GRADE IN POWDER SULFUR MARKET, BY PRODUCT, 2021-2030 (USD THOUSAND)
TABLE 101 MALAYSIA PHARMA GRADE IN POWDER SULFUR MARKET, BY PRODUCT, 2021-2030 (USD THOUSAND)
TABLE 102 MALAYSIA FOOD GRADE IN POWDER SULFUR MARKET, BY PRODUCT, 2021-2030 (USD THOUSAND)
TABLE 103 MALAYSIA OTHERS IN POWDER SULFUR MARKET, BY PRODUCT, 2021-2030 (USD THOUSAND)
TABLE 104 MALAYSIA POWDER SULFUR MARKET, BY PRODUCT, 2021-2030 (USD THOUSAND)
TABLE 105 MALAYSIA POWDER SULFUR MARKET, BY PRODUCT, 2021-2030 (TONS)
TABLE 106 MALAYSIA POWDER SULFUR MARKET, BY FINENESS, 2021-2030 (USD THOUSAND)
TABLE 107 MALAYSIA POWDER SULFUR MARKET, BY FINENESS, 2021-2030 (TONS)
TABLE 108 AUSTRALIA & NEW ZEALAND POWDER SULFUR MARKET, BY GRADE, 2021-2030 (USD THOUSAND)
TABLE 109 AUSTRALIA & NEW ZEALAND POWDER SULFUR MARKET, BY GRADE, 2021-2030 (TONS)
TABLE 110 AUSTRALIA & NEW ZEALAND AGRICULTURAL GRADE IN POWDER SULFUR MARKET, BY PRODUCT, 2021-2030 (USD THOUSAND)
TABLE 111 AUSTRALIA & NEW ZEALAND RUBBER GRADE IN POWDER SULFUR MARKET, BY PRODUCT, 2021-2030 (USD THOUSAND)
TABLE 112 AUSTRALIA & NEW ZEALAND RUBBER GRADE IN POWDER SULFUR MARKET, BY TYPE, 2021-2030 (USD THOUSAND)
TABLE 113 AUSTRALIA & NEW ZEALAND INDUSTRIAL GRADE IN POWDER SULFUR MARKET, BY PRODUCT, 2021-2030 (USD THOUSAND)
TABLE 114 AUSTRALIA & NEW ZEALAND PHARMA GRADE IN POWDER SULFUR MARKET, BY PRODUCT, 2021-2030 (USD THOUSAND)
TABLE 115 AUSTRALIA & NEW ZEALAND FOOD GRADE IN POWDER SULFUR MARKET, BY PRODUCT, 2021-2030 (USD THOUSAND)
TABLE 116 AUSTRALIA & NEW ZEALAND OTHERS IN POWDER SULFUR MARKET, BY PRODUCT, 2021-2030 (USD THOUSAND)
TABLE 117 AUSTRALIA & NEW ZEALAND POWDER SULFUR MARKET, BY PRODUCT, 2021-2030 (USD THOUSAND)
TABLE 118 AUSTRALIA & NEW ZEALAND POWDER SULFUR MARKET, BY PRODUCT, 2021-2030 (TONS)
TABLE 119 AUSTRALIA & NEW ZEALAND POWDER SULFUR MARKET, BY FINENESS, 2021-2030 (USD THOUSAND)
TABLE 120 AUSTRALIA & NEW ZEALAND POWDER SULFUR MARKET, BY FINENESS, 2021-2030 (TONS)
TABLE 121 SINGAPORE POWDER SULFUR MARKET, BY GRADE, 2021-2030 (USD THOUSAND)
TABLE 122 SINGAPORE POWDER SULFUR MARKET, BY GRADE, 2021-2030 (TONS)
TABLE 123 SINGAPORE AGRICULTURAL GRADE IN POWDER SULFUR MARKET, BY PRODUCT, 2021-2030 (USD THOUSAND)
TABLE 124 SINGAPORE RUBBER GRADE IN POWDER SULFUR MARKET, BY PRODUCT, 2021-2030 (USD THOUSAND)
TABLE 125 SINGAPORE RUBBER GRADE IN POWDER SULFUR MARKET, BY TYPE, 2021-2030 (USD THOUSAND)
TABLE 126 SINGAPORE INDUSTRIAL GRADE IN POWDER SULFUR MARKET, BY PRODUCT, 2021-2030 (USD THOUSAND)
TABLE 127 SINGAPORE PHARMA GRADE IN POWDER SULFUR MARKET, BY PRODUCT, 2021-2030 (USD THOUSAND)
TABLE 128 SINGAPORE FOOD GRADE IN POWDER SULFUR MARKET, BY PRODUCT, 2021-2030 (USD THOUSAND)
TABLE 129 SINGAPORE OTHERS IN POWDER SULFUR MARKET, BY PRODUCT, 2021-2030 (USD THOUSAND)
TABLE 130 SINGAPORE POWDER SULFUR MARKET, BY PRODUCT, 2021-2030 (USD THOUSAND)
TABLE 131 SINGAPORE POWDER SULFUR MARKET, BY PRODUCT, 2021-2030 (TONS)
TABLE 132 SINGAPORE POWDER SULFUR MARKET, BY FINENESS, 2021-2030 (USD THOUSAND)
TABLE 133 SINGAPORE POWDER SULFUR MARKET, BY FINENESS, 2021-2030 (TONS)
TABLE 134 PHILIPPINES POWDER SULFUR MARKET, BY GRADE, 2021-2030 (USD THOUSAND)
TABLE 135 PHILIPPINES POWDER SULFUR MARKET, BY GRADE, 2021-2030 (TONS)
TABLE 136 PHILIPPINES AGRICULTURAL GRADE IN POWDER SULFUR MARKET, BY PRODUCT, 2021-2030 (USD THOUSAND)
TABLE 137 PHILIPPINES RUBBER GRADE IN POWDER SULFUR MARKET, BY PRODUCT, 2021-2030 (USD THOUSAND)
TABLE 138 PHILIPPINES RUBBER GRADE IN POWDER SULFUR MARKET, BY TYPE, 2021-2030 (USD THOUSAND)
TABLE 139 PHILIPPINES INDUSTRIAL GRADE IN POWDER SULFUR MARKET, BY PRODUCT, 2021-2030 (USD THOUSAND)
TABLE 140 PHILIPPINES PHARMA GRADE IN POWDER SULFUR MARKET, BY PRODUCT, 2021-2030 (USD THOUSAND)
TABLE 141 PHILIPPINES FOOD GRADE IN POWDER SULFUR MARKET, BY PRODUCT, 2021-2030 (USD THOUSAND)
TABLE 142 PHILIPPINES OTHERS IN POWDER SULFUR MARKET, BY PRODUCT, 2021-2030 (USD THOUSAND)
TABLE 143 PHILIPPINES POWDER SULFUR MARKET, BY PRODUCT, 2021-2030 (USD THOUSAND)
TABLE 144 PHILIPPINES POWDER SULFUR MARKET, BY PRODUCT, 2021-2030 (TONS)
TABLE 145 PHILIPPINES POWDER SULFUR MARKET, BY FINENESS, 2021-2030 (USD THOUSAND)
TABLE 146 PHILIPPINES POWDER SULFUR MARKET, BY FINENESS, 2021-2030 (TONS)
TABLE 147 REST OF ASIA-PACIFIC POWDER SULFUR MARKET, BY GRADE, 2021-2030 (USD THOUSAND)
TABLE 148 REST OF ASIA-PACIFIC POWDER SULFUR MARKET, BY GRADE, 2021-2030 (TONS)
List of Figure
FIGURE 1 ASIA PACIFIC POWDER SULFUR MARKET
FIGURE 2 ASIA PACIFIC POWDER SULFUR MARKET: DATA TRIANGULATION
FIGURE 3 ASIA PACIFIC POWDER SULFUR MARKET: DROC ANALYSIS
FIGURE 4 ASIA PACIFIC POWDER SULFUR MARKET: ASIA PACIFIC VS REGIONAL MARKET ANALYSIS
FIGURE 5 ASIA PACIFIC POWDER SULFUR MARKET: COMPANY RESEARCH ANALYSIS
FIGURE 6 ASIA PACIFIC POWDER SULFUR MARKET: THE PRODUCT LIFELINE CURVE
FIGURE 7 ASIA PACIFIC POWDER SULFUR MARKET: MULTIVARIATE MODELLING
FIGURE 8 ASIA PACIFIC POWDER SULFUR MARKET: INTERVIEW DEMOGRAPHICS
FIGURE 9 ASIA PACIFIC POWDER SULFUR MARKET: DBMR MARKET POSITION GRID
FIGURE 10 ASIA PACIFIC POWDER SULFUR MARKET: THE MARKET CHALLENGE MATRIX
FIGURE 11 ASIA PACIFIC POWDER SULFUR MARKET: VENDOR SHARE ANALYSIS
FIGURE 12 ASIA PACIFIC POWDER SULFUR MARKET: SEGMENTATION
FIGURE 13 A POSITIVE OUTLOOK TOWARDS THE BUILDING AND CONSTRUCTION SECTOR IS EXPECTED TO DRIVE THE ASIA PACIFIC POWDER SULFUR MARKET IN THE FORECAST PERIOD
FIGURE 14 THE AGRICULTURAL GRADE SEGMENT IS EXPECTED TO ACCOUNT FOR THE LARGEST SHARE OF THE ASIA PACIFIC POWDER SULFUR MARKET IN 2023 AND 2030
FIGURE 15 IMPORT-EXPORT SCENARIO (USD THOUSAND)
FIGURE 16 PRICE ANALYSIS FOR ASIA PACIFIC POWDER SULFUR MARKET (USD/TON)
FIGURE 17 VENDOR SELECTION CRITERIA
FIGURE 18 DRIVERS, RESTRAINTS, OPPORTUNITIES, AND CHALLENGES OF THE ASIA PACIFIC SULFUR POWDER MARKET
FIGURE 19 ASIA-PACIFIC POWDER SULFUR MARKET: SNAPSHOT (2022)
FIGURE 20 ASIA-PACIFIC POWDER SULFUR MARKET: BY COUNTRY (2022)
FIGURE 21 ASIA-PACIFIC POWDER SULFUR MARKET: BY COUNTRY (2023 & 2030)
FIGURE 22 ASIA-PACIFIC POWDER SULFUR MARKET: BY COUNTRY (2022 & 2030)
FIGURE 23 ASIA-PACIFIC POWDER SULFUR MARKET: BY GRADE (2023 - 2030)
FIGURE 24 ASIA PACIFIC POWDER SULFUR MARKET: COMPANY SHARE 2022 (%)
Asia Pacific Powder Sulfur Market, Supply Chain Analysis and Ecosystem Framework
To support market growth and help clients navigate the impact of geopolitical shifts, DBMR has integrated in-depth supply chain analysis into its Asia Pacific Powder Sulfur Market research reports. This addition empowers clients to respond effectively to global changes affecting their industries. The supply chain analysis section includes detailed insights such as Asia Pacific Powder Sulfur Market consumption and production by country, price trend analysis, the impact of tariffs and geopolitical developments, and import and export trends by country and HSN code. It also highlights major suppliers with data on production capacity and company profiles, as well as key importers and exporters. In addition to research, DBMR offers specialized supply chain consulting services backed by over a decade of experience, providing solutions like supplier discovery, supplier risk assessment, price trend analysis, impact evaluation of inflation and trade route changes, and comprehensive market trend analysis.
Research Methodology
Data collection and base year analysis are done using data collection modules with large sample sizes. The stage includes obtaining market information or related data through various sources and strategies. It includes examining and planning all the data acquired from the past in advance. It likewise envelops the examination of information inconsistencies seen across different information sources. The market data is analysed and estimated using market statistical and coherent models. Also, market share analysis and key trend analysis are the major success factors in the market report. To know more, please request an analyst call or drop down your inquiry.
The key research methodology used by DBMR research team is data triangulation which involves data mining, analysis of the impact of data variables on the market and primary (industry expert) validation. Data models include Vendor Positioning Grid, Market Time Line Analysis, Market Overview and Guide, Company Positioning Grid, Patent Analysis, Pricing Analysis, Company Market Share Analysis, Standards of Measurement, Global versus Regional and Vendor Share Analysis. To know more about the research methodology, drop in an inquiry to speak to our industry experts.
Customization Available
Data Bridge Market Research is a leader in advanced formative research. We take pride in servicing our existing and new customers with data and analysis that match and suits their goal. The report can be customized to include price trend analysis of target brands understanding the market for additional countries (ask for the list of countries), clinical trial results data, literature review, refurbished market and product base analysis. Market analysis of target competitors can be analyzed from technology-based analysis to market portfolio strategies. We can add as many competitors that you require data about in the format and data style you are looking for. Our team of analysts can also provide you data in crude raw excel files pivot tables (Fact book) or can assist you in creating presentations from the data sets available in the report.

