Asia-Pacific Phytonutrients Market Analysis and Insights
Increasing demand for phytonutrients in the food and beverage industries will accelerate the market demand. The rising focus on pharmaceutical industries to reduce cancer, diabetes, and heart disease will also enhance the Asia-Pacific phytonutrients market. Additionally, the need for phytonutrients in the feed and cosmetics industries is also expected to drive the market. The increase in demand for ayurvedic products is expected to act as an opportunity for the market.


The standard quality determination technique of phytonutrients and their products is inadequate, which is expected to restrain the growth of the Asia-Pacific phytonutrients market. Additionally, the phytonutrient supplements are insufficient in regulating products that involve marketing and promotion, which is anticipated to inhibit the development of the Asia-Pacific phytonutrients market through the forecast term. The manufacturers of the phytonutrients focus on the R&D work on the extraction process of phytonutrients that may challenge competitors in the market.
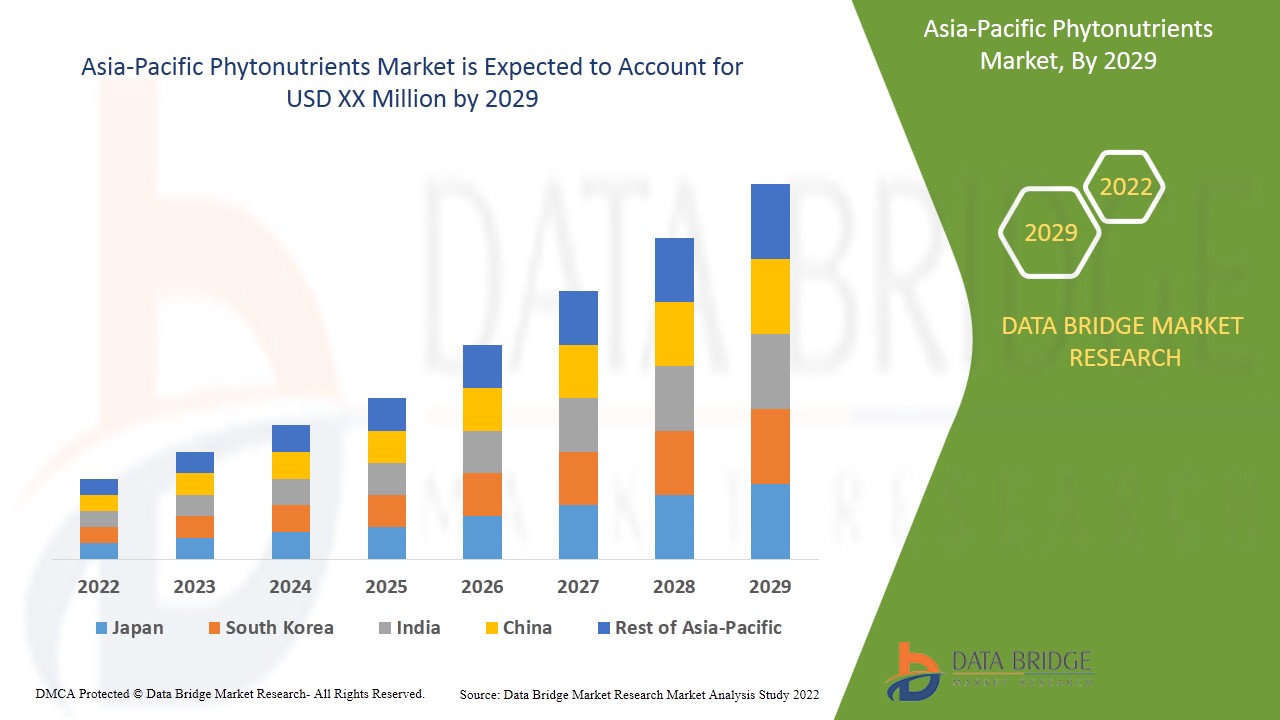
Data Bridge Market Research analyses that the Asia-Pacific phytonutrients market will grow at a CAGR of 8.7% during the forecast period of 2022 to 2029.
|
Report Metric |
Details |
|
Forecast Period |
2022 to 2029 |
|
Base Year |
2021 |
|
Historic Years |
2020 (Customizable to 2019- 2015) |
|
Quantitative Units |
Revenue in USD Million, Volume in Units, Pricing in USD |
|
Segments Covered |
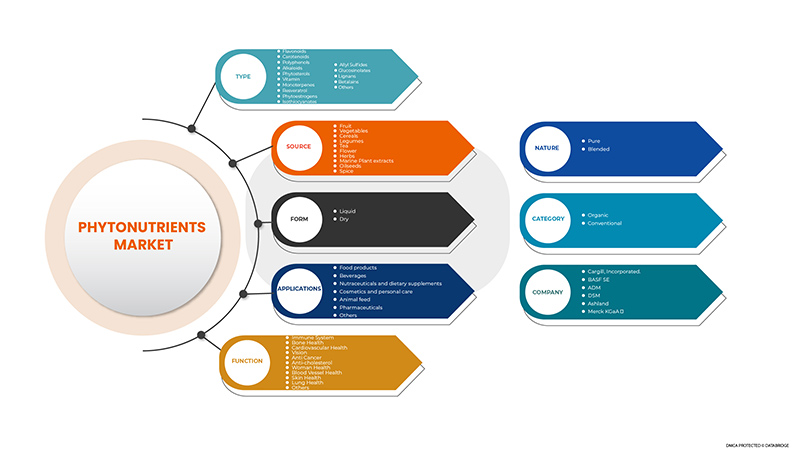
By Type (Flavonoids, Carotenoids, Polyphenols, Alkaloids, Phytosterols, Vitamins, Monoterpenes, Resveratrol, Phytoestrogens, Isothiocyanates, Allyl Sulfides, Glucosinolates, Lignans, Betalains, and Others), Function (Immune System, Vision, Skin Health, Bone Health, Cardiovascular Health, Anti-Cancer, Lung Health, Blood Vessel Health, Woman Health, Anti-Cholesterol, and Others), Source (Spice, Herb, Flower, Tea, Fruit, Vegetables, Cereals, Legumes, Oilseeds, Marine Plant Extracts), Form (Liquid, Dry), Category (Organic, Conventional), Nature (Blended, Pure), Application (Food Products, Beverages, Nutraceuticals, and Dietary Supplements, Cosmetics and Personal Care, Animal Feed, Pharmaceuticals, Others) |
|
Countries Covered |
China, India, Japan, Australia, South Korea, Malaysia, Singapore, Thailand, New Zealand, Indonesia, Philippines, Vietnam, Rest of the Asia-Pacific |
|
Market Players Covered |
DSM, ADM, BASF SE, Cargill, Incorporated., Merck KGaA, Ashland, IFF Nutrition & Biosciences, ConnOils LLC, PhytoSource, Inc., NutriScience Innovations, LLC, Matrix Fine Sciences Pvt. Ltd, Xi'an Healthful Biotechnology Co., Ltd, Vitae Caps S.A., DÖHLER GMBH, HERBAL CREATIONS, ExcelVite, Bio-India Biologicals (BIB) Corporation, Cyanotech Corporation, Kothari Phytochemicals International, Aayuritz Phytonutrients Pvt.Ltd., Lycored, BTSA, MANUS AKTTEVA BIOPHARMA LLP, Hindustan Herbals, Brlb International, Sabinsa, among others |
Asia-Pacific Phytonutrients Market Dynamics
Drivers
- Increasing Demand for Food & Beverage Products
Rising demand for food and beverages due to the increasing Asia-Pacific population is expected to drive the demand for phytonutrients in the industry. Further, the increasing demand for natural ingredients-based food and beverages products because of rising concern about the quality and nutritional value of the food and beverages products is expected to drive the demand for phytonutrients in the food and beverages industry.
- Increasing Demand for Animal Feed
In the animal feed industry, phytonutrients are used as antioxidants in animal feed to enhance animal growth and protect animals from oxidative damage caused by free radicals. Phytonutrients help to enhance innate immunity in animals, especially poultry. The growth of phytonutrients in animal feed is attributed to some the factors such as the growing demand for meat worldwide, growing poultry meat consumption, and others are expected to drive the demand for animal feed, which in turn, the demand for phytonutrients is likely to increase in the animal feed industry over the forecast period
Opportunities
- Growing Demand for Natural Skincare and Cosmetic Products
Growing consumer awareness of the benefits of natural or organic products is expected to increase the demand for natural skincare and cosmetic products. As well as rising environmental concerns are likely to increase product demand in the upcoming years. Additionally, increase in demand for phytochemicals in skincare and cosmetic products, such as Curcumin, resveratrol, epicatechin, ellagic acid, and apigenin used in cosmetic formulations to combat skin aging. Thus, the increase in demand for natural skincare and cosmetic products is expected to act as an opportunity for the Asia-Pacific phytonutrients market.
Restraints/Challenges
- Side Effects of Extra Consumption of Phytonutrients
Phytonutrients are healthy for the human body. However, extra consumption of some phytonutrients may have side effects. Phytochemicals that are toxic to humans are known as phytotoxins. Some phytochemicals have antinutrients properties that interfere with the absorption of nutrients. And some phytonutrients, such as polyphenols and flavonoids, are pro-oxidants in high ingested amounts.
Thus, the side effects caused due to over-consumption of phytonutrients are expected to challenge the demand of the Asia-Pacific phytonutrients market.
This Asia-Pacific phytonutrients market report provides details of new recent developments, trade regulations, import-export analysis, production analysis, value chain optimization, market share, the impact of domestic and localized market players, analyses opportunities in terms of emerging revenue pockets, changes in market regulations, strategic market growth analysis, market size, category market growths, application niches and dominance, product approvals, product launches, geographic expansions, technological innovations in the market. To gain more info on the Asia-Pacific phytonutrients market, contact Data Bridge Market Research for an Analyst Brief; our team will help you make an informed market decision to achieve market growth.
Post COVID-19 Impact on Asia-Pacific Phytonutrients Market
The impact of the COVID-19 pandemic has resulted in lockdown in most countries to restrict the spread of the virus, which has highly affected each and every type of industry. The phytonutrients market growth worldwide has created extreme uncertainty due to the outbreak of COVID-19. Maintaining the food movement along the food chain is essential for the food and beverages industry. Most of the companies regained operation after the government guidelines, which positively impacts the growth of the Asia-Pacific phytonutrients market in years to come.
Recent Development
- In December 2020, Merck KGaA expanded its production facilities in the U.S. for the life sciences businesses. These expansions will significantly increase capacity and output at these facilities by the end of 2021 and 2022, respectively, and create nearly 700 new manufacturing positions. This expansion helped the company to broaden its geographical presence
Asia-Pacific Phytonutrients Market Scope
The Asia-Pacific phytonutrients market is segmented into type, source, nature, category, form, function, and application. The growth amongst these segments will help you analyze major growth segments in the industries and provide the users with a valuable market overview and market insights to make strategic decisions to identify core market applications.
Type
- Flavonoids
- Carotenoids
- Polyphenols
- Alkaloids
- Phytosterols
- Vitamins
- Monoterpenes
- Resveratrol
- Phytoestrogens
- Isothiocyanates
- Allyl Sulfides
- Glucosinolates
- Lignans
- Betalains
- Others
On the basis of type, the Asia-Pacific phytonutrients market is segmented into flavonoids, carotenoids, polyphenols, alkaloids, phytosterols, vitamins, monoterpenes, resveratrol, phytoestrogens, isothiocyanates, allyl sulfides, glucosinolates, lignans, betalains, and others.
Form
- Dry
- Liquid
On the basis of form, the Asia-Pacific phytonutrients market is segmented into dry and liquid.
Category
- Organic
- Conventional
On the basis of category, the Asia-Pacific phytonutrients market is segmented into organic and conventional.
Nature
- Blended
- Pure
On the basis of nature, the Asia-Pacific phytonutrients market is segmented into blended and pure.
Function
- Immune System
- Vision
- Skin Health
- Bone Health
- Cardiovascular Health
- Anti-Cancer
- Lung Health
- Blood Vessel Health
- Woman Health
- Anti-Cholesterol
- Others
On the basis of function, the Asia-Pacific phytonutrients market is segmented into immune system, vision, skin health, bone health, cardiovascular health, anti-cancer, lung health, blood vessel health, woman health, anti-cholesterol, and others.
Source
- Spice
- Herb
- Flower
- Tea
- Fruit
- Vegetables
- Cereals
- Legumes
- Oilseeds
- Marine plant extract
On the basis of nature, the Asia-Pacific phytonutrients market is segmented into spice, herb, flower, tea, fruit, vegetables, cereals, legumes, oilseeds, marine plant extracts.
Application
- Food products
- Beverages
- Nutraceuticals
- Dietary Supplements
- Cosmetics and Personal Care
- Animal Feed
- Pharmaceuticals
- Others

On the basis of application, the Asia-Pacific phytonutrients market is segmented into food products, beverages, nutraceuticals, and dietary supplements, cosmetics and personal care, animal feed, pharmaceuticals, others.
Asia-Pacific Phytonutrients Market Regional Analysis/Insights
The Asia-Pacific phytonutrients market is analyzed, and market size insights and trends are provided based on country, type, source, nature, category, form, function, and application, as referenced above.
Some of the countries covered in the Asia-Pacific phytonutrients market report are China, India, Japan, Australia, South Korea, Malaysia, Singapore, Thailand, New Zealand, Indonesia, Philippines, Vietnam, and the Rest of Asia-Pacific.
India is expected to dominate the Asia-Pacific phytonutrients market in terms of market share and market revenue and will continue to flourish its dominance during the forecast period. The growth in the region is attributed to an increase in the use of phytonutrients in cosmetic products and dietary supplements.
The country section of the report also provides individual market impacting factors and changes in regulations in the market that impact the current and future trends of the market. Data points, such as new and replacement sales, country demographics, disease epidemiology, and import-export tariffs, are some of the major pointers used to forecast the market scenario for individual countries. In addition, the presence and availability of Asia-Pacific brands and their challenges faced due to high competition from local and domestic brands and the impact of sales channels are considered while providing forecast analysis of the country data.
Competitive Landscape and Asia-Pacific Phytonutrients Market Share Analysis
The Asia-Pacific phytonutrients market competitive landscape provides details about the competitors. Details included are company overview, company financials, revenue generated, market potential, investment in research and development, new market initiatives, Asia-Pacific presence, production sites and facilities, production capacities, company strengths and weaknesses, product launch, product width, and breadth, and application dominance. The above data points provided are only related to the companies' focus on the Asia-Pacific phytonutrients market.
Some of the key market players in the Asia-Pacific phytonutrients market are DSM, ADM, BASF SE, Cargill, Incorporated., Merck KGaA, Ashland, IFF Nutrition & Biosciences, ConnOils LLC, PhytoSource, Inc., NutriScience Innovations, LLC, Matrix Fine Sciences Pvt. Ltd, Xi'an Healthful Biotechnology Co., Ltd, Vitae Caps S.A., DÖHLER GMBH, HERBAL CREATIONS, ExcelVite, Bio-India Biologicals (BIB) Corporation, Cyanotech Corporation, Kothari Phytochemicals International, Aayuritz Phytonutrients Pvt.Ltd., Lycored, BTSA, MANUS AKTTEVA BIOPHARMA LLP, Hindustan Herbals, Brlb International, Sabinsa, among others.
Research Methodology
Data collection and base year analysis are done using data collection modules with large sample sizes. The market data is analyzed and estimated using market statistical and coherent models. In addition, market share analysis and key trend analysis are the major success factors in the market report. The key research methodology used by the DBMR research team is data triangulation which involves data mining, analysis of the impact of data variables on the market, and primary (industry expert) validation. Apart from this, data models include Vendor Positioning Grid, Market Time Line Analysis, Market Overview and Guide, Company Positioning Grid, Company Market Share Analysis, Standards of Measurement, Asia-Pacific Vs Regional, and Vendor Share Analysis. Please request an analyst call in case of further inquiry.
SKU-
Get online access to the report on the World's First Market Intelligence Cloud
- Interactive Data Analysis Dashboard
- Company Analysis Dashboard for high growth potential opportunities
- Research Analyst Access for customization & queries
- Competitor Analysis with Interactive dashboard
- Latest News, Updates & Trend analysis
- Harness the Power of Benchmark Analysis for Comprehensive Competitor Tracking
Table of Content
1 INTRODUCTION
1.1 OBJECTIVES OF THE STUDY
1.2 MARKET DEFINITION
1.3 OVERVIEW OF ASIA PACIFIC PHYTONUTRIENTS MARKET
1.4 LIMITATIONS
1.5 MARKETS COVERED
2 MARKET SEGMENTATION
2.1 MARKETS COVERED
2.2 GEOGRAPHICAL SCOPE
2.3 YEARS CONSIDERED FOR THE STUDY
2.4 CURRENCY AND PRICING
2.5 DBMR TRIPOD DATA VALIDATION MODEL
2.6 MULTIVARIATE MODELLING
2.7 TYPE LIFELINE CURVE
2.8 PRIMARY INTERVIEWS WITH KEY OPINION LEADERS
2.9 DBMR MARKET POSITION GRID
2.1 VENDOR SHARE ANALYSIS
2.11 MARKET APPLICATION COVERAGE GRID
2.12 SECONDARY SOURCES
2.13 ASSUMPTIONS
3 EXECUTIVE SUMMARY
4 PREMIUM INSIGHTS
4.1 MARKETING STRATEGIES
4.1.1 LAUNCHING NEW INNOVATIVE PRODUCTS
4.1.2 PROMOTION OF THEIR PRODUCTS BY EMPHASIZING DIFFERENT APPLICATIONS
4.1.3 A VAST NETWORK OF DISTRIBUTION
4.1.4 STRATEGIC DECISIONS BY KEY PLAYERS
4.2 PATENT ANALYSIS OF ASIA PACIFIC PHYTONUTRIENTS MARKET
4.2.1 DBMR ANALYSIS
4.2.2 COUNTRY LEVEL ANALYSIS
4.2.3 YEARWISE ANALYSIS
4.3 EXTRACTION PROCESS
4.4 CERTIFICATION
4.5 TECHNOLOGICAL CHALLENGES
4.6 LIST OF SUBSTITUTES
4.7 HEALTH CLAIMS OF PHYTONUTRIENTS
4.8 NUTRITIONAL FACTS OF PHYTONUTRIENTS
4.8.1 RECOMMENDED INTAKE OF PHYTONUTRIENTS
4.9 RAW MATERIAL PRICING ANALYSIS
4.9.1 GEOGRAPHICAL PRICING
4.9.2 DEMAND FACTOR IN PRICING
4.9.3 GEOGRAPHICAL PRICING
4.9.4 DEMAND FACTOR IN PRICING
4.1 CONSUMPTION ANALYSIS FOR PHYTONUTRIENT INTAKES IN EUROPEAN COUNTRIES
4.11 IMPORT-EXPORT ANALYSIS
4.12 ASIA PACIFIC PHYTONUTRIENTS MARKET: SUPPLY CHAIN ANALYSIS
4.13 VALUE CHAIN ANALYSIS: ASIA PACIFIC PHYTONUTRIENTS MARKET
4.14 IMPORT-EXPORT ANALYSIS
5 ASIA PACIFIC PHYTONUTRIENTS MARKET: REGULATIONS
5.1 FDA REGULATIONS
5.2 EU REGULATIONS
5.3 USDA REGULATIONS
5.4 FAO REGULATIONS
6 MARKET OVERVIEW
6.1 DRIVERS
6.1.1 INCREASING DEMAND FOR FOOD & BEVERAGE PRODUCTS
6.1.2 INCREASING DEMAND FOR ANIMAL FEED
6.1.3 INCREASING DEMAND FOR NUTRACEUTICAL PRODUCTS
6.1.4 NUMEROUS HEALTH BENEFITS ASSOCIATED WITH PHYTONUTRIENTS
6.2 RESTRAINTS
6.2.1 AVAILABILITY OF SUBSTITUTES
6.2.2 QUALITY OF RAW MATERIALS
6.3 OPPORTUNITIES
6.3.1 GROWING DEMAND FOR NATURAL FOOD PRODUCTS
6.3.2 INCREASING DEMAND FOR CAROTENOIDS IN VARIOUS END-USE INDUSTRIES
6.3.3 GROWING DEMAND FOR NATURAL SKINCARE AND COSMETIC PRODUCTS
6.3.4 STRATEGIC DECISIONS BY KEY PLAYERS
6.4 CHALLENGES
6.4.1 DISTURBANCE IN SUPPLY CHAIN DUE TO COVID-19 PANDEMIC
6.4.2 SIDE EFFECTS OF EXTRA CONSUMPTION OF PHYTONUTRIENTS
7 ASIA PACIFIC PHYTONUTRIENTS MARKET, BY TYPE
7.1 OVERVIEW
7.2 FLAVONOIDS
7.3 CAROTENOIDS
7.4 POLYPHENOLS
7.5 ALKALOIDS
7.6 PHYTOSTEROLS
7.7 VITAMIN
7.8 MONOTERPENES
7.9 RESVERATROL
7.1 PHYTOESTROGENS
7.11 ISOTHIOCYANATES
7.12 ALLYL SULFIDES
7.13 GLUCOSINOLATES
7.14 LIGNANS
7.15 BETALAINS
7.16 OTHERS
8 ASIA PACIFIC PHYTONUTRIENTS MARKET, BY SOURCE
8.1 OVERVIEW
8.2 FRUIT
8.3 VEGETABLES
8.4 CEREALS
8.5 LEGUMES
8.6 TEA
8.7 FLOWER
8.8 HERBS
8.9 MARINE PLANT EXTRACTS
8.1 OILSEEDS
8.11 SPICE
9 ASIA PACIFIC PHYTONUTRIENTS MARKET, BY FORM
9.1 OVERVIEW
9.2 LIQUID
9.3 DRY
10 ASIA PACIFIC PHYTONUTRIENTS MARKET, BY CATEGORY
10.1 OVERVIEW
10.2 CONVENTIONAL
10.3 ORGANIC
11 ASIA PACIFIC PHYTONUTRIENTS MARKET, BY NATURE
11.1 OVERVIEW
11.2 BLENDED
11.3 PURE
12 ASIA PACIFIC PHYTONUTRIENTS MARKET, BY FUNCTION
12.1 OVERVIEW
12.2 IMMUNE SYSTEM
12.3 BONE HEALTH
12.4 CARDIOVASCULAR HEALTH
12.5 VISION
12.6 ANTI-CANCER
12.7 ANTI-CHOLESTEROL
12.8 WOMEN HEALTH
12.9 BLOOD VESSEL HEALTH
12.1 SKIN HEALTH
12.11 LUNG HEALTH
12.12 OTHERS
13 ASIA PACIFIC PHYTONUTRIENTS MARKET, BY APPLICATION
13.1 OVERVIEW
13.2 FOOD PRODUCTS
13.3 BEVERAGES
13.4 NUTRACEUTICALS AND DIETARY SUPPLEMENTS
13.5 COSMETICS AND PERSONAL CARE
13.6 PHARMACEUTICALS
13.7 ANIMAL FEED
13.8 OTHERS
14 ASIA PACIFIC PHYTONUTRIENTS MARKET, BY REGION
14.1 ASIA-PACIFIC
14.1.1 CHINA
14.1.2 INDIA
14.1.3 JAPAN
14.1.4 AUSTRALIA
14.1.5 SOUTH KOREA
14.1.6 NEW ZEALAND
14.1.7 SINGAPORE
14.1.8 THAILAND
14.1.9 INDONESIA
14.1.10 MALAYSIA
14.1.11 PHILIPPINES
14.1.12 VIETNAM
14.1.13 REST OF ASIA-PACIFIC
15 ASIA PACIFIC PHYTONUTRIENTS MARKET: COMPANY LANDSCAPE
15.1 COMPANY SHARE ANALYSIS: ASIA PACIFIC
16 SWOT ANALYSIS
17 COMPANY PROFILE
17.1 MERCK KGAA
17.1.1 COMPANY SNAPSHOT
17.1.2 REVENUS ANALYSIS
17.1.3 COMPANY SHARE ANALYSIS
17.1.4 PRODUCT PORTFOLIO
17.1.5 RECENT DEVELOPMENTS
17.2 CARGILL, INCORPORATED.
17.2.1 COMPANY SNAPSHOT
17.2.2 REVENUS ANALYSIS
17.2.3 COMPANY SHARE ANALYSIS
17.2.4 PRODUCT PORTFOLIO
17.2.5 RECENT DEVELOPMENT
17.3 BASF SE
17.3.1 COMPANY SNAPSHOT
17.3.2 REVENUS ANALYSIS
17.3.3 COMPANY SHARE ANALYSIS
17.3.4 PRODUCT PORTFOLIO
17.3.5 RECENT DEVELOPMENT
17.4 DSM
17.4.1 COMPANY SNAPSHOT
17.4.2 REVENUS ANALYSIS
17.4.3 COMPANY SHARE ANALYSIS
17.4.4 PRODUCT PORTFOLIO
17.4.5 RECENT DEVELOPMENT
17.5 ADM
17.5.1 COMPANY SNAPSHOT
17.5.2 REVENUE ANALYSIS
17.5.3 COMPANY SHARE ANALYSIS
17.5.4 PRODUCT PORTFOLIO
17.5.5 RECENT DEVELOPMENTS
17.6 IFF NUTRITION & BIOSCIENCES
17.6.1 COMPANY SNAPSHOT
17.6.2 PRODUCT PORTFOLIO
17.6.3 RECENT DEVELOPMENT
17.7 KOTHARI PHYTOCHEMICALS INTERNATIONAL
17.7.1 COMPANY SNAPSHOT
17.7.2 REVENUE ANALYSIS
17.7.3 PRODUCT PORTFOLIO
17.7.4 RECENT DEVELOPMENT
17.8 ASHLAND
17.8.1 COMPANY SNAPSHOT
17.8.2 REVENUE ANALYSIS
17.8.3 PRODUCT PORTFOLIO
17.8.4 RECENT DEVELOPMENT
17.9 AAYURITZ PHYTONUTRIENTS PVT.LTD.
17.9.1 COMPANY SNAPSHOT
17.9.2 PRODUCT PORTFOLIO
17.9.3 RECENT DEVELOPMENT
17.1 AOM
17.10.1 COMPANY SNAPSHOT
17.10.2 PRODUCT PORTFOLIO
17.10.3 RECENT DEVELOPMENT
17.11 ARBORIS
17.11.1 COMPANY SNAPSHOT
17.11.2 PRODUCT PORTFOLIO
17.11.3 RECENT DEVELOPMENT
17.12 BIO-INDIA BIOLOGICALS (BIB) CORPORATION
17.12.1 COMPANY SNAPSHOT
17.12.2 PRODUCT PORTFOLIO
17.12.3 RECENT DEVELOPMENT
17.13 BRLB INTERNATIONAL
17.13.1 COMPANY SNAPSHOT
17.13.2 PRODUCT PORTFOLIO
17.13.3 RECENT DEVELOPMENT
17.14 BTSA
17.14.1 COMPANY SNAPSHOT
17.14.2 PRODUCT PORTFOLIO
17.14.3 RECENT DEVELOPMENT
17.15 CONNOILS LLC
17.15.1 COMPANY SNAPSHOT
17.15.2 PRODUCT PORTFOLIO
17.15.3 RECENT DEVELOPMENT
17.16 CYANOTECH CORPORATION
17.16.1 COMPANY SNAPSHOT
17.16.2 REVENUS ANALYSIS
17.16.3 PRODUCT PORTFOLIO
17.16.4 RECENT DEVELOPMENT
17.17 DÖHLER GMBH
17.17.1 COMPANY SNAPSHOT
17.17.2 PRODUCT PORTFOLIO
17.17.3 RECENT DEVELOPMENT
17.18 DYNADIS
17.18.1 COMPANY SNAPSHOT
17.18.2 PRODUCT PORTFOLIO
17.18.3 RECENT DEVELOPMENT
17.19 ELEMENTA
17.19.1 COMPANY SNAPSHOT
17.19.2 PRODUCT PORTFOLIO
17.19.3 RECENT DEVELOPMENT
17.2 EXCELVITE
17.20.1 COMPANY SNAPSHOT
17.20.2 PRODUCT PORTFOLIO
17.20.3 RECENT DEVELOPMENT
17.21 GUSTAV PARMENTIER GMBH
17.21.1 COMPANY SNAPSHOT
17.21.2 PRODUCT PORTFOLIO
17.21.3 RECENT DEVELOPMENT
17.22 HERBAL CREATIONS
17.22.1 COMPANY SNAPSHOT
17.22.2 PRODUCT PORTFOLIO
17.22.3 RECENT DEVELOPMENT
17.23 HINDUSTAN HERBALS
17.23.1 COMPANY SNAPSHOT
17.23.2 PRODUCT PORTFOLIO
17.23.3 RECENT DEVELOPMENT
17.24 LYCORED
17.24.1 COMPANY SNAPSHOT
17.24.2 PRODUCT PORTFOLIO
17.24.3 RECENT DEVELOPMENT
17.25 MATRIX LIFE SCIENCE PVT. LTD
17.25.1 COMPANY SNAPSHOT
17.25.2 PRODUCT PORTFOLIO
17.25.3 RECENT DEVELOPMENT
17.26 MANUS AKTTEVA BIOPHARMA LLP
17.26.1 COMPANY SNAPSHOT
17.26.2 PRODUCT PORTFOLIO
17.26.3 RECENT DEVELOPMENT
17.27 NUTRISCIENCE INNOVATIONS, LLC
17.27.1 COMPANY SNAPSHOT
17.27.2 PRODUCT PORTFOLIO
17.27.3 RECENT DEVELOPMENT
17.28 PHYTOSOURCE, INC.
17.28.1 COMPANY SNAPSHOT
17.28.2 PRODUCT PORTFOLIO
17.28.3 RECENT DEVELOPMENT
17.29 PRINOVA GROUP LLC.
17.29.1 COMPANY SNAPSHOT
17.29.2 PRODUCT PORTFOLIO
17.29.3 RECENT DEVELOPMENT
17.3 SABINSA
17.30.1 COMPANY SNAPSHOT
17.30.2 PRODUCT PORTFOLIO
17.30.3 RECENT DEVELOPMENTS
17.31 VITAE CAPS S.A.
17.31.1 COMPANY SNAPSHOT
17.31.2 PRODUCT PORTFOLIO
17.31.3 RECENT DEVELOPMENT
17.32 XI'AN HEALTHFUL BIOTECHNOLOGY CO., LTD
17.32.1 COMPANY SNAPSHOT
17.32.2 PRODUCT PORTFOLIO
17.32.3 RECENT DEVELOPMENT
18 QUESTIONNAIRE
19 RELATED REPORTS
List of Table
TABLE 1 LIST OF SUBSTITUTE
TABLE 2 POTENTIAL BENEFITS OF PHYTONUTRIENT COMPOUNDS.
TABLE 3 U.S. MONTHLY AVERAGE RETAIL PRICES: FRESH AND PROCESSED FRUITS, YEAR (2019-2021)
TABLE 4 U.S. MONTHLY AVERAGE RETAIL PRICES: FRESH AND PROCESSED VEGETABLES, YEAR (2019-2021)
TABLE 5 EUROPEAN UNION FRUITS PRICES: (2021)
TABLE 6 EUROPEAN UNION VEGETABLES PRICES: (2021)
TABLE 7 WORLD FRUITS AND VEGETABLE PRODUCTION, (MILLION TONS), 2018
TABLE 8 IMPORT OF 2939 VEGETABLE ALKALOIDS, NATURAL OR REPRODUCED BY SYNTHESIS, AND THEIR SALTS, ETHERS, ESTERS AND OTHER DERIVATIVES IN USD THOUSAND
TABLE 9 IMPORT OF 2939 VEGETABLE ALKALOIDS, NATURAL OR REPRODUCED BY SYNTHESIS, AND THEIR SALTS, ETHERS, ESTERS AND OTHER DERIVATIVES IN TONNES
TABLE 10 EXPORT OF 2939 VEGETABLE ALKALOIDS, NATURAL OR REPRODUCED BY SYNTHESIS, AND THEIR SALTS, ETHERS, ESTERS AND OTHER DERIVATIVES IN USD THOUSAND
TABLE 11 EXPORT OF 2939 VEGETABLE ALKALOIDS, NATURAL OR REPRODUCED BY SYNTHESIS, AND THEIR SALTS, ETHERS, ESTERS AND OTHER DERIVATIVES IN TONNES
TABLE 12 IMPORT OF 2939 VEGETABLE ALKALOIDS, NATURAL OR REPRODUCED BY SYNTHESIS, AND THEIR SALTS, ETHERS, ESTERS AND OTHER DERIVATIVES IN USD THOUSAND
TABLE 13 IMPORT OF 2939 VEGETABLE ALKALOIDS, NATURAL OR REPRODUCED BY SYNTHESIS, AND THEIR SALTS, ETHERS, ESTERS AND OTHER DERIVATIVES IN TONNES
TABLE 14 EXPORT OF 2939 VEGETABLE ALKALOIDS, NATURAL OR REPRODUCED BY SYNTHESIS, AND THEIR SALTS, ETHERS, ESTERS AND OTHER DERIVATIVES IN USD THOUSAND
TABLE 15 EXPORT OF 2939 VEGETABLE ALKALOIDS, NATURAL OR REPRODUCED BY SYNTHESIS, AND THEIR SALTS, ETHERS, ESTERS AND OTHER DERIVATIVES IN TONNES
TABLE 16 LIST OF SOME PHYTONUTRIENTS USED IN NUTRACEUTICAL PRODUCTS
TABLE 17 FLAVONOIDS AND SOURCES
List of Figure
FIGURE 1 ASIA PACIFIC PHYTONUTRIENTS MARKET: SEGMENTATION
FIGURE 2 ASIA PACIFIC PHYTONUTRIENTS MARKET: DATA TRIANGULATION
FIGURE 3 ASIA PACIFIC PHYTONUTRIENTS MARKET: DROC ANALYSIS
FIGURE 4 ASIA PACIFIC PHYTONUTRIENTS MARKET: ASIA PACIFIC VS REGIONAL MARKET ANALYSIS
FIGURE 5 ASIA PACIFIC PHYTONUTRIENTS MARKET: COMPANY RESEARCH ANALYSIS
FIGURE 6 ASIA PACIFIC PHYTONUTRIENTS MARKET: INTERVIEW DEMOGRAPHICS
FIGURE 7 ASIA PACIFIC PHYTONUTRIENTS MARKET: DBMR MARKET POSITION GRID
FIGURE 8 ASIA PACIFIC PHYTONUTRIENTS MARKET: VENDOR SHARE ANALYSIS
FIGURE 9 ASIA PACIFIC PHYTONUTRIENTS MARKET: APPLICATION COVERAGE GRID
FIGURE 10 ASIA PACIFIC PHYTONUTRIENTS MARKET: SEGMENTATION
FIGURE 11 EUROPE IS EXPECTED TO DOMINATE THE ASIA PACIFIC PHYTONUTRIENTS MARKET AND GROW WITH THE HIGHEST CAGR IN THE FORECAST PERIOD
FIGURE 12 INCREASING USE OF PHYTONUTRIENTS IN PERSONAL/SKINCARE PRODUCTS AND PHARMACEUTICAL DRUGS LEAD TO THE GROWTH OF THE ASIA PACIFIC PHYTONUTRIENTS MARKET IN THE FORECAST PERIOD
FIGURE 13 TYPE SEGMENT IS EXPECTED TO ACCOUNT FOR THE LARGEST SHARE OF THE ASIA PACIFIC PHYTONUTRIENTS MARKET IN 2022 & 2029
FIGURE 14 PATENT REGISTERED FOR PHYTONUTRIENTS, BY COUNTRY
FIGURE 15 PATENT REGISTERED YEAR (2018 - 2022)
FIGURE 16 VALUE CHAIN OF PHYTONUTRIENTS
FIGURE 17 DRIVERS, RESTRAINTS, OPPORTUNITIES, AND CHALLENGES OF THE ASIA PACIFIC PHYTONUTRIENTS MARKET
FIGURE 18 POULTRY MEAT CONSUMPTION KILOGRAMS PER CAPITA GROWTH FROM 2019-2021
FIGURE 19 ASIA PACIFIC PHYTONUTRIENTS MARKET, BY TYPE, 2021
FIGURE 20 ASIA PACIFIC PHYTONUTRIENTS MARKET, BY SOURCE, 2021
FIGURE 21 ASIA PACIFIC PHYTONUTRIENTS MARKET, BY FORM, 2021
FIGURE 22 ASIA PACIFIC PHYTONUTRIENTS MARKET, BY CATEGORY, 2021
FIGURE 23 ASIA PACIFIC PHYTONUTRIENTS MARKET, BY NATURE, 2021
FIGURE 24 ASIA PACIFIC PHYTONUTRIENTS MARKET, BY FUNCTION, 2021
FIGURE 25 ASIA PACIFIC PHYTONUTRIENTS MARKET, BY APPLICATION, 2021
FIGURE 26 ASIA-PACIFIC PHYTONUTRIENTS MARKET: SNAPSHOT (2021)
FIGURE 27 ASIA-PACIFIC PHYTONUTRIENTS MARKET: BY COUNTRY (2021)
FIGURE 28 ASIA-PACIFIC PHYTONUTRIENTS MARKET: BY COUNTRY (2022 & 2029)
FIGURE 29 ASIA-PACIFIC PHYTONUTRIENTS MARKET: BY COUNTRY (2021 & 2029)
FIGURE 30 ASIA-PACIFIC PHYTONUTRIENTS MARKET: BY TYPE (2022 & 2029)
FIGURE 31 ASIA PACIFIC PHYTONUTRIENTS MARKET: COMPANY SHARE 2021 (%)

Asia Pacific Phytonutrients Market, Supply Chain Analysis and Ecosystem Framework
To support market growth and help clients navigate the impact of geopolitical shifts, DBMR has integrated in-depth supply chain analysis into its Asia Pacific Phytonutrients Market research reports. This addition empowers clients to respond effectively to global changes affecting their industries. The supply chain analysis section includes detailed insights such as Asia Pacific Phytonutrients Market consumption and production by country, price trend analysis, the impact of tariffs and geopolitical developments, and import and export trends by country and HSN code. It also highlights major suppliers with data on production capacity and company profiles, as well as key importers and exporters. In addition to research, DBMR offers specialized supply chain consulting services backed by over a decade of experience, providing solutions like supplier discovery, supplier risk assessment, price trend analysis, impact evaluation of inflation and trade route changes, and comprehensive market trend analysis.
Research Methodology
Data collection and base year analysis are done using data collection modules with large sample sizes. The stage includes obtaining market information or related data through various sources and strategies. It includes examining and planning all the data acquired from the past in advance. It likewise envelops the examination of information inconsistencies seen across different information sources. The market data is analysed and estimated using market statistical and coherent models. Also, market share analysis and key trend analysis are the major success factors in the market report. To know more, please request an analyst call or drop down your inquiry.
The key research methodology used by DBMR research team is data triangulation which involves data mining, analysis of the impact of data variables on the market and primary (industry expert) validation. Data models include Vendor Positioning Grid, Market Time Line Analysis, Market Overview and Guide, Company Positioning Grid, Patent Analysis, Pricing Analysis, Company Market Share Analysis, Standards of Measurement, Global versus Regional and Vendor Share Analysis. To know more about the research methodology, drop in an inquiry to speak to our industry experts.
Customization Available
Data Bridge Market Research is a leader in advanced formative research. We take pride in servicing our existing and new customers with data and analysis that match and suits their goal. The report can be customized to include price trend analysis of target brands understanding the market for additional countries (ask for the list of countries), clinical trial results data, literature review, refurbished market and product base analysis. Market analysis of target competitors can be analyzed from technology-based analysis to market portfolio strategies. We can add as many competitors that you require data about in the format and data style you are looking for. Our team of analysts can also provide you data in crude raw excel files pivot tables (Fact book) or can assist you in creating presentations from the data sets available in the report.


