Asia-Pacific Liquefaction Market Analysis and Insights
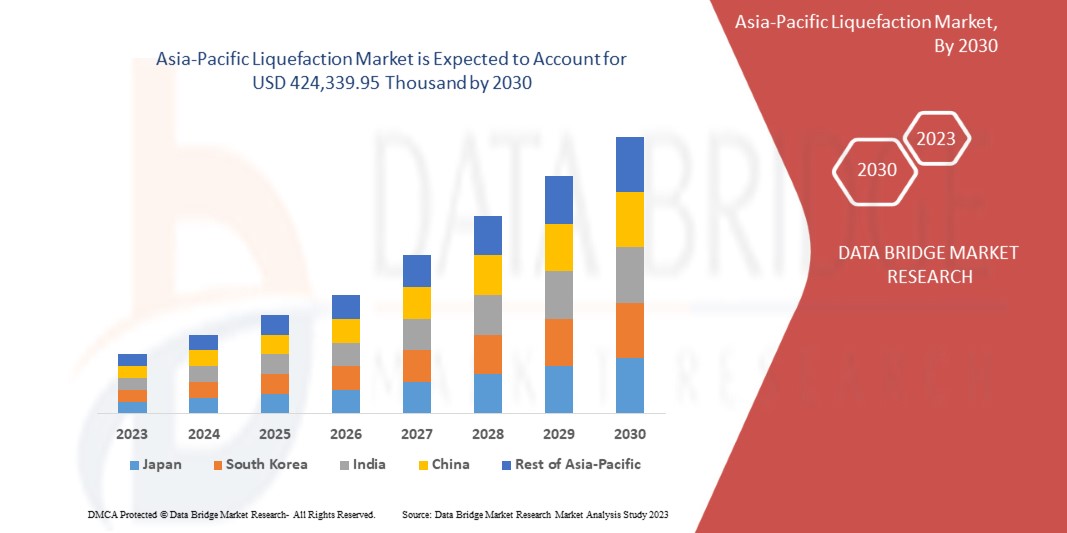
The Asia-Pacific liquefaction market is expected to gain significant growth in the forecast period of 2023 to 2030. Data Bridge Market Research analyzes that the market is growing with a CAGR of 5.9% in the forecast period of 2023 to 2030 and is expected to reach USD 424,339.95 thousand by 2030. The major factor driving the market growth is that people are becoming more environmentally conscious about diesel and gasoline.
Liquefaction is the process of converting a gaseous material into a liquid. This variation is caused by changes in physical variables such as temperature, pressure, and volume. Gas liquefaction is the process of cooling gas to a temperature below its boiling point so that it may be stored and delivered in liquid form.
The Asia-Pacific liquefaction market report provides details of market share, new developments, and the impact of domestic and localized market players, analysis opportunities in terms of emerging revenue pockets, changes in market regulations, products approvals, strategic decisions, product launches, geographic expansions, and technological innovations in the market. To understand the analysis and the market scenario contact us for an Analyst Brief, our team will help you create a revenue impact solution to achieve your desired goal.
|
Report Metric |
Details |
|
Forecast Period |
2023 to 2030 |
|
Base Year |
2022 |
|
Historic Year |
2021 (Customizable to 2020 - 2015) |
|
Quantitative Units |
Revenue in USD Thousand |
|
Segments Covered |
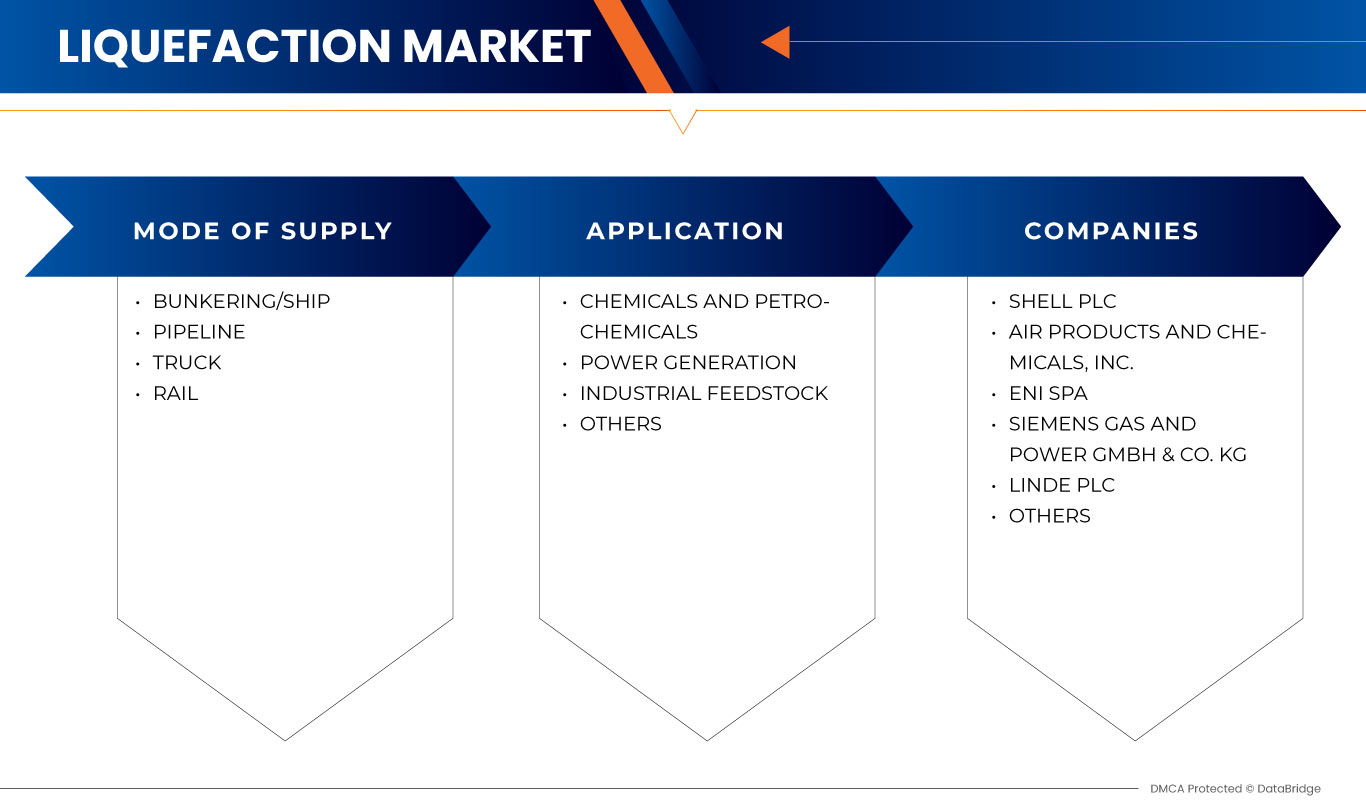
By Mode of Supply (Bunkering/Ship, Pipeline, Truck, and Rail), Application (Chemicals and Petrochemicals, Power Generation, Industrial Feedstock, and Others). |
|
Countries Covered |
Japan, China, South Korea, India, Singapore, Thailand, Indonesia, Malaysia, Philippines, Australia and New Zealand, Rest of Asia-Pacific. |
|
Market Players Covered |
Linde plc, Air Products and Chemicals, Inc., Baker Hughes Company, Shell plc, Honeywell International Inc., Siemens Gas and Power GmbH & Co. KG, ENGIE, Excelerate Energy, Inc., Eni SpA, and Kunlun Energy Company Limited |
Market Definition
Liquefaction is a process that produces liquid from gas and solid compounds. It occurs both artificially and naturally. For instance, the major commercial application of this liquefaction process is the liquefaction of air, which allow the separation of elements such as nitrogen, oxygen, and noble gases.
Asia-Pacific Liquefaction Market Dynamics
This section deals with understanding the market drivers, opportunities, restraints, and challenges. All of this is discussed in detail below:
Drivers
- People are Becoming more Environmentally Conscious about Diesel and Gasoline
Diesel or gasoline emissions have an impact on human health, the environment, Asia-Pacific climate, and environmental justice. Exposure to diesel pollution can cause major health problems such as asthma and respiratory infections, as well as aggravate pre-existing heart and lung disease, particularly in children and the elderly. Diesel engine emissions lead to the formation of ground-level ozone, which harms crops, trees, and other plants. Acid rain is also produced with this emission, which affects land, lakes, and streams and enters the human food chain through water, producing meat and fish.
The harmful consequences of diesel and gasoline cause people to grasp environmental concerns and raise awareness about the environment and the use of diesel and gasoline. This assists them in their hunt for a fuel that has a lower environmental effect than diesel or gasoline. This has prompted businesses to adopt green solutions. Liquefied Natural Gas (LNG) has lately been employed as a diesel and gasoline substitute. It is a clean fuel that offers customers a cost-effective alternative.
- Increasing LNG Demand in Bunkering, Road Transportation, and Off-Grid Power
Over the previous decade, there has been a major increase in industry and urbanization, resulting in an increase in carbon and greenhouse gases Asia-Pacific. To minimize carbon and greenhouse gas emissions, governments are encouraging the use of natural gas in power generation and automotive fuel.
As a result, governments are implementing a variety of policies to encourage the use of CNG and LNG-powered cars, such as offering subsidies and tax breaks to automakers and customers. As a result, Asia-Pacific natural gas consumption has grown in the recent decade. As a result, its use in bunkering, power generation, and road transportation is rising.
- Expansion of Research and Development (R&D) Activities
LNG is utilized for transporting natural gas to distant markets. However, the high costs of production, transportation, and storage have limited the expansion of LNG technology to certain circumstances when there are no other cheaper means to transport the NG. However, market and political challenges surrounding NG are growing interest in this alternative transportation technology, which has the advantage of expanding possible markets for sellers and prospective suppliers for buyers. The expanding interest has resulted in ever-increasing expenditures in LNG R&D, as well as its uses.
Pretreatments, acid gas removal, dehydration, and liquefaction are the four steps of an LNG plant. The R&D activities are primarily focused on the liquefaction stage, with the goal of introducing technologies that can minimize energy consumption and increase liquefaction process efficiency. The primary liquefaction process and inventions include the C3-MR technique, AP-X method, Cascade method, and Double Mixed Refrigerant (DMR) method. Because all of these designs consume a significant amount of energy (mostly for refrigeration compressors), increasing R&D efforts are being directed toward process optimization. The primary R&D activities are focused on the design and optimization of cryogenic heat exchangers, the enhancement of refrigerant compressors, and the efficiency of compressor drivers.
In LNG transportation technologies, two vessel technologies are used: the Floating Storage Unit (FSU) and the Floating Storage and Regasification Unit (FSRU). The sector's R&D is primarily focused on improving FSRU performance and lowering prices, making the FSRU an appealing fast-track option for small markets and emerging nations.
- Expanding Both Offshore and Onshore Building Activity
The contemporary world's offshore and onshore building operations are developing as the number of projects grows. More liquefaction projects are being developed.
Floating liquefied natural gas (FLNG) systems are a relatively recent LNG industry technology. They are used to liquefy natural gas generated from offshore fields that are too far offshore for onshore liquefaction. FLNG systems are water-based boats that are placed over an underwater natural gas field. FLNG systems, in general, generate, process, liquefy, store, and transfer LNG to Asia-Pacific markets by carrier ship or to onshore infrastructure that transfers the gas to domestic markets. FSRUs are specialized ships or offshore vessels that collect, store, and evaporate LNG to supply fuel for power production, feedstock for industrial processes, heat for residential and commercial buildings, and other end-uses.
OPPORTUNITIES
- Emerging New Projects of Liquefaction
In recent years, investment choices in LNG liquefaction plants are growing, paving the way for worldwide capacity to expand more. Much of this investment has been fueled by contract structure trends that allow developers to meet project milestones at a faster rate than in the past. This is due to sustained demand growth generated by rising economies, as well as an increase in market participants.
Long-term market confidence has been critical in supporting these decisions since a liquefaction project might take ten years or more from early planning to first gas supplies to market. Investment milestones are crucial for projects that have progressed beyond the planning stage if they intend to capture medium-term demand and beyond. Investors have been keen to accelerate activity and authorize projects in a market with several competing projects before this window of opportunity expires.
This significant surge in LNG investment over the last two years has also coincided with a change away from traditional methods of establishing LNG liquefaction plants. Developers take FID under classic offtake models once project offtake is secured through long-term supply contracts with third parties. This traditional technique offers investor trust, but organizing offtake for an entire project with various counterparties is time-consuming and costly for developers.
- Rising Applications of Liquefaction
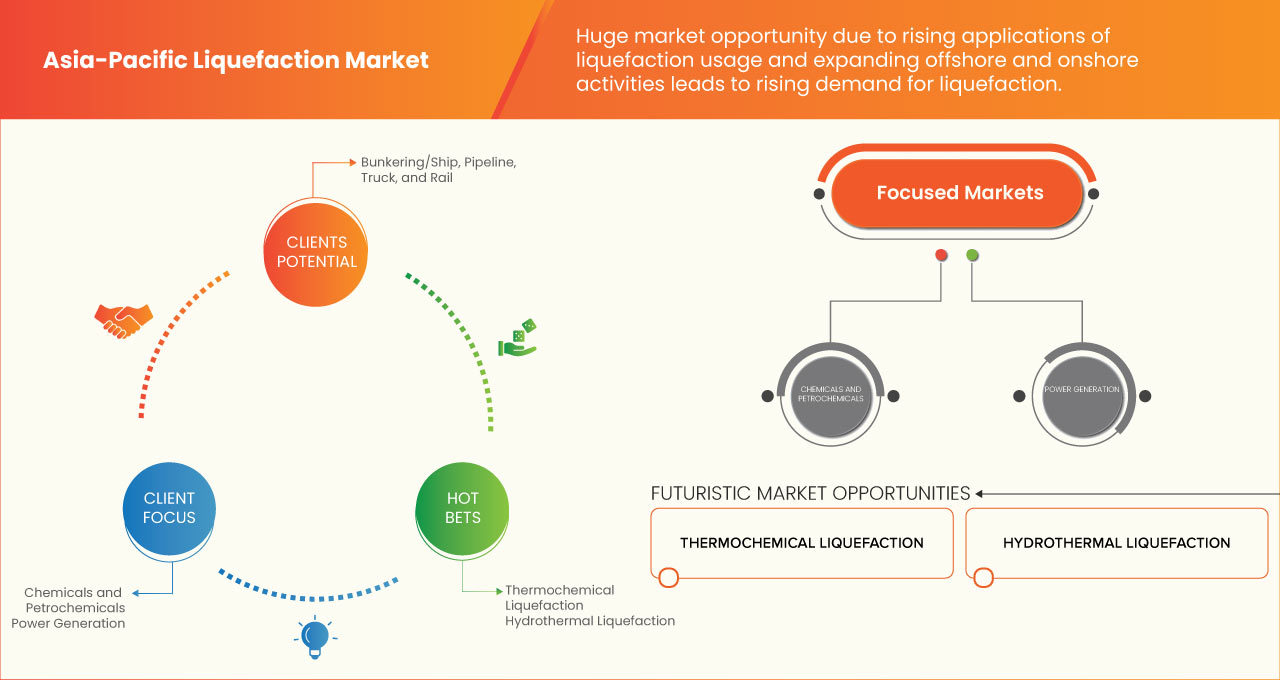
The process of converting a gas to a liquid is known as liquefaction. Liquefaction is a significant economic process since liquid chemicals take up considerably less space than gaseous substances. Liquefied gases are most commonly utilized in the compact storage and transfer of combustible fuels used for heating, cooking, or powering motor vehicles. For this reason, two types of liquefied gases are frequently employed commercially: Liquefied Natural Gas (LNG) and Liquefied Petroleum Gas (LPG). LPG is a liquid-state combination of gases derived from natural gas or petroleum. The combination is kept in containers that can sustain extremely high pressures. LNG is similar to LPG in that practically has every composition such as propane and butane except methane. LNG and LPG have numerous applications in common.
Liquefied gases and liquefaction procedures are employed in a range of operations in various industries such as medicinal, industrial, scientific, and so on. Preservation of Biosamples, such as freezing the sperm using liquid nitrogen, or using liquid oxygen in hospitals to offer patients with respiratory issues a healthier breath. Aqualung devices can employ a mix of liquid oxygen and liquid nitrogen.
Gas liquefaction is utilized in refrigeration systems. Liquid ammonia is used to chill ice plants. The liquid oxygen and hydrogen generated by the gas liquefaction technique are utilized in rocket propellants. Gases may be easily stored and transported using this method. For example, in air conditioning systems where stored liquid gas, such as R-290 or R-600A, is utilized as a refrigerant. In the industrial sector, liquid acetylene and liquid oxygen can be utilized for welding. Liquefaction of gases is also essential in the realm of cryogenics research. Liquid helium is commonly employed in the research of matter's behavior at temperatures near absolute zero, 0 K (zero Kelvin).
Currently, liquefied hydrogen is mostly employed in space applications and the semiconductor sector. While renewable energy applications, such as the automotive sector, presently provide just a tiny portion of this demand, their need may experience a major increase in the coming years, with the requirement for large-scale liquefaction facilities well exceeding the existing plant sizes.
RESTRAINTS/CHALLENGES
- Limited Liquefied Natural Gas (LNG) Receiving
LNG is playing an increasingly essential role in the worldwide natural gas market. Natural gas consumption will rise Asia-Pacific in the next few years. Ships transfer LNG to unloading stations at storage depots. Some LNG evaporates into the gas phase during the storage stages. Boil-off gas is the name given to evaporate LNG (BOG). LNG is kept in cryogenic storage. The evaporation process is influenced by heat flow. It shows that a tiny proportion or portion of LNG is continuously boiling out as a result of heat during the storage procedure. Increased evaporation may have a detrimental impact on the LNG storage process's stability and safety. Due to LNG storage concerns, remote locations, and rising costs, there is a scarcity of LNG-receiving terminal infrastructure.
- Strict Liquefaction Regulations and Standards
The process of converting a gas to a liquid is known as liquefaction. The products of liquefied gases are less harmful to the environment. It is also necessary to consider specific aspects such as how they are manufactured, stored, and transported, as well as the potential harm that liquefied gaseous goods might cause. All of them are carried out by each government or country throughout the world, which has established tight laws, guidelines, and standards for their regulated use without causing harm to the environment or people.
Asia-Pacific Liquefaction Market Scope
The Asia-Pacific liquefaction market is segmented into two notable segments based on mode of supply and application. The growth amongst these segments will help you analyze major growth segments in the industries and provide the users with a valuable market overview and market insights to make strategic decisions to identify core market applications.
Mode of Supply
- Bunkering/Ship
- Pipeline
- Truck
- Rail
Based on mode of supply, the market is segmented into bunkering/ship, pipeline, truck, and rail.
Application
- Chemicals and Petrochemicals
- Power Generation
- Industrial Feedstock
- Others
Based on application, the market is segmented into chemicals and petrochemicals, power generation, industrial feedstock, and others.
Asia-Pacific Liquefaction Market Regional Analysis/Insights
The Asia-Pacific liquefaction market is segmented into two notable segments based on mode of supply and application.
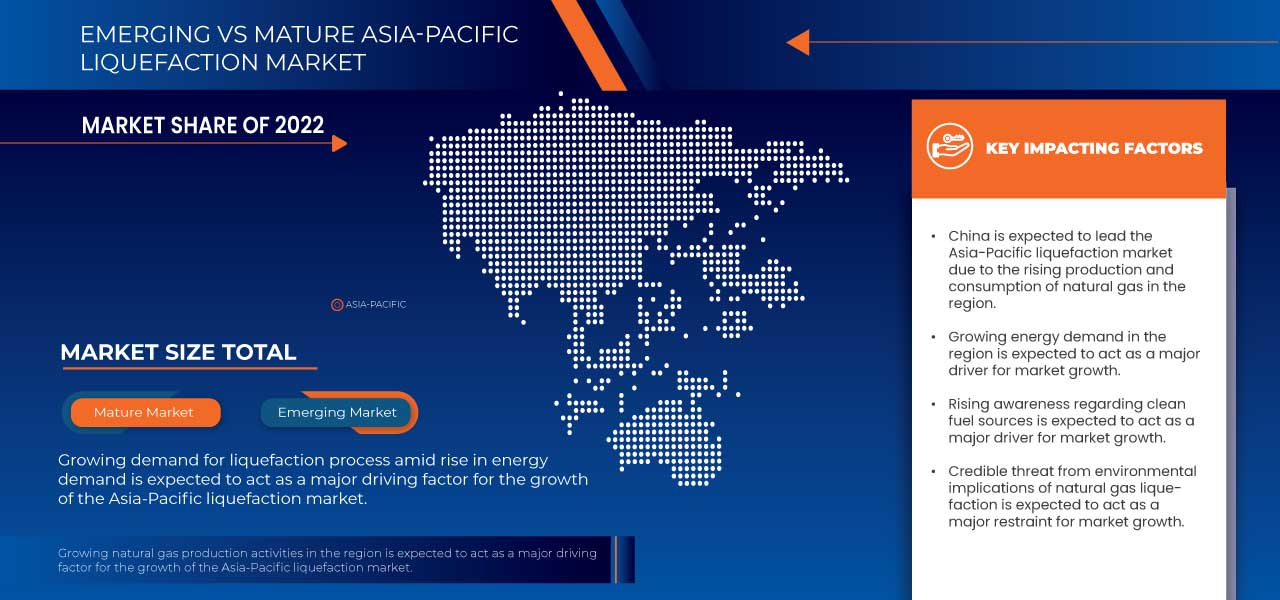
The countries covered in the Asia-Pacific liquefaction market are Japan, China, South Korea, India, Singapore, Thailand, Indonesia, Malaysia, Philippines, Australia and New Zealand, and rest of Asia-Pacific. China is dominating the Asia-Pacific liquefaction market in terms of market share and market revenue as people are becoming more environmentally conscious about diesel and gasoline.
The country section of the report also provides individual market-impacting factors and changes in market regulation that impact the current and future trends of the market. Data points downstream and upstream value chain analysis, technical trends, porter's five forces analysis, and case studies are some of the pointers used to forecast the market scenario for individual countries. Also, the presence and availability of Asia-Pacific brands and their challenges faced due to large or scarce competition from local and domestic brands, the impact of domestic tariffs, and trade routes are considered while providing forecast analysis of the country data.
Competitive Landscape and Asia-Pacific Liquefaction Market Share Analysis
Asia-Pacific liquefaction market competitive landscape provides details of competitors. Details included are company overview, company financials, revenue generated, market potential, investment in research and development, new market initiatives, production sites and facilities, company strengths and weaknesses, product launch, product approvals, patents, product width and breadth, application dominance, and product lifeline curve. The above data points provided are only related to the companies’ focus related to the market.
Some of the prominent participants operating in the Asia-Pacific liquefaction market are Linde plc, Air Products and Chemicals, Inc., Baker Hughes Company, Shell plc, Honeywell International Inc., Siemens Gas and Power GmbH & Co. KG, ENGIE, Excelerate Energy, Inc., Eni SpA, and Kunlun Energy Company Limited.
SKU-
Get online access to the report on the World's First Market Intelligence Cloud
- Interactive Data Analysis Dashboard
- Company Analysis Dashboard for high growth potential opportunities
- Research Analyst Access for customization & queries
- Competitor Analysis with Interactive dashboard
- Latest News, Updates & Trend analysis
- Harness the Power of Benchmark Analysis for Comprehensive Competitor Tracking
Table of Content
1 INTRODUCTION
1.1 OBJECTIVES OF THE STUDY
1.2 MARKET DEFINITION
1.3 OVERVIEW
1.4 LIMITATION
1.5 MARKETS COVERED
2 MARKET SEGMENTATION
2.1 MARKETS COVERED
2.2 GEOGRAPHICAL SCOPE
2.3 YEARS CONSIDERED FOR THE STUDY
2.4 CURRENCY AND PRICING
2.5 DBMR TRIPOD DATA VALIDATION MODEL
2.6 MODE OF SUPPLY LIFELINE CURVE
2.7 MULTIVARIATE MODELING
2.8 PRIMARY INTERVIEWS WITH KEY OPINION LEADERS
2.9 DBMR MARKET POSITION GRID
2.1 MARKET APPLICATION COVERAGE GRID
2.2 DBMR MARKET CHALLENGE MATRIX
2.3 DBMR VENDOR SHARE ANALYSIS
2.4 SECONDARY SOURCES
2.5 ASSUMPTIONS
3 EXECUTIVE SUMMARY
4 PREMIUM INSIGHTS
5 MARKET OVERVIEW
5.1 DRIVERS
5.1.1 PEOPLE ARE BECOMING MORE ENVIRONMENTALLY CONSCIOUS ABOUT DIESEL AND GASOLINE
5.1.2 INCREASING LNG DEMAND IN BUNKERING, ROAD TRANSPORTATION, AND OFF-GRID POWER
5.1.3 EXPANSION OF RESEARCH AND DEVELOPMENT (R&D) ACTIVITIES
5.1.4 EXPANDING BOTH OFFSHORE AND ONSHORE BUILDING ACTIVITY
5.2 RESTRAINTS
5.2.1 LIMITED LIQUEFIED NATURAL GAS (LNG) RECEIVING
5.2.2 ENVIRONMENTAL IMPLICATIONS OF NATURAL GAS LIQUEFACTION
5.3 OPPORTUNITIES
5.3.1 EMERGING NEW PROJECTS OF LIQUEFACTION
5.3.2 RISING APPLICATIONS OF LIQUEFACTION
5.4 CHALLENGES
5.4.1 STRICT LIQUEFACTION REGULATIONS AND STANDARDS
5.4.2 KEY ISSUES AND CHALLENGES OF LIQUEFACTION
6 ASIA PACIFIC LIQUEFACTION MARKET, BY MODE OF SUPPLY
6.1 OVERVIEW
6.2 BUNKERING/SHIP
6.3 PIPELINE
6.4 TRUCK
6.5 RAIL
7 ASIA PACIFIC LIQUEFACTION MARKET, BY APPLICATION
7.1 OVERVIEW
7.2 CHEMICALS AND PETROCHEMICALS
7.3 POWER GENERATION
7.4 INDUSTRIAL FEEDSTOCK
7.5 OTHERS
8 ASIA PACIFIC LIQUEFACTION MARKET, BY REGION
8.1 ASIA-PACIFIC
8.1.1 CHINA
8.1.2 JAPAN
8.1.3 INDIA
8.1.4 SOUTH KOREA
8.1.5 AUSTRALIA AND NEW ZEALAND
8.1.6 INDONESIA
8.1.7 THAILAND
8.1.8 SINGAPORE
8.1.9 MALAYSIA
8.1.10 PHILIPPINES
8.1.11 REST OF ASIA-PACIFIC
9 ASIA PACIFIC LIQUEFACTION MARKET: COMPANY LANDSCAPE
9.1 COMPANY SHARE ANALYSIS: ASIA PACIFIC
9.2 PRODUCT LAUNCH
9.3 PARTNERSHIP
9.4 COLLABORATIONS
9.5 RECOGNITIONS
9.6 ACHIEVEMENTS
9.7 AGREEMENTS
9.8 INITIATE OPERATIONS
10 SWOT ANALYSIS
11 COMPANY PROFILES
11.1 SHELL PLC
11.1.1 COMPANY SNAPSHOT
11.1.2 REVENUE ANALYSIS
11.1.3 COMPANY SHARE ANALYSIS
11.1.4 PRODUCT PORTFOLIO
11.1.5 RECENT DEVELOPMENT
11.2 AIR PRODUCTS AND CHEMICLAS, INC.
11.2.1 COMPANY SNAPSHOT
11.2.2 REVENUE ANALYSIS
11.2.3 COMPANY SHARE ANALYSIS
11.2.4 PRODUCT PORTFOLIO
11.2.5 RECENT DEVELOPMENTS
11.3 ENI SPA
11.3.1 COMPANY SNAPSHOT
11.3.2 REVENUE ANALYSIS
11.3.3 COMPANY SHARE ANALYSIS
11.3.4 PRODUCT PORTFOLIO
11.3.5 RECENT DEVELOPMENTS
11.4 SIEMENS GAS AND POWER GMBH & CO. KG
11.4.1 COMPANY SNAPSHOT
11.4.2 REVENUE ANALYSIS
11.4.3 COMPANY SHARE ANALYSIS
11.4.4 PRODUCT PORTFOLIO
11.4.5 RECENT DEVELOPMENTS
11.5 LINDE PLC
11.5.1 COMPANY SNAPSHOT
11.5.2 REVENUE ANALYSIS
11.5.3 COMPANY SHARE ANALYSIS
11.5.4 PRODUCT PORTFOLIO
11.5.5 RECENT DEVELOPMENT
11.6 BAKER HUGHES COMPANY
11.6.1 COMPANY SNAPSHOT
11.6.2 REVENUE ANALYSIS
11.6.3 PRODUCT PORTFOLIO
11.6.4 RECENT DEVELOPMENT
11.7 ENGIE
11.7.1 COMPANY SNAPSHOT
11.7.2 REVENUE ANALYSIS
11.7.3 PRODUCT PORTFOLIO
11.7.4 RECENT DEVELOPMENT
11.8 EXCELERATE ENERGY, INC.
11.8.1 COMPANY SNAPSHOT
11.8.2 PRODUCT PORTFOLIO
11.8.3 RECENT DEVELOPMENTS
11.9 HONEYWELL INTERNATIONAL INC. (2022)
11.9.1 COMPANY SNAPSHOT
11.9.2 REVENUE ANALYSIS
11.9.3 PRODUCT PORTFOLIO
11.9.4 RECENT DEVELOPMENT
11.1 KUNLUN ENERGY COMPANY LIMITED
11.10.1 COMPANY SNAPSHOT
11.10.2 REVENUE ANALYSIS
11.10.3 PRODUCT PORTFOLIO
11.10.4 RECENT DEVELOPMENT
12 QUESTIONNAIRE
13 RELATED REPORTS
List of Table
TABLE 1 ASIA PACIFIC LIQUEFACTION MARKET, BY MODE OF SUPPLY, 2021-2030 (USD THOUSAND)
TABLE 2 ASIA PACIFIC BUNKERING/SHIP IN LIQUEFACTION MARKET, BY REGION, 2021-2030 (USD THOUSAND)
TABLE 3 ASIA PACIFIC PIPELINE IN LIQUEFACTION MARKET, BY REGION, 2021-2030 (USD THOUSAND)
TABLE 4 ASIA PACIFIC TRUCK IN LIQUEFACTION MARKET, BY REGION, 2021-2030 (USD THOUSAND)
TABLE 5 ASIA PACIFIC RAIL IN LIQUEFACTION MARKET, BY REGION, 2021-2030 (USD THOUSAND)
TABLE 6 ASIA PACIFIC LIQUEFACTION MARKET, BY APPLICATION, 2021-2030 (USD THOUSAND)
TABLE 7 ASIA PACIFIC CHEMICALS AND PETROCHEMICALS IN LIQUEFACTION MARKET, BY REGION, 2021-2030 (USD THOUSAND)
TABLE 8 ASIA PACIFIC POWER GENERATION IN LIQUEFACTION MARKET, BY REGION, 2021-2030 (USD THOUSAND)
TABLE 9 ASIA PACIFIC INDUSTRIAL FEEDSTOCK IN LIQUEFACTION MARKET, BY REGION, 2021-2030 (USD THOUSAND)
TABLE 10 ASIA PACIFIC OTHERS IN LIQUEFACTION MARKET, BY REGION, 2021-2030 (USD THOUSAND)
TABLE 11 ASIA-PACIFIC LIQUEFACTION MARKET, BY COUNTRY, 2021-2030 (USD THOUSAND)
TABLE 12 ASIA-PACIFIC LIQUEFACTION MARKET, BY MODE OF SUPPLY, 2021-2030 (USD THOUSAND)
TABLE 13 ASIA-PACIFIC LIQUEFACTION MARKET, BY APPLICATION, 2021-2030 (USD THOUSAND)
TABLE 14 CHINA LIQUEFACTION MARKET, BY MODE OF SUPPLY, 2021-2030 (USD THOUSAND)
TABLE 15 CHINA LIQUEFACTION MARKET, BY APPLICATION, 2021-2030 (USD THOUSAND)
TABLE 16 JAPAN LIQUEFACTION MARKET, BY MODE OF SUPPLY, 2021-2030 (USD THOUSAND)
TABLE 17 JAPAN LIQUEFACTION MARKET, BY APPLICATION, 2021-2030 (USD THOUSAND)
TABLE 18 INDIA LIQUEFACTION MARKET, BY MODE OF SUPPLY, 2021-2030 (USD THOUSAND)
TABLE 19 INDIA LIQUEFACTION MARKET, BY APPLICATION, 2021-2030 (USD THOUSAND)
TABLE 20 SOUTH KOREA LIQUEFACTION MARKET, BY MODE OF SUPPLY, 2021-2030 (USD THOUSAND)
TABLE 21 SOUTH KOREA LIQUEFACTION MARKET, BY APPLICATION, 2021-2030 (USD THOUSAND)
TABLE 22 AUSTRALIA AND NEW ZEALAND LIQUEFACTION MARKET, BY MODE OF SUPPLY, 2021-2030 (USD THOUSAND)
TABLE 23 AUSTRALIA AND NEW ZEALAND LIQUEFACTION MARKET, BY APPLICATION, 2021-2030 (USD THOUSAND)
TABLE 24 INDONESIA LIQUEFACTION MARKET, BY MODE OF SUPPLY, 2021-2030 (USD THOUSAND)
TABLE 25 INDONESIA LIQUEFACTION MARKET, BY APPLICATION, 2021-2030 (USD THOUSAND)
TABLE 26 THAILAND LIQUEFACTION MARKET, BY MODE OF SUPPLY, 2021-2030 (USD THOUSAND)
TABLE 27 THAILAND LIQUEFACTION MARKET, BY APPLICATION, 2021-2030 (USD THOUSAND)
TABLE 28 SINGAPORE LIQUEFACTION MARKET, BY MODE OF SUPPLY, 2021-2030 (USD THOUSAND)
TABLE 29 SINGAPORE LIQUEFACTION MARKET, BY APPLICATION, 2021-2030 (USD THOUSAND)
TABLE 30 MALAYSIA LIQUEFACTION MARKET, BY MODE OF SUPPLY, 2021-2030 (USD THOUSAND)
TABLE 31 MALAYSIA LIQUEFACTION MARKET, BY APPLICATION, 2021-2030 (USD THOUSAND)
TABLE 32 PHILIPPINES LIQUEFACTION MARKET, BY MODE OF SUPPLY, 2021-2030 (USD THOUSAND)
TABLE 33 PHILIPPINES LIQUEFACTION MARKET, BY APPLICATION, 2021-2030 (USD THOUSAND)
TABLE 34 REST OF ASIA-PACIFIC LIQUEFACTION MARKET, BY MODE OF SUPPLY, 2021-2030 (USD THOUSAND)
List of Figure
FIGURE 1 ASIA PACIFIC LIQUEFACTION MARKET: SEGMENTATION
FIGURE 2 ASIA PACIFIC LIQUEFACTION MARKET: DATA TRIANGULATION
FIGURE 3 ASIA PACIFIC LIQUEFACTION MARKET: DROC ANALYSIS
FIGURE 4 ASIA PACIFIC LIQUEFACTION MARKET: ASIA PACIFIC VS REGIONAL MARKET ANALYSIS
FIGURE 5 ASIA PACIFIC LIQUEFACTION MARKET: COMPANY RESEARCH ANALYSIS
FIGURE 6 ASIA PACIFIC LIQUEFACTION MARKET: THE MODE OF SUPPLY LIFE LINE CURVE
FIGURE 7 ASIA PACIFIC LIQUEFACTION MARKET: MULTIVARIATE MODELLING
FIGURE 8 ASIA PACIFIC LIQUEFACTION MARKET: INTERVIEW DEMOGRAPHICS
FIGURE 9 ASIA PACIFIC LIQUEFACTION MARKET: DBMR MARKET POSITION GRID
FIGURE 10 ASIA PACIFIC LIQUEFACTION MARKET: MARKET APPLICATION COVERAGE GRID
FIGURE 11 ASIA PACIFIC LIQUEFACTION MARKET: THE MARKET CHALLENGE MATRIX
FIGURE 12 ASIA PACIFIC LIQUEFACTION MARKET: VENDOR SHARE ANALYSIS
FIGURE 13 ASIA PACIFIC LIQUEFACTION MARKET: SEGMENTATION
FIGURE 14 PEOPLE ARE BECOMING MORE ENVIRONMENTALLY CONSCIOUS ABOUT DIESEL AND GASOLINE, WHICH IS EXPECTED TO DRIVE THE GROWTH OF THE ASIA PACIFIC LIQUEFACTION MARKET IN THE FORECAST PERIOD
FIGURE 15 THE BUNKERING/SHIP SEGMENT IS EXPECTED TO ACCOUNT FOR THE LARGEST MARKET SHARE OF THE ASIA PACIFIC LIQUEFACTION MARKET IN 2023 AND 2030
FIGURE 16 DRIVERS, RESTRAINTS, OPPORTUNITIES, AND CHALLENGES OF THE ASIA PACIFIC LIQUEFACTION MARKET
FIGURE 17 ASIA PACIFIC LIQUEFACTION MARKET: BY MODE OF SUPPLY, 2022
FIGURE 18 ASIA PACIFIC LIQUEFACTION MARKET: BY APPLICATION, 2022
FIGURE 19 ASIA-PACIFIC LIQUEFACTION MARKET, BY SNAPSHOT (2022)
FIGURE 20 ASIA-PACIFIC LIQUEFACTION MARKET, BY COUNTRY (2022)
FIGURE 21 ASIA-PACIFIC LIQUEFACTION MARKET, BY COUNTRY (2023 & 2030)
FIGURE 22 ASIA-PACIFIC LIQUEFACTION MARKET, BY COUNTRY (2022 & 2030)
FIGURE 23 ASIA-PACIFIC LIQUEFACTION MARKET, BY MODE OF SUPPLY (2022 - 2030)
FIGURE 24 ASIA PACIFIC LIQUEFACTION MARKET: COMPANY SHARE 2022 (%)

Asia Pacific Liquefaction Market, Supply Chain Analysis and Ecosystem Framework
To support market growth and help clients navigate the impact of geopolitical shifts, DBMR has integrated in-depth supply chain analysis into its Asia Pacific Liquefaction Market research reports. This addition empowers clients to respond effectively to global changes affecting their industries. The supply chain analysis section includes detailed insights such as Asia Pacific Liquefaction Market consumption and production by country, price trend analysis, the impact of tariffs and geopolitical developments, and import and export trends by country and HSN code. It also highlights major suppliers with data on production capacity and company profiles, as well as key importers and exporters. In addition to research, DBMR offers specialized supply chain consulting services backed by over a decade of experience, providing solutions like supplier discovery, supplier risk assessment, price trend analysis, impact evaluation of inflation and trade route changes, and comprehensive market trend analysis.
Research Methodology
Data collection and base year analysis are done using data collection modules with large sample sizes. The stage includes obtaining market information or related data through various sources and strategies. It includes examining and planning all the data acquired from the past in advance. It likewise envelops the examination of information inconsistencies seen across different information sources. The market data is analysed and estimated using market statistical and coherent models. Also, market share analysis and key trend analysis are the major success factors in the market report. To know more, please request an analyst call or drop down your inquiry.
The key research methodology used by DBMR research team is data triangulation which involves data mining, analysis of the impact of data variables on the market and primary (industry expert) validation. Data models include Vendor Positioning Grid, Market Time Line Analysis, Market Overview and Guide, Company Positioning Grid, Patent Analysis, Pricing Analysis, Company Market Share Analysis, Standards of Measurement, Global versus Regional and Vendor Share Analysis. To know more about the research methodology, drop in an inquiry to speak to our industry experts.
Customization Available
Data Bridge Market Research is a leader in advanced formative research. We take pride in servicing our existing and new customers with data and analysis that match and suits their goal. The report can be customized to include price trend analysis of target brands understanding the market for additional countries (ask for the list of countries), clinical trial results data, literature review, refurbished market and product base analysis. Market analysis of target competitors can be analyzed from technology-based analysis to market portfolio strategies. We can add as many competitors that you require data about in the format and data style you are looking for. Our team of analysts can also provide you data in crude raw excel files pivot tables (Fact book) or can assist you in creating presentations from the data sets available in the report.


