Market Analysis and Insights
Asia-Pacific age-related macular degeneration (AMD) disease market is driven by the factors such as, rising geriatric population, increase in the prevalence of age-related macular degeneration (AMD) disease and increasing pipeline products which enhance its demand as well as increasing investment in research and development leads to the market growth. Currently, healthcare expenditure has increased across developed and emerging countries that is expected to create a competitive advantage for manufacturers to develop new and innovative products.
The prevalence of age-related macular degeneration, is expected to increase in developed countries due to the aging population and rising life expectancy. It is estimated that nearly 60% of patients have severe visual impairment occurring disease shortly after birth. This disease leads to blurring central vision in the patient’s eye. The demand for age-related macular degeneration (AMD) disease treatment and diagnostic has been increased more in the developed countries. However, the high cost associated with the treatment and procedure as well as stringent government regulations for product approval are expected to hamper the growth for age-related macular degeneration (AMD) disease market.
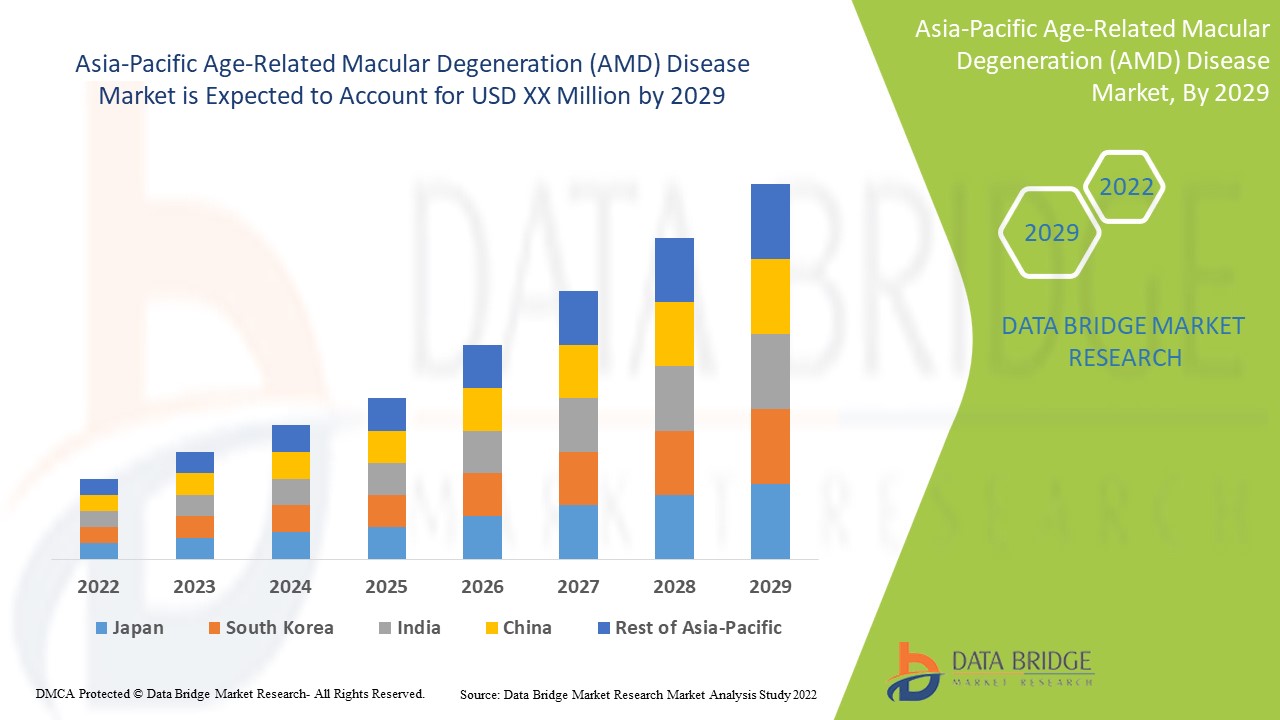
Asia-Pacific age-related macular degeneration (AMD) disease market is supportive and aims to reduce the progression of the disease. Data Bridge Market Research analyses that Asia-Pacific age-related macular degeneration (AMD) disease market will grow at a CAGR of 7.2% during the forecast period of 2022 to 2029.
|
Report Metric |
Details |
|
Forecast Period |
2022 to 2029 |
|
Base Year |
2021 |
|
Historic Year |
2020 (Customizable to 2019 - 2014) |
|
Quantitative Units |
Revenue in USD Million |
|
Segments Covered |
By Type (Dry AMD and Wet AMD) End User(Hospitals, Specialty Clinics, Ambulatory Surgical Centers, Home Healthcare and Others), Distribution Channel(Direct Tender and Retail Sales) Industry Trends and Forecast to 2029 |
|
Countries Covered |
By Country (China, India, South Korea, Australia, Singapore, Malaysia, Thailand, Indonesia, Philippines, Vietnam, Rest of Asia-Pacific) Industry Trends and Forecast to 2029 |
|
Market Players Covered |
Novartis AG, Bayer AG, Astellas Pharma Inc., Ionis Pharmaceutics, Johnson & Johnson Services, Inc, among others |
Market Definition
Age-related macular degeneration (AMD) is an eye disease that can cause damage to the macula part of the eye that controls sharp and straight-ahead vision. This leads to blurring central vision. Vision loss can be caused by abnormal blood vessel growth. Sometimes abnormal new blood vessels grow from the choroid under and into the macula. The choroid is the layer of blood vessels between the retina and the outer, firm coat of the eye (sclera). These abnormal blood vessels may leak fluid or blood, interfering with the retina's function. Macular degeneration is common in aging people. Other reasons for the rising of procedures can be defined by the increasing aging people causes and the requirement for healthcare facilities, including treatment for patient-friendly techniques for diagnosis where the medical requirements are maximum, which can further decrease the burden on healthcare facilities.
The diagnosis and treatment of age-related macular degeneration (AMD) disease consist of various techniques that allow diagnosis of the disease after the approval of the product. The treatment for the disease is recently approved, which supports the market growth. However, these treatments are expensive and not available to all patients.
Asia-Pacific Age-Related Macular Degeneration (AMD) Disease Market Dynamics
Drivers
- Rising geriatric population
The world’s geriatric population is increasing at a rapid rate. With the increasing age comes a reciprocal increase in the number of elderly patients due to the rising prevalence of chronic disease. Age is a severe risk factor for any disease progression as age is an essential parameter that affects fundamental biological mechanisms. Therefore, aging is one of the risk factors for the Asia-Pacific incidence of early AMD.Age-related macular degeneration (AMD) can cause damage to the macula part of the eye. This leads to blur central vision. It can cause irreversible blindness and is the leading cause of visual impairment in the elderly people.
Macular degeneration is more common in aging people. The diagnosis of disease is possible at various stages and number of genetic testing and retinal imaging are some of the techniques for the detection of disease. The diagnosis of the disease is conducted mainly by optical imaging techniques and other standard process. Thus, the increasing rate of the geriatric population is expected to drive the growth of the Asia-Pacific age-related macular degeneration (AMD) disease market growth.
- Increasing Prevalence of Age-Related Macular Degeneration (AMD) Disease
The demand for age-related macular degeneration (AMD) disease treatment and diagnostic has been increased more in the developed countries. These countries had reimbursement policies for age-related macular degeneration (AMD) disease market along with that increasing prevalence of genetic diseases.
Thus, it signifies that increasing prevalence of age-related macular degeneration (AMD) disease is expected to drive the Asia-Pacific age-related macular degeneration (AMD) disease market growth.
Opportunity
- Rising Research and Development
Research and development is a prerequisite to modifying the treatment intended to treat different kinds of patients. The demand for age-related macular degeneration (AMD) treatment and procedures increasing worldwide involving every country Asia-Pacific. This is why the companies are continuously focusing on research and development in order to achieve success in providing effective treatment to patients and healthcare workers.
The effects can be seen only for individuals in certain ways that include effective potentiating factors such as the disease evolves, vision becomes progressively more compromised, the retinal tissue degenerates, and suffering permanent damage.
As the companies are constantly engaged in developmental activities more innovative products are launched in the market. This thus signifies that increasing research and development is expected as an opportunity for the Asia-Pacific age-related macular degeneration (AMD) disease growth. The various programs and decisions taken by the government around the world for giving the best treatment to their population is the major factor that is expected to increase the demand and will act as an opportunity for the Asia-Pacific age-related macular degeneration (AMD) disease market.
Restraint/Challenge
- High cost of aesthetic surgical procedures
The cost of the product plays a major factor in the market. In the age-related macular degeneration (AMD) disease, it is generally observed that they are highly sophisticated, need to be precise, and other specifications increase the product's cost. Moreover, the cost associated with treatment for a longer duration is quite difficult for an average-income person to afford. Utilizations of critical care and intensive care unit services are increasing worldwide, along with their expensive cost is a major concern in the current healthcare system.
Patients with degeneration disorder are commonly required to have long treatment with frequent monetarization and other usage leading to consuming a significant amount of healthcare resources. Due to this, most patients who cannot afford long-term economic costs get discharged in the initial stages of treatment. But this increases the possibilities and susceptibilities for new complications in the diagnosis which demands additional healthcare resources and treatment. As the cost of innovative and advanced products is high, the cost of the treatment proportionally gets escalated, due to which high cost associated with age-related macular degeneration (AMD) disease treatment and diagnosis is expected to restrain the Asia-Pacific age-related macular degeneration (AMD) disease market growth.
Recent Developments
- In January 2022, Genentech, Inc announced that the U.S. Food and Drug Administration (FDA) has approved Vabysmo (faricimab-svoa) for the treatment of wet AMD and DME.This will help the company to commercialize the product in the market in the forecast period.
- In April 2022, Graybug Vision Inc. announced that the company has presented a poster presentation preclinical data at the Association for Research in Vision and Ophthalmology (ARVO) annual meeting for GB-401 in primary open-angle glaucoma (POAG). This will increase the chances for safety and evaluation of drug in the market.
Asia-Pacific Age-related Macular Degeneration (AMD) Disease Market Segmentation
Asia-Pacific age-related macular degeneration (AMD) disease market is categorized into is categorized into three notable segments which are based on type, end user and distribution channel. The growth among segments helps you analyses niche pockets of growth and strategies to approach the market and determine your core application areas and the difference in your target markets.
Type
- Dry AMD
- Wet AMD
On the basis of type, the Asia-Pacific age-related macular degeneration (AMD) disease market is segmented into dry AMD and wet AMD.
End User
- Hospitals
- Specialty Clinics
- Ambulatory Surgical Centers
- Home Healthcare
- Others
On the basis of end user, the Asia-Pacific age-related macular degeneration (AMD) disease market is segmented into hospitals, specialty clinics, ambulatory surgical centers, home healthcare and others.
Distribution Channel
- Retail Sales
- Direct Tender
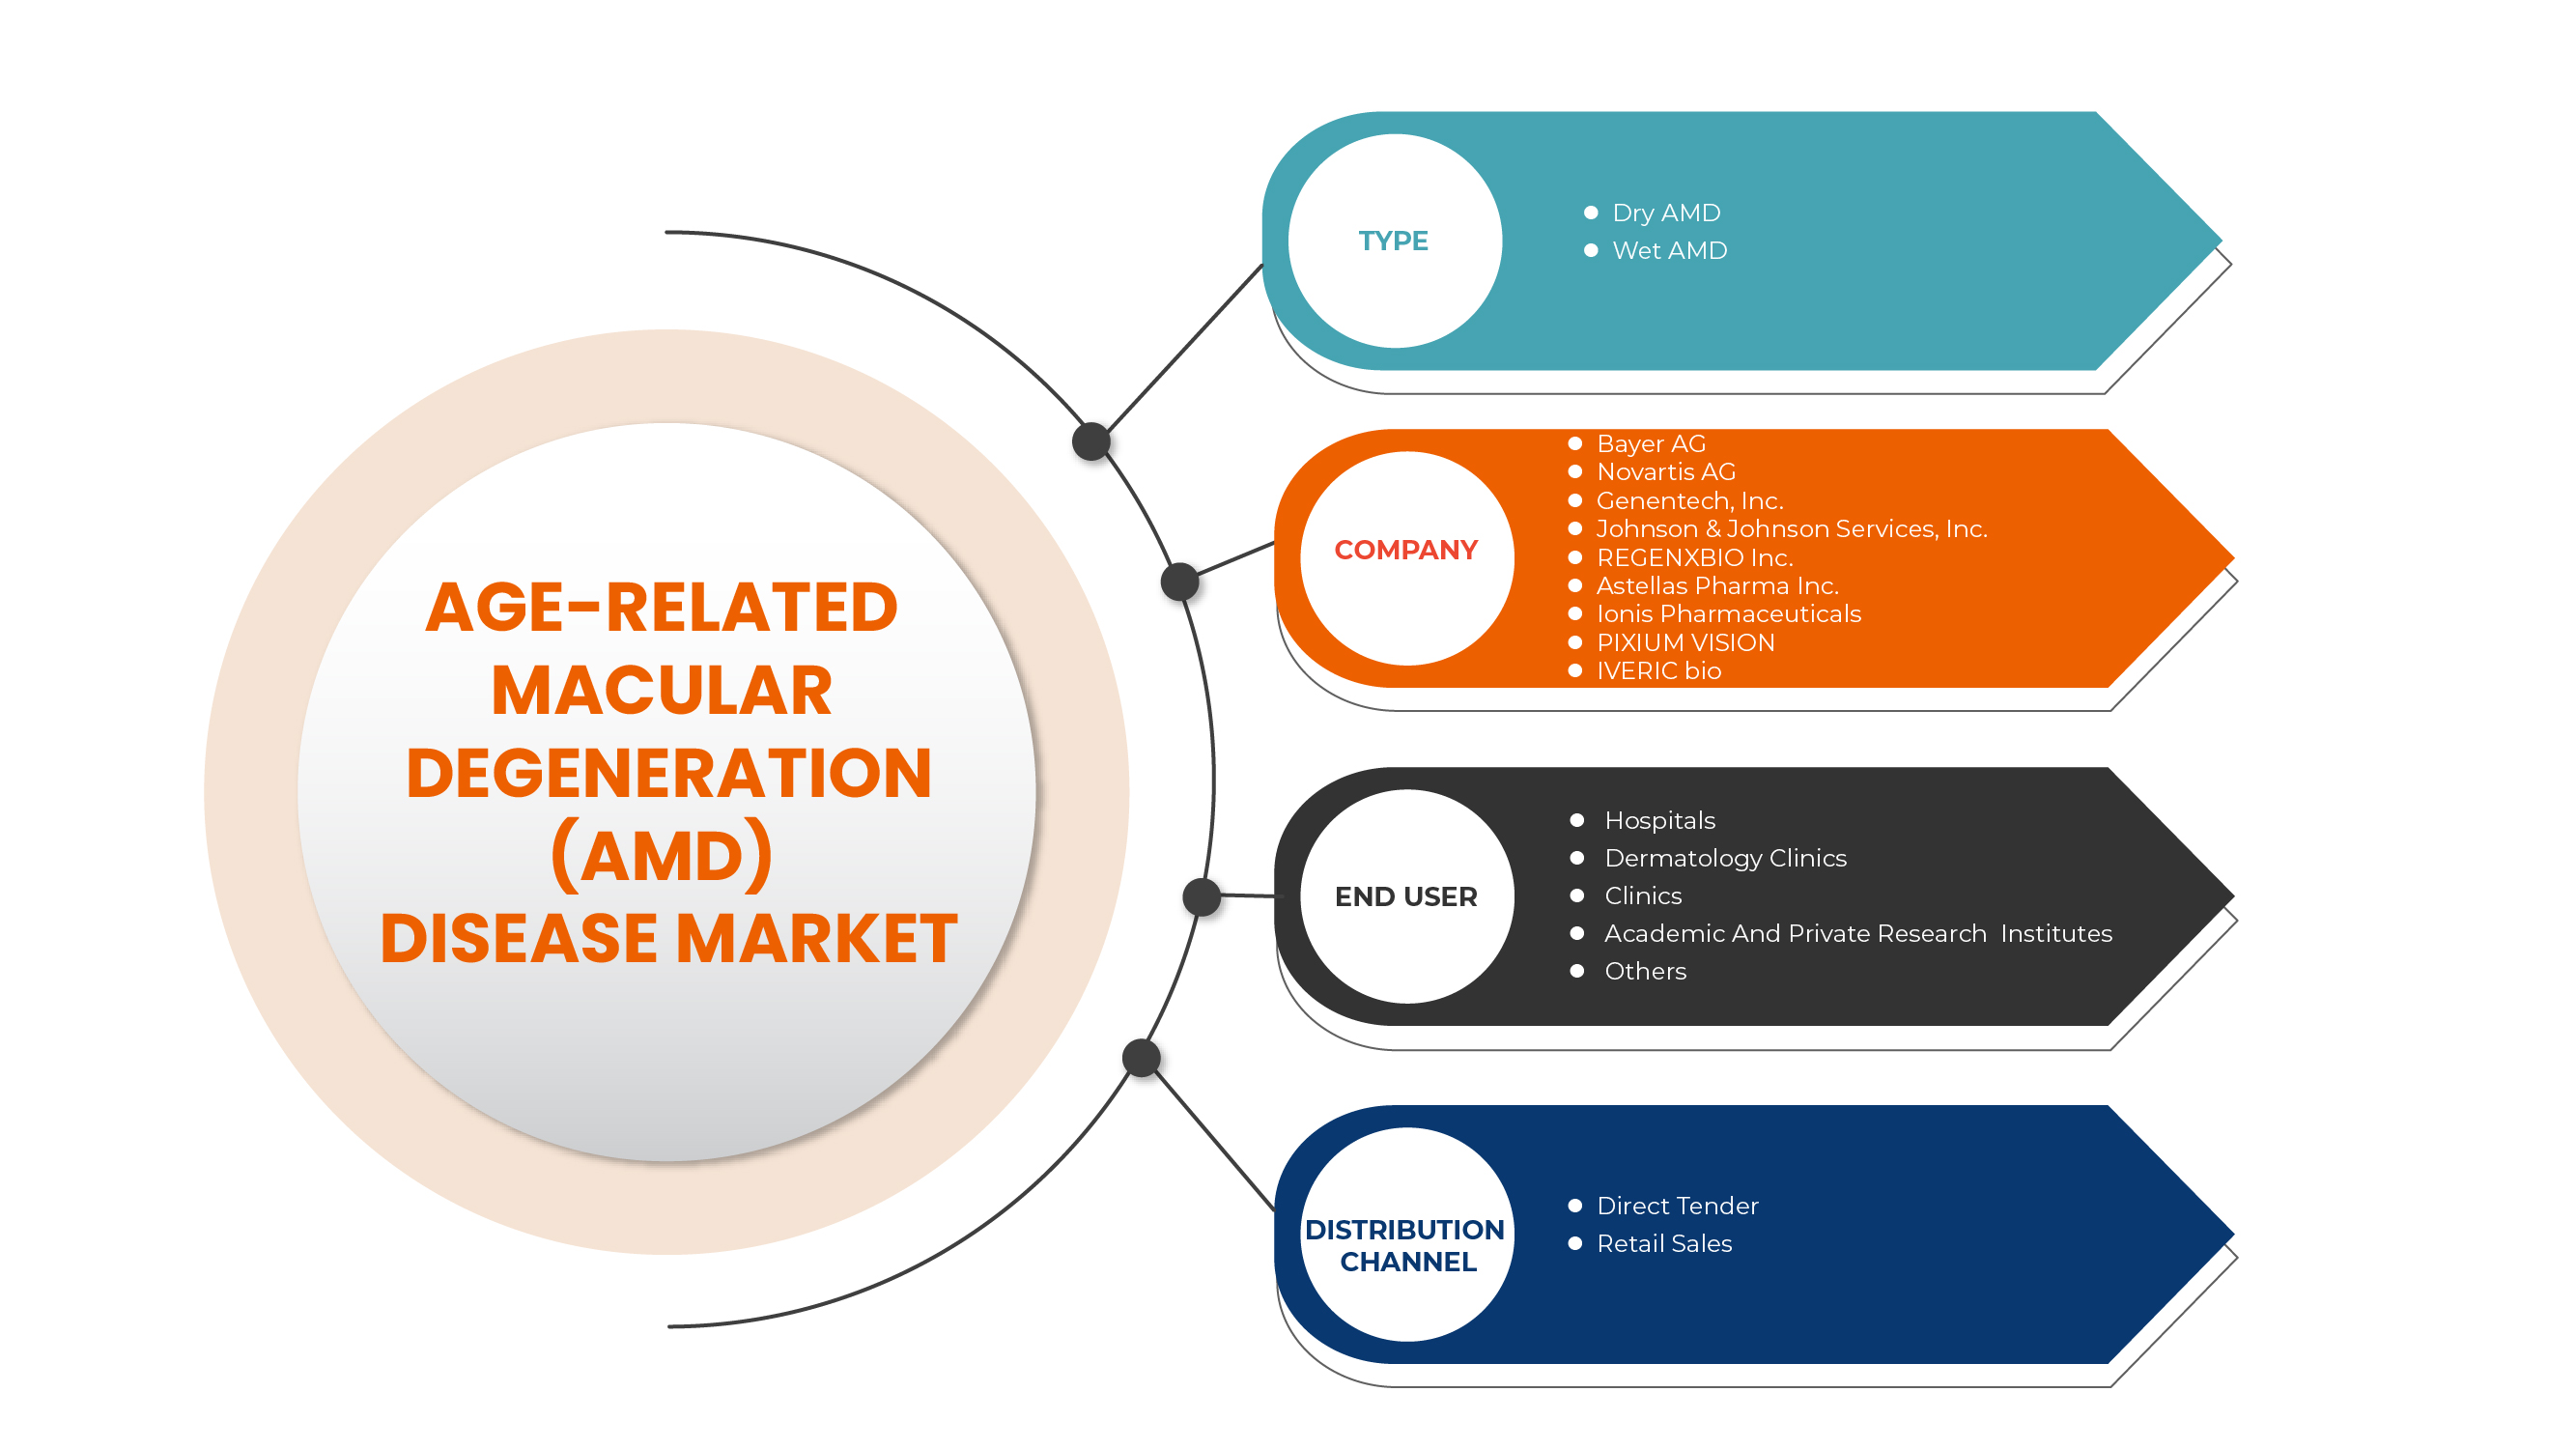
On the basis of distribution channel, the Asia-Pacific age-related macular degeneration (AMD) disease market is segmented into retail sales and direct tender.
Age-related macular degeneration (AMD) disease market Regional Analysis/Insights
The age-related macular degeneration (AMD) disease market is analysed and market size insights and trends are provided by type, end user and distribution channel as referenced above.
The countries covered in the age-related macular degeneration (AMD) disease report are China, India, South Korea, Australia, Singapore, Malaysia, Thailand, Indonesia, Philippines, Vietnam, Rest of Asia-Pacific.
China is expected to dominate due to increasing technological advancement in the developing areas.
The country section of the report also provides individual market impacting factors and changes in market regulation that impact the current and future trends of the market. Data points such as down-stream and upstream value chain analysis, technical trends and porter's five forces analysis, case studies are some of the pointers used to forecast the market scenario for individual countries. Also, the presence and availability of Asia-Pacific brands and their challenges faced due to large or scarce competition from local and domestic brands, impact of domestic tariffs and trade routes are considered while providing forecast analysis of the country data.
Competitive Landscape and Age-Related Macular Degeneration (AMD) Disease Market Share Analysis
Asia-Pacific age-related macular degeneration (AMD) disease market competitive landscape provides details by the competitors. Details included are company overview, company financials, revenue generated, market potential, investment in research and development, new market initiatives, Asia-Pacific presence, production sites and facilities, production capacities, company strengths and weaknesses, product launch, product width and breadth, and application dominance. The above data points provided are only related to the companies' focus on age-related macular degeneration (AMD) disease market.
Some of the players in the market are Novartis AG, Bayer AG, Astellas Pharma Inc., Ionis Pharmaceutics, Johnson & Johnson Services, Inc, among others.
Research Methodology
Data collection and base year analysis are done using data collection modules with large sample sizes. The market data is analysed and estimated using market statistical and coherent models. In addition, market share analysis and key trend analysis are the major success factors in the market report. The key research methodology used by DBMR research team is data triangulation which involves data mining, analysis of the impact of data variables on the market, and primary (industry expert) validation. Apart from this, data models include Vendor Positioning Grid, Market Time Line Analysis, Market Overview and Guide, Company Positioning Grid, Company Market Share Analysis, Standards of Measurement, Asia-Pacific vs Regional and Vendor Share Analysis. Please request analyst call in case of further inquiry.
SKU-
Get online access to the report on the World's First Market Intelligence Cloud
- Interactive Data Analysis Dashboard
- Company Analysis Dashboard for high growth potential opportunities
- Research Analyst Access for customization & queries
- Competitor Analysis with Interactive dashboard
- Latest News, Updates & Trend analysis
- Harness the Power of Benchmark Analysis for Comprehensive Competitor Tracking
Table of Content
1 INTRODUCTION
1.1 OBJECTIVES OF THE STUDY
1.2 MARKET DEFINITION
1.3 OVERVIEW OF ASIA PACIFIC AGE-RELATED MACULAR DEGENERATION (AMD) DISEASE MARKET
1.4 LIMITATIONS
1.5 MARKETS COVERED
2 MARKET SEGMENTATION
2.1 MARKETS COVERED
2.2 GEOGRAPHICAL SCOPE
2.3 YEARS CONSIDERED FOR THE STUDY
2.4 CURRENCY AND PRICING
2.5 DBMR TRIPOD DATA VALIDATION MODEL
2.6 MULTIVARIATE MODELLING
2.7 TYPE LIFELINE CURVE
2.8 PRIMARY INTERVIEWS WITH KEY OPINION LEADERS
2.9 DBMR MARKET POSITION GRID
2.1 MARKET END USER COVERAGE GRID
2.11 VENDOR SHARE ANALYSIS
2.12 SECONDARY SOURCES
2.13 ASSUMPTIONS
3 EXECUTIVE SUMMARY
4 PREMIUM INSIGHTS
4.1 PESTEL
4.2 PORTER'S FIVE FORCES MODEL
5 REGULATORY FRAMEWORK
6 MARKET OVERVIEW
6.1 DRIVERS
6.1.1 RISING PREVALENCE OF AGE-RELATED MACULAR DEGENERATION
6.1.2 INCREASING GERIATRIC POPULATION
6.1.3 INCREASE IN PIPELINE PRODUCTS
6.1.4 INCREASE IN STRATEGIC INITIATIVE BY KEY PLAYERS
6.2 RESTRAINTS
6.2.1 HIGH COST OF TREATMENT AND PROCEDURES
6.2.2 LACK OF ENOUGH QUALIFIED PROFESSIONALS
6.3 OPPORTUNITIES
6.3.1 INCREASING RESEARCH AND DEVELOPMENT
6.3.2 INCREASE IN AWARENESS AND TREATMENT-SEEKING RATE OF AMD
6.3.3 EMERGING REIMBURSEMENT POLICIES FOR THE TREATMENT
6.3.4 INCREASING PRODUCT APPROVAL FOR AGE-RELATED MACULAR DEGENERATION (AMD)
6.4 CHALLENGES
6.4.1 LIMITED ACCESS TO TREATMENT
6.4.2 STRINGENT GOVERNMENT REGULATIONS FOR PRODUCTS
7 ASIA PACIFIC AGE-RELATED MACULAR DEGENERATION (AMD) DISEASE MARKET, BY TYPE
7.1 OVERVIEW
7.2 DRY AMD
7.3 WET AMD
7.3.1 MEDICATIONS
7.3.2 ANTI-VEGF THERAPY
7.3.3 GENE THERAPY
7.3.4 SURGERY
8 ASIA PACIFIC AGE- RELATED MACULAR DEGENERATION (AMD) DISEASE MARKET, BY END USER
8.1 OVERVIEW
8.2 HOSPITALS
8.3 SPECIALTY CLINICS
8.4 AMBULATORY SURGICAL CENTERS
8.5 HOME HEALTHCARE
8.6 OTHERS
9 ASIA PACIFIC AGE-RELATED MACULAR DEGENERATION (AMD) DISEASE MARKET, BY DISTRIBUTION CHANNEL
9.1 OVERVIEW
9.2 RETAIL SALES
9.2.1 HOSPITAL PHARMACIES
9.2.2 RETAIL PHARMACIES
9.2.3 OTHERS
9.3 DIRECT TENDER
10 ASIA PACIFIC AGE-RELATED MACULAR DEGENERATION (AMD) DISEASE MARKET, BY REGION
10.1 ASIA-PACIFIC
10.1.1 CHINA
10.1.2 JAPAN
10.1.3 INDIA
10.1.4 SOUTH KOREA
10.1.5 AUSTRALIA
10.1.6 SINGAPORE
10.1.7 THAILAND
10.1.8 INDONESIA
10.1.9 PHILIPPINES
10.1.10 MALAYSIA
10.1.11 VIETNAM
10.1.12 REST OF ASIA-PACIFIC
11 ASIA PACIFIC AGE-RELATED MACULAR DEGENERATION (AMD) DISEASE MARKET: COMPANY LANDSCAPE
11.1 COMPANY SHARE ANALYSIS: ASIA PACIFIC
12 SWOT ANALYSIS
13 COMPANY PROFILE
13.1 NOVARTIS AG
13.1.1 COMPANY SNAPSHOT
13.1.2 REVENUE ANALYSIS
13.1.3 COMPANY SHARE ANALYSIS
13.1.4 PRODUCT PORTFOLIO
13.1.5 RECENT DEVELOPMENT
13.1.5.1 AGREEMENT
13.2 GENENTECH, INC.
13.2.1 COMPANY SNAPSHOT
13.2.2 COMPANY SHARE ANALYSIS
13.2.3 PRODUCT PORTFOLIO
13.2.4 RECENT DEVELOPMENT
13.3 BAYER AG
13.3.1 COMPANY SNAPSHOT
13.3.2 REVENUE ANALYSIS
13.3.3 COMPANY SHARE ANALYSIS
13.3.4 PRODUCT PORTFOLIO
13.3.5 RECENT DEVELOPMENT
13.4 ADVERUM BIOTECHNOLOGIES, INC.
13.4.1 COMPANY SNAPSHOT
13.4.2 REVENUE ANALYSIS
13.4.3 PRODUCT PORTFOLIO
13.4.4 RECENT DEVELOPMENT
13.5 ASTELLAS PHARMA INC.
13.5.1 COMPANY SNAPSHOT
13.5.2 REVENUE ANALYSIS
13.5.3 PRODUCT PORTFOLIO
13.5.4 RECENT DEVELOPMENT
13.6 GRAYBUG VISION INC.
13.6.1 COMPANY SNAPSHOT
13.6.2 REVENUE ANALYSIS
13.6.3 PRODUCT PORTFOLIO
13.6.4 RECENT DEVELOPMENT
13.7 GENSIGHT BIOLOGICS
13.7.1 COMPANY SNAPSHOT
13.7.2 REVENUE ANALYSIS
13.7.3 PRODUCT PORTFOLIO
13.7.4 RECENT DEVELOPMENTS
13.7.4.1 EVENT
13.7.4.2 AWARD
13.8 IONIS PHARMACEUTICALS
13.8.1 COMPANY SNAPSHOT
13.8.2 REVENUE ANALYSIS
13.8.3 PRODUCT PORTFOLIO
13.8.4 RECENT DEVELOPMENT
13.8.4.1 EVENT
13.9 IVERIC BIO
13.9.1 COMPANY SNAPSHOT
13.9.2 PRODUCT PORTFOLIO
13.9.3 RECENT DEVELOPMENT
13.1 JOHNSON &JOHNSON SERVICES, INC.
13.10.1 COMPANY SNAPSHOT
13.10.2 REVENUE ANALYSIS
13.10.3 PRODUCT PORTFOLIO
13.10.4 RECENT DEVELOPMENT
13.10.4.1 COLLABORATION
13.11 KODIAK SCIENCES INC.
13.11.1 COMPANY SNAPSHOT
13.11.2 PRODUCT PORTFOLIO
13.11.3 RECENT DEVELOPMENT
13.12 MEIRAGTX LIMITED
13.12.1 COMPANY SNAPSHOT
13.12.2 PRODUCT PORTFOLIO
13.12.3 RECENT DEVELOPMENTS
13.12.3.1 EVENTS
13.12.3.2 AWARD
13.12.3.3 COLLABORATION
13.13 OCUGEN INC.
13.13.1 COMPANY SNAPSHOT
13.13.2 PRODUCT PORTFOLIO
13.13.3 RECENT DEVELOPMENTS
13.13.3.1 INVESTMENT
13.13.3.2 CLINICAL TRIAL
13.14 PIXIUM VISION
13.14.1 COMPANY SNAPSHOT
13.14.2 REVENUE ANALYSIS
13.14.3 PRODUCT PORTFOLIO
13.14.4 RECENT DEVELOPMENT
13.14.4.1 AWARD
13.15 REGENXBIO INC.
13.15.1 COMPANY SNAPSHOT
13.15.2 PRODUCT PORTFOLIO
13.15.3 RECENT DEVELOPMENTS
13.15.3.1 EVENT
13.15.3.2 COLLABORATION
13.15.3.3 CERTIFICATION
14 QUESTIONNAIRE
15 RELATED REPORTS
List of Table
TABLE 1 VARIOUS EXAMPLES OF OPHTHALMIC DEVICES ARE SUMMARIZED IN THE BELOW-GIVEN TABLE ACCORDING TO THEIR CLASSIFICATION
TABLE 2 ASIA PACIFIC AGE-RELATED MACULAR DEGENERATION (AMD) DISEASE MARKET, BY TYPE, 2020-2029 (USD MILLION)
TABLE 3 ASIA PACIFIC DRY AMD IN AGE-RELATED MACULAR DEGENERATION (AMD) DISEASE MARKET, BY REGION, 2020-2029 (USD MILLION)
TABLE 4 ASIA PACIFIC WET AMD IN AGE-RELATED MACULAR DEGENERATION (AMD) DISEASE MARKET, BY REGION, 2020-2029 (USD MILLION)
TABLE 5 ASIA PACIFIC WET AMD IN AGE-RELATED MACULAR DEGENERATION (AMD) DISEASE MARKET, BY TYPE, 2020-2029 (USD MILLION)
TABLE 6 ASIA PACIFIC MEDICATIONS IN AGE-RELATED MACULAR DEGENERATION (AMD) DISEASE MARKET, BY TYPE, 2020-2029 (USD MILLION)
TABLE 7 ASIA PACIFIC AGE-RELATED MACULAR DEGENERATION (AMD) DISEASE MARKET, BY END USER, 2020-2029 (USD MILLION)
TABLE 8 ASIA PACIFIC HOSPITALS IN AGE-RELATED MACULAR DEGENERATION (AMD) DISEASE MARKET, BY REGION, 2020-2029 (USD MILLION)
TABLE 9 ASIA PACIFIC SPECIALTY CLINICS IN AGE-RELATED MACULAR DEGENERATION (AMD) DISEASE MARKET, BY REGION, 2020-2029 (USD MILLION)
TABLE 10 ASIA PACIFIC AMBULATORY SURGICAL CENTERS IN AGE-RELATED MACULAR DEGENERATION (AMD) DISEASE MARKET, BY REGION, 2020-2029 (USD MILLION)
TABLE 11 ASIA PACIFIC HOME HEALTHCARE IN AGE-RELATED MACULAR DEGENERATION (AMD) DISEASE MARKET, BY REGION, 2020-2029 (USD MILLION)
TABLE 12 ASIA PACIFIC OTHERS IN AGE-RELATED MACULAR DEGENERATION (AMD) DISEASE MARKET, BY REGION, 2020-2029 (USD MILLION)
TABLE 13 ASIA PACIFIC AGE-RELATED MACULAR DEGENERATION (AMD) DISEASE MARKET, BY DISTRIBUTION CHANNEL , 2020-2029 (USD MILLION)
TABLE 14 ASIA PACIFIC RETAIL SALES IN AGE-RELATED MACULAR DEGENERATION (AMD) DISEASE MARKET, BY REGION, 2020-2029 (USD MILLION)
TABLE 15 ASIA PACIFIC RETAIL SALES IN AGE-RELATED MACULAR DEGENERATION (AMD) DISEASE MARKET, BY DISTRIBUTION CHANNEL, 2020-2029 (USD MILLION)
TABLE 16 ASIA PACIFIC DIRECT TENDER IN AGE-RELATED MACULAR DEGENERATION (AMD) DISEASE MARKET, BY REGION, 2020-2029 (USD MILLION)
TABLE 17 ASIA-PACIFIC AGE-RELATED MACULAR DEGENERATION (AMD) DISEASE MARKET, BY COUNTRY, 2020-2029 (USD MILLION)
TABLE 18 ASIA-PACIFIC AGE-RELATED MACULAR DEGENERATION (AMD) DISEASE MARKET, BY TYPE, 2020-2029 (USD MILLION)
TABLE 19 ASIA-PACIFIC WET AMD IN AGE-RELATED MACULAR DEGENERATION (AMD) DISEASE MARKET, BY TYPE, 2020-2029 (USD MILLION)
TABLE 20 ASIA-PACIFIC MEDICATIONS IN AGE-RELATED MACULAR DEGENERATION (AMD) DISEASE MARKET, BY TYPE, 2020-2029 (USD MILLION)
TABLE 21 ASIA-PACIFIC AGE-RELATED MACULAR DEGENERATION (AMD) DISEASE MARKET, BY END USER, 2020-2029 (USD MILLION)
TABLE 22 ASIA-PACIFIC AGE-RELATED MACULAR DEGENERATION (AMD) DISEASE MARKET, BY DISTRIBUTION CHANNEL, 2020-2029 (USD MILLION)
TABLE 23 ASIA-PACIFIC RETAIL SALES IN AGE-RELATED MACULAR DEGENERATION (AMD) DISEASE MARKET, BY DISTRIBUTION CHANNEL, 2020-2029 (USD MILLION)
TABLE 24 CHINA AGE-RELATED MACULAR DEGENERATION (AMD) DISEASE MARKET, BY TYPE, 2020-2029 (USD MILLION)
TABLE 25 CHINA WET AMD IN AGE-RELATED MACULAR DEGENERATION (AMD) DISEASE MARKET, BY TYPE, 2020-2029 (USD MILLION)
TABLE 26 CHINA MEDICATIONS IN AGE-RELATED MACULAR DEGENERATION (AMD) DISEASE MARKET, BY TYPE, 2020-2029 (USD MILLION)
TABLE 27 CHINA AGE-RELATED MACULAR DEGENERATION (AMD) DISEASE MARKET, BY END USER, 2020-2029 (USD MILLION)
TABLE 28 CHINA AGE-RELATED MACULAR DEGENERATION (AMD) DISEASE MARKET, BY DISTRIBUTION CHANNEL, 2020-2029 (USD MILLION)
TABLE 29 CHINA RETAIL SALES IN AGE-RELATED MACULAR DEGENERATION (AMD) DISEASE MARKET, BY DISTRIBUTION CHANNEL, 2020-2029 (USD MILLION)
TABLE 30 JAPAN AGE-RELATED MACULAR DEGENERATION (AMD) DISEASE MARKET, BY TYPE, 2020-2029 (USD MILLION)
TABLE 31 JAPAN WET AMD IN AGE-RELATED MACULAR DEGENERATION (AMD) DISEASE MARKET, BY TYPE, 2020-2029 (USD MILLION)
TABLE 32 JAPAN MEDICATIONS IN AGE-RELATED MACULAR DEGENERATION (AMD) DISEASE MARKET, BY TYPE, 2020-2029 (USD MILLION)
TABLE 33 JAPAN AGE-RELATED MACULAR DEGENERATION (AMD) DISEASE MARKET, BY END USER, 2020-2029 (USD MILLION)
TABLE 34 JAPAN AGE-RELATED MACULAR DEGENERATION (AMD) DISEASE MARKET, BY DISTRIBUTION CHANNEL, 2020-2029 (USD MILLION)
TABLE 35 JAPAN RETAIL SALES IN AGE-RELATED MACULAR DEGENERATION (AMD) DISEASE MARKET, BY DISTRIBUTION CHANNEL, 2020-2029 (USD MILLION)
TABLE 36 INDIA AGE-RELATED MACULAR DEGENERATION (AMD) DISEASE MARKET, BY TYPE, 2020-2029 (USD MILLION)
TABLE 37 INDIA WET AMD IN AGE-RELATED MACULAR DEGENERATION (AMD) DISEASE MARKET, BY TYPE, 2020-2029 (USD MILLION)
TABLE 38 INDIA MEDICATIONS IN AGE-RELATED MACULAR DEGENERATION (AMD) DISEASE MARKET, BY TYPE, 2020-2029 (USD MILLION)
TABLE 39 INDIA AGE-RELATED MACULAR DEGENERATION (AMD) DISEASE MARKET, BY END USER, 2020-2029 (USD MILLION)
TABLE 40 INDIA AGE-RELATED MACULAR DEGENERATION (AMD) DISEASE MARKET, BY DISTRIBUTION CHANNEL, 2020-2029 (USD MILLION)
TABLE 41 INDIA RETAIL SALES IN AGE-RELATED MACULAR DEGENERATION (AMD) DISEASE MARKET, BY DISTRIBUTION CHANNEL, 2020-2029 (USD MILLION)
TABLE 42 SOUTH KOREA AGE-RELATED MACULAR DEGENERATION (AMD) DISEASE MARKET, BY TYPE, 2020-2029 (USD MILLION)
TABLE 43 SOUTH KOREA WET AMD IN AGE-RELATED MACULAR DEGENERATION (AMD) DISEASE MARKET, BY TYPE, 2020-2029 (USD MILLION)
TABLE 44 SOUTH KOREA MEDICATIONS IN AGE-RELATED MACULAR DEGENERATION (AMD) DISEASE MARKET, BY TYPE, 2020-2029 (USD MILLION)
TABLE 45 SOUTH KOREA AGE-RELATED MACULAR DEGENERATION (AMD) DISEASE MARKET, BY END USER, 2020-2029 (USD MILLION)
TABLE 46 SOUTH KOREA AGE-RELATED MACULAR DEGENERATION (AMD) DISEASE MARKET, BY DISTRIBUTION CHANNEL, 2020-2029 (USD MILLION)
TABLE 47 SOUTH KOREA RETAIL SALES IN AGE-RELATED MACULAR DEGENERATION (AMD) DISEASE MARKET, BY DISTRIBUTION CHANNEL, 2020-2029 (USD MILLION)
TABLE 48 AUSTRALIA AGE-RELATED MACULAR DEGENERATION (AMD) DISEASE MARKET, BY TYPE, 2020-2029 (USD MILLION)
TABLE 49 AUSTRALIA WET AMD IN AGE-RELATED MACULAR DEGENERATION (AMD) DISEASE MARKET, BY TYPE, 2020-2029 (USD MILLION)
TABLE 50 AUSTRALIA MEDICATIONS IN AGE-RELATED MACULAR DEGENERATION (AMD) DISEASE MARKET, BY TYPE, 2020-2029 (USD MILLION)
TABLE 51 AUSTRALIA AGE-RELATED MACULAR DEGENERATION (AMD) DISEASE MARKET, BY END USER, 2020-2029 (USD MILLION)
TABLE 52 AUSTRALIA AGE-RELATED MACULAR DEGENERATION (AMD) DISEASE MARKET, BY DISTRIBUTION CHANNEL, 2020-2029 (USD MILLION)
TABLE 53 AUSTRALIA RETAIL SALES IN AGE-RELATED MACULAR DEGENERATION (AMD) DISEASE MARKET, BY DISTRIBUTION CHANNEL, 2020-2029 (USD MILLION)
TABLE 54 SINGAPORE AGE-RELATED MACULAR DEGENERATION (AMD) DISEASE MARKET, BY TYPE, 2020-2029 (USD MILLION)
TABLE 55 SINGAPORE WET AMD IN AGE-RELATED MACULAR DEGENERATION (AMD) DISEASE MARKET, BY TYPE, 2020-2029 (USD MILLION)
TABLE 56 SINGAPORE MEDICATIONS IN AGE-RELATED MACULAR DEGENERATION (AMD) DISEASE MARKET, BY TYPE, 2020-2029 (USD MILLION)
TABLE 57 SINGAPORE AGE-RELATED MACULAR DEGENERATION (AMD) DISEASE MARKET, BY END USER, 2020-2029 (USD MILLION)
TABLE 58 SINGAPORE AGE-RELATED MACULAR DEGENERATION (AMD) DISEASE MARKET, BY DISTRIBUTION CHANNEL, 2020-2029 (USD MILLION)
TABLE 59 SINGAPORE RETAIL SALES IN AGE-RELATED MACULAR DEGENERATION (AMD) DISEASE MARKET, BY DISTRIBUTION CHANNEL, 2020-2029 (USD MILLION)
TABLE 60 THAILAND AGE-RELATED MACULAR DEGENERATION (AMD) DISEASE MARKET, BY TYPE, 2020-2029 (USD MILLION)
TABLE 61 THAILAND WET AMD IN AGE-RELATED MACULAR DEGENERATION (AMD) DISEASE MARKET, BY TYPE, 2020-2029 (USD MILLION)
TABLE 62 THAILAND MEDICATIONS IN AGE-RELATED MACULAR DEGENERATION (AMD) DISEASE MARKET, BY TYPE, 2020-2029 (USD MILLION)
TABLE 63 THAILAND AGE-RELATED MACULAR DEGENERATION (AMD) DISEASE MARKET, BY END USER, 2020-2029 (USD MILLION)
TABLE 64 THAILAND AGE-RELATED MACULAR DEGENERATION (AMD) DISEASE MARKET, BY DISTRIBUTION CHANNEL, 2020-2029 (USD MILLION)
TABLE 65 THAILAND RETAIL SALES IN AGE-RELATED MACULAR DEGENERATION (AMD) DISEASE MARKET, BY DISTRIBUTION CHANNEL, 2020-2029 (USD MILLION)
TABLE 66 INDONESIA AGE-RELATED MACULAR DEGENERATION (AMD) DISEASE MARKET, BY TYPE, 2020-2029 (USD MILLION)
TABLE 67 INDONESIA WET AMD IN AGE-RELATED MACULAR DEGENERATION (AMD) DISEASE MARKET, BY TYPE, 2020-2029 (USD MILLION)
TABLE 68 INDONESIA MEDICATIONS IN AGE-RELATED MACULAR DEGENERATION (AMD) DISEASE MARKET, BY TYPE, 2020-2029 (USD MILLION)
TABLE 69 INDONESIA AGE-RELATED MACULAR DEGENERATION (AMD) DISEASE MARKET, BY END USER, 2020-2029 (USD MILLION)
TABLE 70 INDONESIA AGE-RELATED MACULAR DEGENERATION (AMD) DISEASE MARKET, BY DISTRIBUTION CHANNEL, 2020-2029 (USD MILLION)
TABLE 71 INDONESIA RETAIL SALES IN AGE-RELATED MACULAR DEGENERATION (AMD) DISEASE MARKET, BY DISTRIBUTION CHANNEL, 2020-2029 (USD MILLION)
TABLE 72 PHILIPPINES AGE-RELATED MACULAR DEGENERATION (AMD) DISEASE MARKET, BY TYPE, 2020-2029 (USD MILLION)
TABLE 73 PHILIPPINES WET AMD IN AGE-RELATED MACULAR DEGENERATION (AMD) DISEASE MARKET, BY TYPE, 2020-2029 (USD MILLION)
TABLE 74 PHILIPPINES MEDICATIONS IN AGE-RELATED MACULAR DEGENERATION (AMD) DISEASE MARKET, BY TYPE, 2020-2029 (USD MILLION)
TABLE 75 PHILIPPINES AGE-RELATED MACULAR DEGENERATION (AMD) DISEASE MARKET, BY END USER, 2020-2029 (USD MILLION)
TABLE 76 PHILIPPINES AGE-RELATED MACULAR DEGENERATION (AMD) DISEASE MARKET, BY DISTRIBUTION CHANNEL, 2020-2029 (USD MILLION)
TABLE 77 PHILIPPINES RETAIL SALES IN AGE-RELATED MACULAR DEGENERATION (AMD) DISEASE MARKET, BY DISTRIBUTION CHANNEL, 2020-2029 (USD MILLION)
TABLE 78 MALAYSIA AGE-RELATED MACULAR DEGENERATION (AMD) DISEASE MARKET, BY TYPE, 2020-2029 (USD MILLION)
TABLE 79 MALAYSIA WET AMD IN AGE-RELATED MACULAR DEGENERATION (AMD) DISEASE MARKET, BY TYPE, 2020-2029 (USD MILLION)
TABLE 80 MALAYSIA MEDICATIONS IN AGE-RELATED MACULAR DEGENERATION (AMD) DISEASE MARKET, BY TYPE, 2020-2029 (USD MILLION)
TABLE 81 MALAYSIA AGE-RELATED MACULAR DEGENERATION (AMD) DISEASE MARKET, BY END USER, 2020-2029 (USD MILLION)
TABLE 82 MALAYSIA AGE-RELATED MACULAR DEGENERATION (AMD) DISEASE MARKET, BY DISTRIBUTION CHANNEL, 2020-2029 (USD MILLION)
TABLE 83 MALAYSIA RETAIL SALES IN AGE-RELATED MACULAR DEGENERATION (AMD) DISEASE MARKET, BY DISTRIBUTION CHANNEL, 2020-2029 (USD MILLION)
TABLE 84 VIETNAM AGE-RELATED MACULAR DEGENERATION (AMD) DISEASE MARKET, BY TYPE, 2020-2029 (USD MILLION)
TABLE 85 VIETNAM WET AMD IN AGE-RELATED MACULAR DEGENERATION (AMD) DISEASE MARKET, BY TYPE, 2020-2029 (USD MILLION)
TABLE 86 VIETNAM MEDICATIONS IN AGE-RELATED MACULAR DEGENERATION (AMD) DISEASE MARKET, BY TYPE, 2020-2029 (USD MILLION)
TABLE 87 VIETNAM AGE-RELATED MACULAR DEGENERATION (AMD) DISEASE MARKET, BY END USER, 2020-2029 (USD MILLION)
TABLE 88 VIETNAM AGE-RELATED MACULAR DEGENERATION (AMD) DISEASE MARKET, BY DISTRIBUTION CHANNEL, 2020-2029 (USD MILLION)
TABLE 89 VIETNAM RETAIL SALES IN AGE-RELATED MACULAR DEGENERATION (AMD) DISEASE MARKET, BY DISTRIBUTION CHANNEL, 2020-2029 (USD MILLION)
TABLE 90 REST OF ASIA-PACIFIC AGE-RELATED MACULAR DEGENERATION (AMD) DISEASE MARKET, BY TYPE, 2020-2029 (USD MILLION)
List of Figure
FIGURE 1 ASIA PACIFIC AGE-RELATED MACULAR DEGENERATION (AMD) DISEASE MARKET: SEGMENTATION
FIGURE 2 ASIA PACIFIC AGE-RELATED MACULAR DEGENERATION (AMD) DISEASE MARKET: DATA TRIANGULATION
FIGURE 3 ASIA PACIFIC AGE-RELATED MACULAR DEGENERATION (AMD) DISEASE MARKET: DROC ANALYSIS
FIGURE 4 ASIA PACIFIC AGE-RELATED MACULAR DEGENERATION (AMD) DISEASE MARKET: ASIA PACIFIC VS REGIONAL MARKET ANALYSIS
FIGURE 5 ASIA PACIFIC AGE-RELATED MACULAR DEGENERATION (AMD) DISEASE MARKET: COMPANY RESEARCH ANALYSIS
FIGURE 6 ASIA PACIFIC AGE-RELATED MACULAR DEGENERATION (AMD) DISEASE MARKET: MULTIVARIATE MODELLING
FIGURE 7 ASIA PACIFIC AGE-RELATED MACULAR DEGENERATION (AMD) DISEASE MARKET: INTERVIEW DEMOGRAPHICS
FIGURE 8 ASIA PACIFIC AGE-RELATED MACULAR DEGENERATION (AMD) DISEASE MARKET: DBMR MARKET POSITION GRID
FIGURE 9 ASIA PACIFIC AGE-RELATED MACULAR DEGENERATION (AMD) DISEASE MARKET: END USER COVERAGE GRID
FIGURE 10 ASIA PACIFIC AGE-RELATED MACULAR DEGENERATION (AMD) DISEASE MARKET: VENDOR SHARE ANALYSIS
FIGURE 11 ASIA PACIFIC AGE-RELATED MACULAR DEGENERATION (AMD) DISEASE MARKET: SEGMENTATION
FIGURE 12 NORTH AMERICA IS EXPECTED TO DOMINATE AND EUROPE IS GROWING AT THE FASTEST PACE IN ASIA PACIFIC AGE-RELATED MACULAR DEGENERATION (AMD) DISEASE MARKET IN THE FORECAST PERIOD OF 2022 TO 2029
FIGURE 13 INCREASE IN THE PREVALENCE OF AGE-RELATED MACULAR DEGENERATION (AMD) AND GROWING GERIATRIC POPULATION ARE DRIVING THE ASIA PACIFIC AGE-RELATED MACULAR DEGENERATION (AMD) DISEASE MARKET IN THE FORECAST PERIOD OF 2022 TO 2029
FIGURE 14 DRY AMD SEGMENT IS EXPECTED TO ACCOUNT FOR THE LARGEST SHARE OF THE ASIA PACIFIC AGE-RELATED MACULAR DEGENERATION (AMD) DISEASE MARKET IN 2022 & 2029
FIGURE 15 DRIVERS, RESTRAINTS, OPPORTUNITIES, AND CHALLENGES OF ASIA PACIFIC AGE-RELATED MACULAR DEGENERATION (AMD) DISEASE MARKET
FIGURE 16 ASIA PACIFIC AGE-RELATED MACULAR DEGENERATION (AMD) DISEASE MARKET: BY TYPE, 2021
FIGURE 17 ASIA PACIFIC AGE-RELATED MACULAR DEGENERATION (AMD) DISEASE MARKET: BY TYPE, 2022-2029 (USD MILLION)
FIGURE 18 ASIA PACIFIC AGE-RELATED MACULAR DEGENERATION (AMD) DISEASE MARKET: BY TYPE, CAGR (2022-2029)
FIGURE 19 ASIA PACIFIC AGE-RELATED MACULAR DEGENERATION (AMD) DISEASE MARKET: BY TYPE, LIFELINE CURVE
FIGURE 20 ASIA PACIFIC AGE-RELATED MACULAR DEGENERATION (AMD) DISEASE MARKET: BY END USER, 2021
FIGURE 21 ASIA PACIFIC AGE-RELATED MACULAR DEGENERATION (AMD) DISEASE MARKET: BY END USER, 2022-2029 (USD MILLION)
FIGURE 22 ASIA PACIFIC AGE-RELATED MACULAR DEGENERATION (AMD) DISEASE MARKET: BY END USER, CAGR (2022-2029)
FIGURE 23 ASIA PACIFIC AGE-RELATED MACULAR DEGENERATION (AMD) DISEASE MARKET: BY END USER, LIFELINE CURVE
FIGURE 24 ASIA PACIFIC AGE-RELATED MACULAR DEGENERATION (AMD) DISEASE MARKET: BY DISTRIBUTION CHANNEL, 2021
FIGURE 25 ASIA PACIFIC AGE-RELATED MACULAR DEGENERATION (AMD) DISEASE MARKET: BY DISTRIBUTION CHANNEL, 2022-2029 (USD MILLION)
FIGURE 26 ASIA PACIFIC AGE-RELATED MACULAR DEGENERATION (AMD) DISEASE MARKET: BY DISTRIBUTION CHANNEL, CAGR (2022-2029)
FIGURE 27 ASIA PACIFIC AGE-RELATED MACULAR DEGENERATION (AMD) DISEASE MARKET: BY DISTRIBUTION CHANNEL, LIFELINE CURVE
FIGURE 28 ASIA-PACIFIC AGE-RELATED MACULAR DEGENERATION (AMD) DISEASE MARKET: SNAPSHOT (2021)
FIGURE 29 ASIA-PACIFIC AGE-RELATED MACULAR DEGENERATION (AMD) DISEASE MARKET: BY COUNTRY (2021)
FIGURE 30 ASIA-PACIFIC AGE-RELATED MACULAR DEGENERATION (AMD) DISEASE MARKET: BY COUNTRY (2022 & 2029)
FIGURE 31 ASIA-PACIFIC AGE-RELATED MACULAR DEGENERATION (AMD) DISEASE MARKET: BY COUNTRY (2021 & 2029)
FIGURE 32 ASIA-PACIFIC AGE-RELATED MACULAR DEGENERATION (AMD) DISEASE MARKET: BY TYPE (2022-2029)
FIGURE 33 ASIA PACIFIC AGE-RELATED MACULAR DEGENERATION (AMD) DISEASE MARKET: COMPANY SHARE 2021 (%)

Research Methodology
Data collection and base year analysis are done using data collection modules with large sample sizes. The stage includes obtaining market information or related data through various sources and strategies. It includes examining and planning all the data acquired from the past in advance. It likewise envelops the examination of information inconsistencies seen across different information sources. The market data is analysed and estimated using market statistical and coherent models. Also, market share analysis and key trend analysis are the major success factors in the market report. To know more, please request an analyst call or drop down your inquiry.
The key research methodology used by DBMR research team is data triangulation which involves data mining, analysis of the impact of data variables on the market and primary (industry expert) validation. Data models include Vendor Positioning Grid, Market Time Line Analysis, Market Overview and Guide, Company Positioning Grid, Patent Analysis, Pricing Analysis, Company Market Share Analysis, Standards of Measurement, Global versus Regional and Vendor Share Analysis. To know more about the research methodology, drop in an inquiry to speak to our industry experts.
Customization Available
Data Bridge Market Research is a leader in advanced formative research. We take pride in servicing our existing and new customers with data and analysis that match and suits their goal. The report can be customized to include price trend analysis of target brands understanding the market for additional countries (ask for the list of countries), clinical trial results data, literature review, refurbished market and product base analysis. Market analysis of target competitors can be analyzed from technology-based analysis to market portfolio strategies. We can add as many competitors that you require data about in the format and data style you are looking for. Our team of analysts can also provide you data in crude raw excel files pivot tables (Fact book) or can assist you in creating presentations from the data sets available in the report.
