
North America Gas Treatment Market, By Type (Tertiary Amine, Primary Amine, Secondary Amine, Non-Amines), Type of Gas (Acid Gas, Synthesis Gas), Treatment (Acid Gas Removal, Dehydration, Others), Technology (OASE (BASF SE), Flexsorb (Exxon Mobil Corporation), ADIP (Royal Dutch Shell Plc), UOP (Honeywell International Inc.), SPREX (Axens), Others), Industry (Power Plants, Refineries, Metal & Mining, Oil & Gas, Pulp & Paper, Food & Beverages, Others), Country (U.S., Canada, Mexico), Industry Trends and Forecast to 2028.
 Market Analysis and Insights: North America Gas Treatment Market
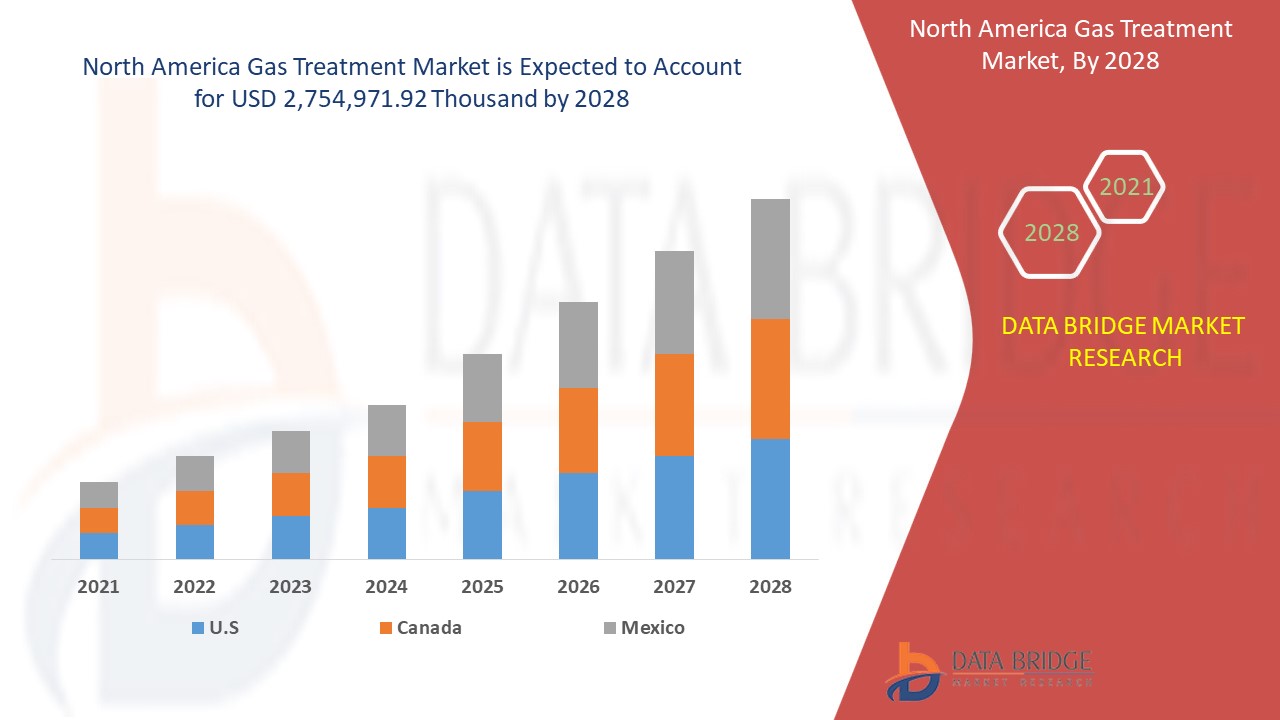
North America gas treatment market is expected to gain significant growth in the forecast period of 2021 to 2028. Data Bridge Market Research analyses that the market is growing at a CAGR of 5.8% in the forecast period of 2021 to 2028 and is expected to reach USD 2,754,971.92 thousand by 2028.
Gas treatment is the process of quality improvement of gases through which the removal of unwanted components from gases is done. Gas treatment requirement is increasing due to the rise in consumption of natural gases as an energy source in various applications/industries. It removes hydrogen sulphide and carbon dioxide, which makes it safe to use as clean energy sources and compiles with environmental regulators.
Increasing demand for natural gas owing to its low environmental footprint is driving the market growth. Growing usage of industrial filters and electrostatic precipitators is acting as a potential market driver for the market. Also, the rising stringent air pollution control regulations, increasing the sales and profit of the players operating in the market.
The major restraint impacting the market is the high cost of specialized raw materials for gas extraction. Further, various complications associated with the gas extraction process will also restraint the market growth. The opportunities for the market are the advancement in treatment technology in the oil and gas industry. One of the significant drivers associated with the gas treatment market is the growing usage of natural gasses as a cleaner source for electricity generation. However, stringent government regulations regarding gas treatment may challenge the market's growth
This gas treatment market report provides details of market share, new developments, and product pipeline analysis, the impact of domestic and localized market players, analyses opportunities in terms of emerging revenue pockets, changes in market regulations, product approvals, strategic decisions, product launches, geographic expansions, and technological innovations in the market. To understand the analysis and the market scenario, contact us for an Analyst Brief. Our team will help you create a revenue impact solution to achieve your desired goal.
 North America Gas Treatment Market Scope and Market Size
North America gas treatment market is segmented on the basis of type, type of gas, treatment, technology, and industry. The growth among segments helps you analyze niche pockets of growth and strategies to approach the market and determine your core application areas and the difference in your target markets.
- On the basis of type, the North America gas treatment market is segmented into a primary amine, secondary amine, tertiary amine, and non-amines. In 2021, the tertiary amine is expected to dominate due to the increasing demand for natural gas for electric power generation, which helps to boost its demand in the forecast year.
- On the basis of type of gas, the North America gas treatment market is segmented into acid gas and synthesis gas. In 2021, the acid gas segment is expected to dominate due to the rise in strict regulations against air pollution across the region, which boosts its demand in the forecast year.
- On the basis of treatment, the North America gas treatment market is segmented into dehydration, acid gas removal, and others. In 2021, acid gas removal is expected to dominate as it removes H2S, CO2, and organic sulfurs (such as mercaptan and COS) in the raw feed gas so as to make it comply with natural gas, which boosts its demand in the forecast year.
- On the basis of technology, the North America gas treatment market is segmented into SPREX (Axens), ADIP (Royal Dutch Shell plc), UOP (Honeywell International inc.), OASE (BASF SE), Flexsorb (Exxon Mobil Corporation), and others. In 2021, OASE (BASF SE) is expected to dominate as it removes carbon dioxide and hydrogen sulfide in natural-gas applications, which boosts its demand in the forecast year.
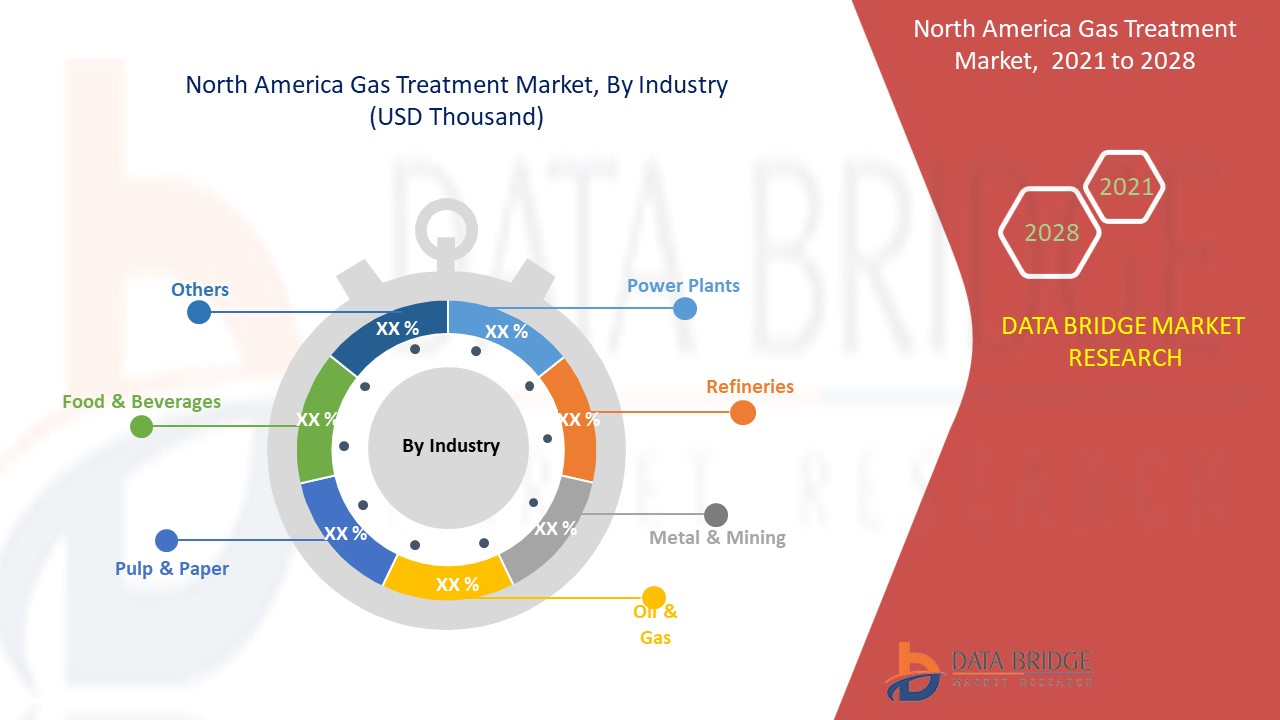
- On the basis of industry, the North America gas treatment market is segmented into refineries, power plants, pulp & paper, metal & mining, food & beverages, oil & gas, and others. In 2021, power plants is expected to dominate the market due to the increasing demand for electricity in the region, which boosts its demand in the forecast year.
North America Gas Treatment Market Country Level Analysis
North America gas treatment market is analyzed, and market size information is provided by country, type, type of gas, treatment, technology, and industry.
The countries covered in the North America gas treatment market report are the U.S., Canada, and Mexico.
North America gas treatment market is expected to dominate by the U.S. due to the rise in natural gas use for electricity production and increasing awareness of natural gas as a cleaner source for electricity generation, which has increased the inclination towards gas treatment plants.
The country section of the report also provides individual market impacting factors and changes in regulation in the market domestically that impact the current and future trends of the market. Data points such as new sales, replacement sales, country demographics, regulatory acts, and import-export tariffs are some of the major pointers used to forecast the market scenario for individual countries. Also, the presence and availability of global brands and their challenges faced due to large or scarce competition from local and domestic brands, the impact of sales channels are considered while providing forecast analysis of the country data.
Growth in the Gas Treatment Industry
North America gas treatment market also provides you with detailed market analysis for every country growth in the installed base of different kinds of products for the gas treatment market, impact of technology using lifeline curves, and changes in infant formula regulatory scenarios, and their impact on the gas treatment market. The data is available for the historic period 2011 to 2019.
Competitive Landscape and Gas Treatment Market Share Analysis
North America gas treatment market competitive landscape provides details by the competitor. Details included are company overview, company financials, revenue generated, market potential, investment in research and development, new market initiatives, global presence, production sites and facilities, company strengths and weaknesses, product launch, clinical trials pipelines, brand analysis, product approvals, patents, product width and breadth, application dominance, technology lifeline curve. The above data points provided are only related to the company's focus related to North America gas treatment market.
Spme of the major players covered in the report are BASF SE, Dow, Exxon Mobil Corporation, Royal Dutch Shell plc, Honeywell International Inc., INEOS, Eastman Chemical Company, Clariant, Ecolab, Huntsman International LLC, Cabot Corporation, Lhoist, Axens, BERRYMAN CHEMICAL, Eunisell Chemicals, among others. DBMR analysts understand competitive strengths and provide competitive analysis for each competitor separately.
For instance,
- In October 2021, Exxon Mobil Corporation initiated the process for engineering, procurement, and construction contracts as part of its plans to expand carbon capture and storage (CCS) at its LaBarge, Wyoming facility. With this development company is able to mitigate emissions by capturing up to an additional 1 million metric tons of CO2 each year
- In May 2019, Royal Dutch Shell plc, through its subsidiary Shell Offshore Inc (Shell), announced that production has started at the Shell-operated Appomattox floating production system months ahead of schedule, opening a new frontier in the deep-water U.S. Gulf of Mexico. With this development company is able to increase its production capacity
SKU-
Obtenha acesso online ao relatório sobre a primeira nuvem de inteligência de mercado do mundo

- Painel interativo de análise de dados
- Painel de análise da empresa para oportunidades de elevado potencial de crescimento
- Acesso de analista de pesquisa para personalização e customização. consultas
- Análise da concorrência com painel interativo
- Últimas notícias, atualizações e atualizações Análise de tendências
- Aproveite o poder da análise de benchmark para um rastreio abrangente da concorrência
Índice
1 INTRODUCTION
1.1 OBJECTIVES OF THE STUDY
1.2 MARKET DEFINITION
1.3 OVERVIEW OF NORTH AMERICA GAS TREATMENT MARKET
1.4 LIMITATIONS
1.5 MARKETS COVERED
2 MARKET SEGMENTATION
2.1 MARKETS COVERED
2.2 GEOGRAPHICAL SCOPE
2.3 YEARS CONSIDERED FOR THE STUDY
2.4 CURRENCY AND PRICING
2.5 DBMR TRIPOD DATA VALIDATION MODEL
2.6 TYPE OF GAS LIFE LINE CURVE
2.7 MULTIVARIATE MODELLING
2.8 PRIMARY INTERVIEWS WITH KEY OPINION LEADERS
2.9 DBMR MARKET POSITION GRID
2.1 MARKET INDUSTRY COVERAGE GRID
2.11 DBMR MARKET CHALLENGE MATRIX
2.12 VENDOR SHARE ANALYSIS
2.13 IMPORT-EXPORT DATA
2.14 SECONDARY SOURCES
2.15 ASSUMPTIONS
3 EXECUTIVE SUMMARY
4 PREMIUM INSIGHTS
4.1 NORTH AMERICA:
5 MARKET OVERVIEW
5.1 DRIVERS
5.1.1 INCREASING DEMAND FOR NATURAL GAS OWING TO ITS LOW ENVIRONMENTAL FOOTPRINT
5.1.2 GROWING USAGE OF INDUSTRIAL FILTERS AND ELECTROSTATIC PRECIPITATORS
5.1.3 RISING STRINGENT AIR POLLUTION CONTROL REGULATIONS
5.1.4 GROWING USAGES OF NATURAL GASSES AS A CLEANER SOURCE FOR ELECTRICITY GENERATION
5.2 RESTRAINTS
5.2.1 HIGH COST OF SPECIALIZED RAW MATERIALS FOR GAS EXTRACTION SUCH AS RAPID EVAPORATION SPEED MATERIAL AND FILTRATION PIPES
5.2.2 VARIOUS COMPLICATION ASSOCIATED WITH GAS EXTRACTION PROCESS
5.2.3 HUGE INSTALLATION AND INITIAL COST FOR GAS TREATMENT
5.3 OPPORTUNITIES
5.3.1 INCREASING GOVERNMENT INITIATIVES FOR GAS TREATMENT
5.3.2 DISCOVERY OF NEW GAS RESERVES ACROSS THE WORLD
5.3.3 ADVANCEMENT IN TREATMENT TECHNOLOGY IN OIL & GAS INDUSTRY
5.4 CHALLENGES
5.4.1 STRINGENT GOVERNMENT REGULATIONS REGARDING GAS TREATMENT
5.4.2 INCREASING HEALTH ISSUE AMONG THE WORKERS OF GAS INDUSTRY
6 ANALYSIS ON IMPACT OF COVID-19 ON THE GAS TREATMENT MARKET
6.1 AFTERMATH OF COVID-19 GOVERNMENT INITIATIVES TO BOOST GAS TREATMENT MARKET
6.2 STRATEGIC DECISIONS OF MANUFACTURERS AFTER COVID-19 TO GET COMPETITIVE MARKET SHARE
6.3 IMPACT ON PRICE
6.4 IMPACT ON DEMAND
6.5 IMPACT ON SUPPLY CHAIN
6.6 CONCLUSION
7 NORTH AMERICA GAS TREATMENT MARKET, BY TYPE
7.1 OVERVIEW
7.2 TERTIARY AMINE
7.2.1 TRIETHANOLAMINE
7.2.2 METHYLDIETHANOLAMINE
7.3 PRIMARY AMINE
7.3.1 MONOETHANOLAMINE
7.3.2 DIGLYCOLAMINE
7.4 SECONDARY AMINE
7.4.1 DIETHANOLAMINE
7.4.2 DIISOPROPANOLAMINE
7.5 NON-AMINES
7.5.1 GLYCOLS
7.5.2 TRIAZINE
7.5.3 OTHERS
8 NORTH AMERICA GAS TREATMENT MARKET, BY TYPE OF GAS
8.1 OVERVIEW
8.2 ACID GAS
8.3 SYNTHESIS GAS
9 NORTH AMERICA GAS TREATMENT MARKET, BY TREATMENT
9.1 OVERVIEW
9.2 ACID GAS REMOVAL
9.3 DEHYDRATION
9.4 OTHERS
10 NORTH AMERICA GAS TREATMENT MARKET, BY TECHNOLOGY
10.1 OVERVIEW
10.2 OASE (BASF SE)
10.3 FLEXSORB (EXXON MOBIL CORPORATION)
10.4 ADIP (ROYAL DUTCH SHELL PLC)
10.5 UOP (HONEYWELL INTERNATIONAL INC.)
10.6 SPREX (AXENS)
10.7 OTHERS
11 NORTH AMERICA GAS TREATMENT MARKET, BY INDUSTRY
11.1 OVERVIEW
11.2 POWER PLANTS
11.3 REFINERIES
11.4 METAL & MINING
11.5 OIL & GAS
11.6 PULP & PAPER
11.7 FOOD & BEVERAGES
11.8 OTHERS
12 NORTH AMERICA GAS TREATMENT MARKET, BY REGION
12.1 NORTH AMERICA
12.1.1 U.S.
12.1.2 CANADA
12.1.3 MEXICO
13 NORTH AMERICA GAS TREATMENT MARKET, COMPANY LANDSCAPE
13.1 COMPANY SHARE ANALYSIS: NORTH AMERICA
13.2 PARTNERSHIPS & ACQUISITIONS
13.3 EXPANSIONS
13.4 NEW PRODUCT DEVELOPMENTS
14 SWOT ANALYSIS
15 COMPANY PROFILE
15.1 BASF SE
15.1.1 COMPANY SNAPSHOT
15.1.2 REVENUE ANALYSIS
15.1.3 COMPANY SHARE ANALYSIS
15.1.4 PRODUCT PORTFOLIO
15.1.5 RECENT UPDATES
15.2 DOW
15.2.1 COMPANY SNAPSHOT
15.2.2 REVENUE ANALYSIS
15.2.3 COMPANY SHARE ANALYSIS
15.2.4 PRODUCT PORTFOLIO
15.2.5 RECENT UPDATES
15.3 EXXON MOBIL CORPORATION
15.3.1 COMPANY SNAPSHOT
15.3.2 REVENUE ANALYSIS
15.3.3 COMPANY SHARE ANALYSIS
15.3.4 PRODUCT PORTFOLIO
15.3.5 RECENT UPDATE
15.4 ROYAL DUTCH SHELL PLC
15.4.1 COMPANY SNAPSHOT
15.4.2 REVENUE ANALYSIS
15.4.3 COMPANY SHARE ANALYSIS
15.4.4 PRODUCT PORTFOLIO
15.4.5 RECENT UPDATE
15.5 HONEYWELL INTERNATIONAL INC.
15.5.1 COMPANY SNAPSHOT
15.5.2 REVENUE ANALYSIS
15.5.3 COMPANY SHARE ANALYSIS
15.5.4 PRODUCT PORTFOLIO
15.5.5 RECENT UPDATES
15.6 INEOS
15.6.1 COMPANY SNAPSHOT
15.6.2 REVENUE ANALYSIS
15.6.3 PRODUCT PORTFOLIO
15.6.4 RECENT UPDATE
15.7 EASTMAN CHEMICAL COMPANY
15.7.1 COMPANY SNAPSHOT
15.7.2 REVENUE ANALYSIS
15.7.3 PRODUCT PORTFOLIO
15.7.4 RECENT UPDATES
15.8 CLARIANT
15.8.1 COMPANY SNAPSHOT
15.8.2 REVENUE ANALYSIS
15.8.3 PRODUCT PORTFOLIO
15.8.4 RECENT UPDATES
15.9 ECOLAB
15.9.1 COMPANY SNAPSHOT
15.9.2 REVENUE ANALYSIS
15.9.3 PRODUCT PORTFOLIO
15.9.4 RECENT UPDATES
15.1 AXENS
15.10.1 COMPANY SNAPSHOT
15.10.2 PRODUCT PORTFOLIO
15.10.3 RECENT UPDATE
15.11 BERRYMAN CHEMICAL
15.11.1 COMPANY SNAPSHOT
15.11.2 PRODUCT PORTFOLIO
15.11.3 RECENT UPDATE
15.12 CABOT CORPORATION
15.12.1 COMPANY SNAPSHOT
15.12.2 REVENUE ANALYSIS
15.12.3 PRODUCT PORTFOLIO
15.12.4 RECENT UPDATE
15.13 EUNISELL CHEMICALS
15.13.1 COMPANY SNAPSHOT
15.13.2 PRODUCT PORTFOLIO
15.13.3 RECENT UPDATES
15.14 HUNTSMAN INTERNATIONAL LLC
15.14.1 COMPANY SNAPSHOT
15.14.2 REVENUE ANALYSIS
15.14.3 PRODUCT PORTFOLIO
15.14.4 RECENT UPDATES
15.15 LHOIST
15.15.1 COMPANY SNAPSHOT
15.15.2 PRODUCT PORTFOLIO
15.15.3 RECENT UPDATES
16 QUESTIONNAIRE
17 RELATED REPORTS
Lista de Tabela
TABLE 1 IMPORT DATA OF MACHINERY AND APPARATUS FOR FILTERING OR PURIFYING GASES; HS CODE: 842139 (USD THOUSAND)
TABLE 2 EXPORT DATA OF MACHINERY AND APPARATUS FOR FILTERING OR PURIFYING GASES; HS CODE: 842139 (USD THOUSAND)
TABLE 3 AIR POLLUTION CONTROL REGULATIONS IN EUROPE & U.S.
TABLE 4 NORTH AMERICA GAS TREATMENT MARKET, BY TYPE, 2019-2028 (USD THOUSAND)
TABLE 5 NORTH AMERICA GAS TREATMENT MARKET, BY TYPE, 2019-2028 (TONS)
TABLE 6 NORTH AMERICA TERTIARY AMINE IN GAS TREATMENT MARKET, BY REGION, 2019-2028 (USD THOUSAND)
TABLE 7 NORTH AMERICA TERTIARY AMINE IN GAS TREATMENT MARKET, BY REGION, 2019-2028 (TONS)
TABLE 8 NORTH AMERICA TERTIARY AMINE IN GAS TREATMENT MARKET, BY TYPE, 2019-2028 (USD THOUSAND)
TABLE 9 NORTH AMERICA PRIMARY AMINE IN GAS TREATMENT MARKET, BY REGION, 2019-2028 (USD THOUSAND)
TABLE 10 NORTH AMERICA PRIMARY AMINE TYPE IN GAS TREATMENT MARKET, BY REGION, 2019-2028 (TONS )
TABLE 11 NORTH AMERICA PRIMARY AMINE IN GAS TREATMENT MARKET, BY TYPE, 2019-2028 (USD THOUSAND)
TABLE 12 NORTH AMERICA SECONDARY AMINE IN GAS TREATMENT MARKET, BY REGION, 2019-2028 (USD THOUSAND)
TABLE 13 NORTH AMERICA SECONDARY AMINE IN GAS TREATMENT MARKET, BY REGION, 2019-2028 (TONS)
TABLE 14 NORTH AMERICA SECONDARY AMINE IN GAS TREATMENT MARKET, BY TYPE, 2019-2028 (USD THOUSAND)
TABLE 15 NORTH AMERICA NON-AMINES IN GAS TREATMENT MARKET, BY REGION, 2019-2028 (USD THOUSAND)
TABLE 16 NORTH AMERICA NON-AMINE IN GAS TREATMENT MARKET, BY REGION, 2019-2028 (TONS )
TABLE 17 NORTH AMERICA NON-AMINE IN GAS TREATMENT MARKET, BY TYPE, 2019-2028 (USD THOUSAND)
TABLE 18 NORTH AMERICA GAS TREATMENT MARKET, BY TYPE OF GAS, 2019-2028 (USD THOUSAND)
TABLE 19 NORTH AMERICA ACID GAS IN GAS TREATMENT MARKET, BY REGION, 2019-2028 (USD THOUSAND)
TABLE 20 NORTH AMERICA SYNTHESIS GAS IN GAS TREATMENT MARKET, BY REGION, 2019-2028 (USD THOUSAND)
TABLE 21 NORTH AMERICA GAS TREATMENT MARKET, BY TREATMENT, 2019-2028 (USD THOUSAND)
TABLE 22 NORTH AMERICA ACID GAS REMOVAL IN GAS TREATMENT MARKET, BY REGION, 2019-2028 (USD THOUSAND)
TABLE 23 NORTH AMERICA DEHYDRATION IN GAS TREATMENT MARKET, BY REGION, 2019-2028 (USD THOUSAND)
TABLE 24 NORTH AMERICA OTHERS IN GAS TREATMENT MARKET, BY REGION, 2019-2028 (USD THOUSAND)
TABLE 25 NORTH AMERICA GAS TREATMENT MARKET, BY TECHNOLOGY, 2019-2028 (USD THOUSAND)
TABLE 26 NORTH AMERICA OASE (BASF SE) IN GAS TREATMENT MARKET, BY REGION, 2019-2028 (USD THOUSAND)
TABLE 27 NORTH AMERICA FLEXSORB (EXXON MOBIL CORPORATION) IN GAS TREATMENT MARKET, BY REGION, 2019-2028 (USD THOUSAND)
TABLE 28 NORTH AMERICA ADIP (ROYAL DUTCH SHELL PLC) IN GAS TREATMENT MARKET, BY REGION, 2019-2028 (USD THOUSAND)
TABLE 29 NORTH AMERICA UOP (HONEYWELL INTERNATIONAL INC.) IN GAS TREATMENT MARKET, BY REGION, 2019-2028 (USD THOUSAND)
TABLE 30 NORTH AMERICA SPREX (AXENS) IN GAS TREATMENT MARKET, BY REGION, 2019-2028 (USD THOUSAND)
TABLE 31 NORTH AMERICA OTHERS IN GAS TREATMENT MARKET, BY REGION, 2019-2028 (USD THOUSAND)
TABLE 32 NORTH AMERICA GAS TREATMENT MARKET, BY INDUSTRY, 2019-2028 (USD THOUSAND)
TABLE 33 NORTH AMERICA POWER PLANTS IN GAS TREATMENT MARKET, BY REGION, 2019-2028 (USD THOUSAND)
TABLE 34 NORTH AMERICA REFINERIES IN GAS TREATMENT MARKET, BY REGION, 2019-2028 (USD THOUSAND)
TABLE 35 NORTH AMERICA METAL & MINING IN GAS TREATMENT MARKET, BY REGION, 2019-2028 (USD THOUSAND)
TABLE 36 NORTH AMERICA OIL & GAS IN GAS TREATMENT MARKET, BY REGION, 2019-2028 (USD THOUSAND)
TABLE 37 NORTH AMERICA PULP & PAPER IN GAS TREATMENT MARKET, BY REGION, 2019-2028 (USD THOUSAND)
TABLE 38 NORTH AMERICA FOOD & BEVERAGES IN GAS TREATMENT MARKET, BY REGION, 2019-2028 (USD THOUSAND)
TABLE 39 NORTH AMERICA OTHERS IN GAS TREATMENT MARKET, BY REGION, 2019-2028 (USD THOUSAND)
TABLE 40 NORTH AMERICA GAS TREATMENT MARKET, BY COUNTRY,2019-2028 (USD THOUSAND)
TABLE 41 NORTH AMERICA GAS TREATMENT MARKET, BY COUNTRY,2019-2028 (TONS)
TABLE 42 NORTH AMERICA GAS TREATMENT MARKET, BY TYPE, 2019-2028 (USD THOUSAND)
TABLE 43 NORTH AMERICA GAS TREATMENT MARKET, BY TYPE, 2019-2028 (TONS)
TABLE 44 NORTH AMERICA PRIMARY AMINE IN GAS TREATMENT MARKET, BY TYPE, 2019-2028 (USD THOUSAND)
TABLE 45 NORTH AMERICA SECONDARY AMINE IN GAS TREATMENT MARKET, BY TYPE, 2019-2028 (USD THOUSAND)
TABLE 46 NORTH AMERICA TERTIARY AMINE IN GAS TREATMENT MARKET, BY TYPE, 2019-2028 (USD THOUSAND)
TABLE 47 NORTH AMERICA NON-AMINES AMINE IN GAS TREATMENT MARKET, BY TYPE, 2019-2028 (USD THOUSAND)
TABLE 48 NORTH AMERICA GAS TREATMENT MARKET, BY TYPE OF GAS, 2019-2028 (USD THOUSAND)
TABLE 49 NORTH AMERICA GAS TREATMENT MARKET, BY TREATMENT, 2019-2028 (USD THOUSAND)
TABLE 50 NORTH AMERICA GAS TREATMENT MARKET, BY TECHNOLOGY, 2019-2028 (USD THOUSAND)
TABLE 51 NORTH AMERICA GAS TREATMENT MARKET, BY INDUSTRY, 2019-2028 (USD THOUSAND)
TABLE 52 U.S. GAS TREATMENT MARKET, BY TYPE, 2019-2028 (USD THOUSAND)
TABLE 53 U.S. GAS TREATMENT MARKET, BY TYPE, 2019-2028 (TONS)
TABLE 54 U.S. PRIMARY AMINE IN GAS TREATMENT MARKET, BY TYPE, 2019-2028 (USD THOUSAND)
TABLE 55 U.S. SECONDARY AMINE IN GAS TREATMENT MARKET, BY TYPE, 2019-2028 (USD THOUSAND)
TABLE 56 U.S. TERTIARY AMINE IN GAS TREATMENT MARKET, BY TYPE, 2019-2028 (USD THOUSAND)
TABLE 57 U.S. NON-AMINES AMINE IN GAS TREATMENT MARKET, BY TYPE, 2019-2028 (USD THOUSAND)
TABLE 58 U.S. GAS TREATMENT MARKET, BY TYPE OF GAS, 2019-2028 (USD THOUSAND)
TABLE 59 U.S. GAS TREATMENT MARKET, BY TREATMENT, 2019-2028 (USD THOUSAND)
TABLE 60 U.S. GAS TREATMENT MARKET, BY TECHNOLOGY, 2019-2028 (USD THOUSAND)
TABLE 61 U.S. GAS TREATMENT MARKET, BY INDUSTRY, 2019-2028 (USD THOUSAND)
TABLE 62 CANADA GAS TREATMENT MARKET, BY TYPE, 2019-2028 (USD THOUSAND)
TABLE 63 CANADA GAS TREATMENT MARKET, BY TYPE, 2019-2028 (TONS)
TABLE 64 CANADA PRIMARY AMINE IN GAS TREATMENT MARKET, BY TYPE, 2019-2028 (USD THOUSAND)
TABLE 65 CANADA SECONDARY AMINE IN GAS TREATMENT MARKET, BY TYPE, 2019-2028 (USD THOUSAND)
TABLE 66 CANADA TERTIARY AMINE IN GAS TREATMENT MARKET, BY TYPE, 2019-2028 (USD THOUSAND)
TABLE 67 CANADA NON-AMINES AMINE IN GAS TREATMENT MARKET, BY TYPE, 2019-2028 (USD THOUSAND)
TABLE 68 CANADA GAS TREATMENT MARKET, BY TYPE OF GAS, 2019-2028 (USD THOUSAND)
TABLE 69 CANADA GAS TREATMENT MARKET, BY TREATMENT, 2019-2028 (USD THOUSAND)
TABLE 70 CANADA GAS TREATMENT MARKET, BY TECHNOLOGY, 2019-2028 (USD THOUSAND)
TABLE 71 CANADA GAS TREATMENT MARKET, BY INDUSTRY, 2019-2028 (USD THOUSAND)
TABLE 72 MEXICO GAS TREATMENT MARKET, BY TYPE, 2019-2028 (USD THOUSAND)
TABLE 73 MEXICO GAS TREATMENT MARKET, BY TYPE, 2019-2028 (TONS)
TABLE 74 MEXICO PRIMARY AMINE IN GAS TREATMENT MARKET, BY TYPE, 2019-2028 (USD THOUSAND)
TABLE 75 MEXICO SECONDARY AMINE IN GAS TREATMENT MARKET, BY TYPE, 2019-2028 (USD THOUSAND)
TABLE 76 MEXICO TERTIARY AMINE IN GAS TREATMENT MARKET, BY TYPE, 2019-2028 (USD THOUSAND)
TABLE 77 MEXICO NON-AMINES AMINE IN GAS TREATMENT MARKET, BY TYPE, 2019-2028 (USD THOUSAND)
TABLE 78 MEXICO GAS TREATMENT MARKET, BY TYPE OF GAS, 2019-2028 (USD THOUSAND)
TABLE 79 MEXICO GAS TREATMENT MARKET, BY TREATMENT, 2019-2028 (USD THOUSAND)
TABLE 80 MEXICO GAS TREATMENT MARKET, BY TECHNOLOGY, 2019-2028 (USD THOUSAND)
TABLE 81 MEXICO GAS TREATMENT MARKET, BY INDUSTRY, 2019-2028 (USD THOUSAND)
Lista de Figura
FIGURE 1 NORTH AMERICA GAS TREATMENT MARKET: SEGMENTATION
FIGURE 2 NORTH AMERICA GAS TREATMENT MARKET: DATA TRIANGULATION
FIGURE 3 NORTH AMERICA GAS TREATMENT MARKET: DROC ANALYSIS
FIGURE 4 NORTH AMERICA GAS TREATMENT MARKET: NORTH AMERICA VS REGIONAL MARKET ANALYSIS
FIGURE 5 NORTH AMERICA GAS TREATMENT MARKET: COMPANY RESEARCH ANALYSIS
FIGURE 6 NORTH AMERICA GAS TREATMENT MARKET: THE TYPE OF GAS LIFE LINE CURVE
FIGURE 7 NORTH AMERICA GAS TREATMENT MARKET: INTERVIEW DEMOGRAPHICS
FIGURE 8 NORTH AMERICA GAS TREATMENT MARKET: DBMR MARKET POSITION GRID
FIGURE 9 NORTH AMERICA GAS TREATMENT MARKET: MARKET INDUSTRY COVERAGE GRID
FIGURE 10 NORTH AMERICA GAS TREATMENT MARKET: THE MARKET CHALLENGE MATRIX
FIGURE 11 NORTH AMERICA GAS TREATMENT MARKET: VENDOR SHARE ANALYSIS
FIGURE 12 NORTH AMERICA GAS TREATMENT MARKET: SEGMENTATION
FIGURE 13 NORTH AMERICA IS EXPECTED TO DOMINATE THE NORTH AMERICA GAS TREATMENT MARKET AND IS EXPECTED TO GROW WITH THE HIGHEST CAGR IN THE FORECAST PERIOD OF 2021 TO 2028
FIGURE 14 INCREASING DEMAND FOR NATURAL GAS OWING TO ITS LOW ENVIRONMENTAL FOOTPRINT IS DRIVING THE NORTH AMERICA GAS TREATMENT MARKET IN THE FORECAST PERIOD OF 2021 TO 2028
FIGURE 15 TERTIARY AMINE IS EXPECTED TO ACCOUNT FOR THE LARGEST SHARE OF THE NORTH AMERICA GAS TREATMENT MARKET IN 2021 & 2028
FIGURE 16 DRIVERS, RESTRAINTS, OPPORTUNITIES, AND CHALLENGES OF NORTH AMERICA GAS TREATMENT MARKET
FIGURE 17 NORTH AMERICA NATURAL GAS CONSUMPTION, TERA JOULE, (1990-2019)
FIGURE 18 NATURAL GAS CONSUMPTION IN U.S., 2019
FIGURE 19 PERCENTAGE BREAKDOWN OF COST SHARES FOR ONSHORE OIL AND NATURAL GAS DRILLING AND COMPLETION
FIGURE 20 NATURAL GAS RESERVES BY COUNTRY (MMCF) IN 2017
FIGURE 21 NORTH AMERICA GAS TREATMENT MARKET: BY TYPE, 2020
FIGURE 22 NORTH AMERICA GAS TREATMENT MARKET: BY TYPE OF GAS, 2020
FIGURE 23 NORTH AMERICA GAS TREATMENT MARKET: BY TREATMENT, 2020
FIGURE 24 NORTH AMERICA GAS TREATMENT MARKET: BY TECHNOLOGY, 2020
FIGURE 25 NORTH AMERICA GAS TREATMENT MARKET: BY INDUSTRY, 2020
FIGURE 26 NORTH AMERICA GAS TREATMENT MARKET: SNAPSHOT (2020)
FIGURE 27 NORTH AMERICA GAS TREATMENT MARKET: BY COUNTRY (2020)
FIGURE 28 NORTH AMERICA GAS TREATMENT MARKET: BY COUNTRY (2021 & 2028)
FIGURE 29 NORTH AMERICA GAS TREATMENT MARKET: BY COUNTRY (2020 & 2028)
FIGURE 30 NORTH AMERICA GAS TREATMENT MARKET: BY TYPE (2021-2028)
FIGURE 31 NORTH AMERICA GAS TREATMENT MARKET: COMPANY SHARE 2020 (%)
Metodologia de Investigação
A recolha de dados e a análise do ano base são feitas através de módulos de recolha de dados com amostras grandes. A etapa inclui a obtenção de informações de mercado ou dados relacionados através de diversas fontes e estratégias. Inclui examinar e planear antecipadamente todos os dados adquiridos no passado. Da mesma forma, envolve o exame de inconsistências de informação observadas em diferentes fontes de informação. Os dados de mercado são analisados e estimados utilizando modelos estatísticos e coerentes de mercado. Além disso, a análise da quota de mercado e a análise das principais tendências são os principais fatores de sucesso no relatório de mercado. Para saber mais, solicite uma chamada de analista ou abra a sua consulta.
A principal metodologia de investigação utilizada pela equipa de investigação do DBMR é a triangulação de dados que envolve a mineração de dados, a análise do impacto das variáveis de dados no mercado e a validação primária (especialista do setor). Os modelos de dados incluem grelha de posicionamento de fornecedores, análise da linha de tempo do mercado, visão geral e guia de mercado, grelha de posicionamento da empresa, análise de patentes, análise de preços, análise da quota de mercado da empresa, normas de medição, análise global versus regional e de participação dos fornecedores. Para saber mais sobre a metodologia de investigação, faça uma consulta para falar com os nossos especialistas do setor.
Personalização disponível
A Data Bridge Market Research é líder em investigação formativa avançada. Orgulhamo-nos de servir os nossos clientes novos e existentes com dados e análises que correspondem e atendem aos seus objetivos. O relatório pode ser personalizado para incluir análise de tendências de preços de marcas-alvo, compreensão do mercado para países adicionais (solicite a lista de países), dados de resultados de ensaios clínicos, revisão de literatura, mercado remodelado e análise de base de produtos . A análise de mercado dos concorrentes-alvo pode ser analisada desde análises baseadas em tecnologia até estratégias de carteira de mercado. Podemos adicionar quantos concorrentes necessitar de dados no formato e estilo de dados que procura. A nossa equipa de analistas também pode fornecer dados em tabelas dinâmicas de ficheiros Excel em bruto (livro de factos) ou pode ajudá-lo a criar apresentações a partir dos conjuntos de dados disponíveis no relatório.

