Mercado Europeu de Ingredientes Bioativos – Tendências da Indústria e Previsão para 2028

Pedido de resumo Pedido de TOC Fale com Analista Fale com o analista  Comprar agora Comprar agora Consulte antes Comprar Consulte antes Relatório de amostra grátis Relatório de amostra grátis

Mercado Europeu de Ingredientes Bioativos – Tendências da Indústria e Previsão para 2028

  • Food & Beverage
  • Publish Reports
  • Aug 2021
  • Europe
  • 350 Páginas
  • Número de tabelas: 290
  • Número de figuras: 9

O mercado europeu de revestimentos hidrofóbicos está segmentado por tipo de ingrediente (prebióticos, probióticos, aminoácidos, peptídeos, ómega 3 e lipi estruturados, fitoquímicos e extratos vegetais, minerais, vitaminas, fibras e hidratos de carbono especiais, carotenóides e antioxidantes e outros), aplicação ( funcional Alimentos, suplementos alimentares, suplementos de goma, nutrição animal, cuidados pessoais e outros) e origem (vegetal, animal e microbiana), país (Alemanha, Reino Unido, França, Itália, Espanha, Holanda, Bélgica, Rússia, Turquia, Suíça , Dinamarca , Suécia, Polónia, resto da Europa), tendências e previsões da indústria para 2028.

Mercado europeu de ingredientes bioativosAnálise de Mercado e Insights: Mercado Europeu de Ingredientes Bioativos

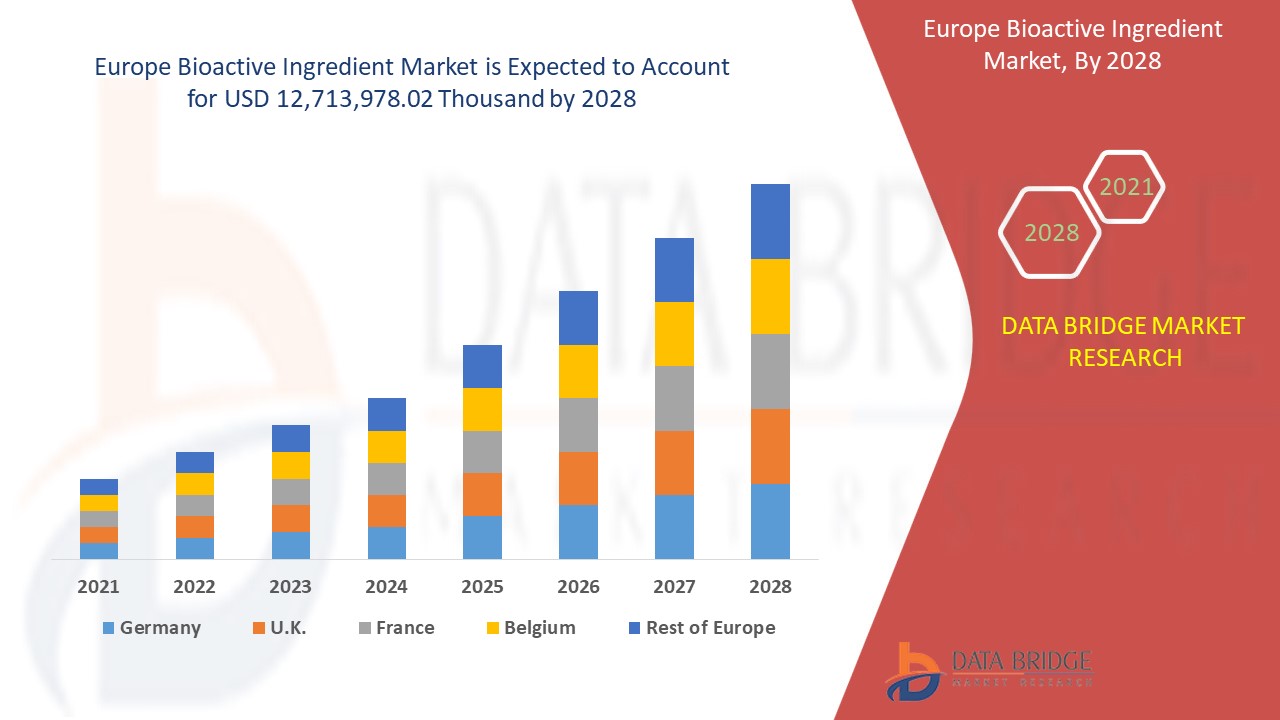
Espera-se que o mercado europeu de ingredientes bioativos ganhe crescimento de mercado no período de previsão de 2021 a 2028. A Data Bridge Market Research analisa que o mercado está a crescer a um CAGR de 7,1% no período de previsão de 2021 a 2028 e deverá atingir os 12.713.978,02 mil dólares até 2028.

Os ingredientes bioativos são substâncias que têm um efeito biológico nos organismos vivos. Os componentes provêm de uma variedade de fontes, incluindo plantas, alimentos, animais, mar e microrganismos. As substâncias bioativas são adicionadas aos alimentos e rações para melhorar a saúde física e fisiológica dos clientes. Os alimentos e bebidas funcionais, os suplementos nutricionais e a nutrição dos recém-nascidos fazem um uso extensivo de substâncias bioativas. Estes produtos químicos podem ajudar a prevenir o cancro, doenças cardíacas e outras doenças.

As substâncias bioativas são amplamente utilizadas em diversos setores, incluindo alimentos e bebidas, medicamentos e nutracêuticos, artigos de higiene pessoal e rações para animais. Os carotenóides, os óleos essenciais e os antioxidantes são exemplos de substâncias bioativas utilizadas em refeições funcionais para melhorar as suas qualidades sensoriais e nutricionais. São uma espécie de biomoléculas que auxiliam no processo metabólico de moléculas saudáveis ​​adicionadas aos alimentos e a vários tipos de produtos.

O relatório de mercado de ingredientes bioativos fornece detalhes de quota de mercado, novos desenvolvimentos e análise de pipeline de produtos, impacto dos participantes do mercado doméstico e localizado, analisa as oportunidades em termos de bolsas de receitas emergentes, alterações nas regulamentações de mercado, aprovações de produtos, decisões estratégicas, lançamentos de produtos, geográficas expansões e inovações tecnológicas no mercado. Para compreender a análise e o cenário do mercado contacte-nos para um Analyst Brief, a nossa equipa irá ajudá-lo a criar uma solução de impacto na receita para atingir o objetivo desejado.

Mercado europeu de ingredientes bioativosÂmbito do mercado de ingredientes bioativos da Europa e dimensão do mercado

O mercado europeu de ingredientes bioativos está categorizado em três segmentos notáveis, que se baseiam no tipo de ingrediente, aplicação e fonte. O crescimento entre segmentos ajuda-o a analisar os nichos de crescimento e as estratégias para abordar o mercado e determinar as suas principais áreas de aplicação e a diferença nos seus mercados-alvo.

  • Com base no tipo de ingrediente, o mercado global de ingredientes bioativos está segmentado em prebióticos, probióticos, aminoácidos , peptídeos, ómega 3 e lípidos estruturados, fitoquímicos e extratos vegetais, minerais, vitaminas, fibras e hidratos de carbono especiais, carotenóides e antioxidantes e outros. O prebiótico é ainda segmentado em frutanos, galacto-oligossacarídeos, oligossacarídeos derivados de amido e glucose, oligossacarídeos não hidratos de carbono e outros. Os probióticos são ainda segmentados em lactobacilos, bifidobactérias e leveduras. O aminoácido é ainda segmentado em isoleucina, histidina, leucina, lisina, metionina, fenilalanina, treonina, triptofano, valina e outros. Os péptidos são ainda segmentados em dipéptidos, tripéptidos, oligopéptidos e polipéptidos. Os minerais são ainda segmentados em cálcio , fósforo, magnésio, sódio, potássio, manganês, ferro, cobre, iodo, zinco e outros. As vitaminas estão ainda segmentadas em vitamina A, vitamina C, vitamina D, vitamina E, vitamina K, vitamina B1, vitamina B2, vitamina B3, vitamina B6, vitamina B12 e outras.
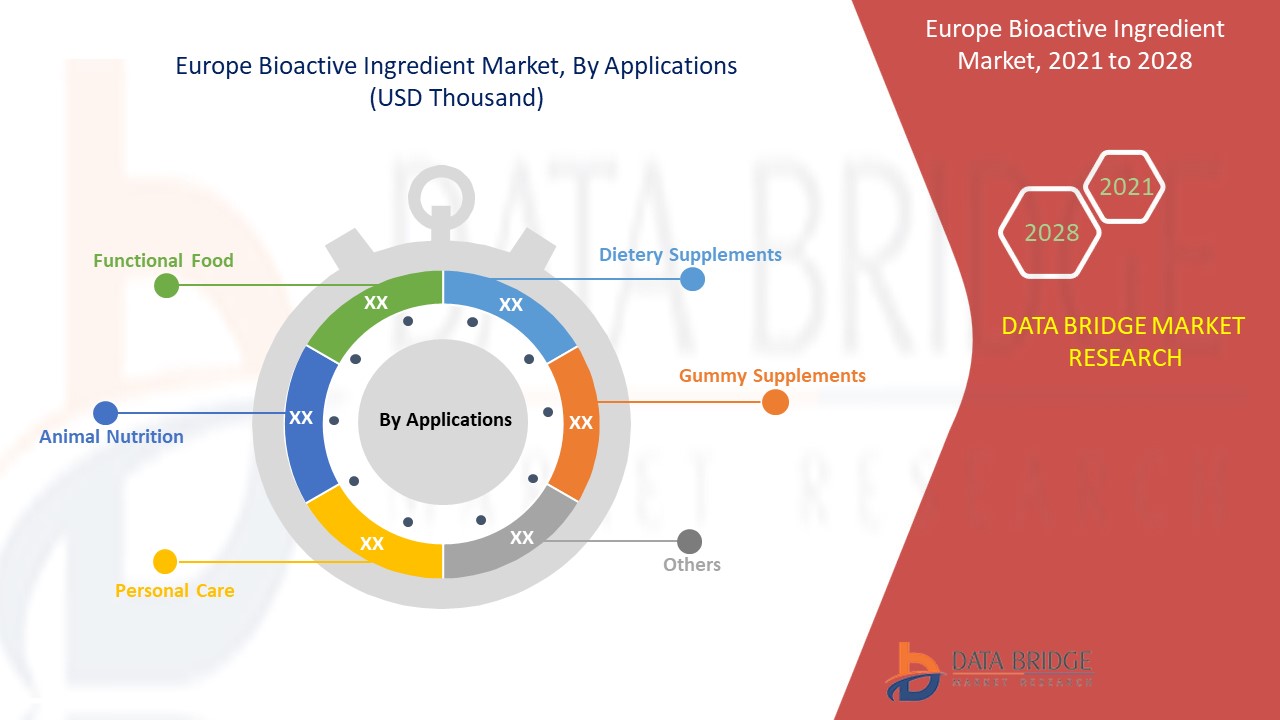
  • Com base na aplicação, o mercado global de ingredientes bioativos está segmentado em alimentos funcionais, suplementos alimentares, suplementos de goma, nutrição animal, cuidados pessoais, entre outros. Os alimentos funcionais são ainda segmentados em lacticínios, alternativas lácteas, pão, massas, cereais, ovoprodutos, snack-bares, barras e bebidas . Os produtos lácteos estão subsegmentados em leite, iogurte, queijo, manteiga e outros. As alternativas lácteas estão ainda subsegmentadas em leite vegetal, iogurte vegetal, ingredientes bioativos e outros. As barras estão subsegmentadas em barras de proteína, barras de nutrição desportiva, barras de ioga, barras pré-treino, barras pós-treino e outras. As bebidas estão subsegmentadas em sumos e smoothies. A nutrição animal está ainda segmentada por categoria animal em carne de bovino, aves, marisco e suínos. Os cuidados pessoais são ainda segmentados em cuidados capilares e cuidados com a pele.
  • Com base na fonte, o mercado global de ingredientes bioativos está segmentado em plantas, animais e microbianos.

Análise ao nível do país do mercado de ingredientes bioativos da Europa

O mercado europeu de ingredientes bioativos é analisado e a informação sobre o tamanho do mercado é fornecida por Ingrediente, Aplicação, Fonte.

Os países abrangidos no relatório de mercado de Ingredientes Bioativos da Europa são a Alemanha, o Reino Unido, a França, a Itália, a Espanha, os Países Baixos, a Bélgica, a Rússia, a Turquia, a Suíça, a Polónia, a Dinamarca e o Resto da Europa.

O mercado europeu de ingredientes bioativos está a dominar o mercado devido à crescente população e ao aumento de doenças em grande parte da sociedade

A secção do país do relatório também fornece fatores individuais de impacto no mercado e alterações na regulamentação do mercado interno que impactam as tendências atuais e futuras do mercado. Dados como novas vendas, vendas de reposição, demografia do país, atos regulamentares e tarifas de importação e exportação são alguns dos principais indicadores utilizados para prever o cenário de mercado para países individuais. Além disso, a presença e a disponibilidade das marcas e os desafios enfrentados devido à grande ou escassa concorrência de marcas locais e nacionais, o impacto dos canais de vendas são considerados ao mesmo tempo que fornecem uma análise de previsão dos dados do país.

Crescimento na indústria de ingredientes bioativos

O mercado europeu de ingredientes bioativos também fornece análises de mercado detalhadas para o crescimento de cada país na base instalada de diferentes tipos de produtos para o mercado de ingredientes bioativos, impacto da tecnologia utilizando curvas de linha de vida e mudanças nos cenários regulamentares das fórmulas infantis e o seu impacto no mercado dos ingredientes bioativos. Os dados estão disponíveis para o período histórico de 2010 a 2019.

Análise do cenário competitivo e da quota de mercado dos ingredientes bioativos

O panorama competitivo do mercado europeu de ingredientes bioativos fornece detalhes por concorrente. Os detalhes incluídos são a visão geral da empresa, finanças da empresa, receitas geradas, potencial de mercado, investimento em investigação e desenvolvimento, novas iniciativas de mercado, presença global, localizações e instalações de produção, pontos fortes e fracos da empresa, lançamento de produtos , pipeline de ensaios clínicos, análise de marca, aprovações de produtos , patentes, largura e respiração do produto, domínio da aplicação, curva da linha de vida da tecnologia. Os dados acima fornecidos estão apenas relacionados com o foco da empresa relacionado com o mercado europeu de ingredientes bioativos.

Os principais players do mercado envolvidos no mercado global de ingredientes bioativos são a DSM, BASF SE, Kerry, DuPont, ADM, Global Bio-chem Technology Group Company Limited, Evonik Industries AG, Cargill, Incorporated, Arla Food Ingredients Group P/S (uma subsidiária da Arla Foods amba), FMC Corporation, Sunrise Nutrachem Group, Adisseo (uma subsidiária da Bluestar Adisseo Co., Ltd.), Chr.Hansen Holding A/S, Sabinsa, Ajinomoto Co., Inc, NOVUS INTERNATIONAL (uma subsidiária da Mitsui & Co. (EUA), Inc.), Ingredion, Roquette Frères, Probi e Advanced Animal Nutrition Pty Ltd., entre outros.

Por exemplo,

  • Em junho de 2020, a Sabinsa lançou um novo ingrediente de extrato de ervas, as 'Curcuminas', que ajuda a estimular o sistema imunitário. O produto foi implementado para trazer uma nova solução para o mercado em tempos de COVID-19


SKU-

Obtenha acesso online ao relatório sobre a primeira nuvem de inteligência de mercado do mundo

  • Painel interativo de análise de dados
  • Painel de análise da empresa para oportunidades de elevado potencial de crescimento
  • Acesso de analista de pesquisa para personalização e customização. consultas
  • Análise da concorrência com painel interativo
  • Últimas notícias, atualizações e atualizações Análise de tendências
  • Aproveite o poder da análise de benchmark para um rastreio abrangente da concorrência
Pedido de demonstração

Índice

  1. introduction
    1. OBJECTIVES OF THE STUDY
    2. MARKET DEFINITION
    3. OVERVIEW of EUROPE BIOACTIVE INGREDIENT MARKET
    4. LIMITATION
    5. MARKETS COVERED
  2. MARKET SEGMENTATION
    1. MARKETS COVERED
    2. geographicAL scope
    3. years considered for the study
    4. currency and pricing
    5. DBMR TRIPOD DATA VALIDATION MODEL
    6. Ingredient LIFE LINE CURVE
    7. MULTIVARIATE MODELING
    8. primary interviews with key opinion leaders
    9. DBMR MARKET POSITION GRID
    10. MARKET application COVERAGE GRID
    11. DBMR MARKET CHALLENGE MATRIX
    12. vendor share analysis
    13. IMPORT-EXPORT DATA
    14. secondary sourcEs
    15. assumptions
  3. EXECUTIVE SUMMARY
  4. premium insights
    1. Factors Influencing Purchasing Decision:
    2. MAJOR BRANDS COMPETITIVE ANALYSIS:
      1. NEW PRODUCT BRAND LAUNCHES AND INNOVATIONS
      2. Investments Made by Top Manufacturers
    3. REGULATORY FRAMEWORK AND GUIDELINES
    4. supply chain analysis
  5. market overview
    1. drivers
      1. Progressive use of bioactive ingredients in personal care products
      2. Growth in the co-prescription of bioactive ingredient along with traditional drugs
      3. Rising demand of bioactive ingredients in functional food
      4. Increasing adoption of bioactive ingredients in pharmaceuticals for chronic diseases
      5. Surge in the incidence of lifestyle diseases and lack of nutrition
    2. RESTRAINTS
      1. Lack of regulatory framework for validating heath claims
      2. Therapeutic constraints allied with bioactive ingredient
      3. Inadequate controls on safety and quality of bioactive ingredients
    3. OPPORTUNITIES
      1. Increasing awareness among consumers with rising preference for prevention instead of cure
      2. ADVANCEMENT IN R&D ASSOCIATED WITH ENCAPSULATION OF BIOACTIVE INGREDIENTS
      3. Growing trust among the consumers towards herbal ingredients and its involvement in bioactive market
    4. Challenges
      1. EXTRACTION OF THE BIOACTIVE COMPOUNDS AND MAINTAINING GOOD RECOVERY
      2. Valorization of fruit and vegetable wastes as bioactive compounds
  6. Analysis on Impact of Covid-19 on ‘Europe Bioactive ingredient Market”
    1. IMPACT ON PRICE
    2. IMPACT ON DEMAND
    3. Impact on supply chain
    4. Conclusion
  7. Europe Bioactive ingredient market, BY Ingredient Type
    1. overview
    2. Peptides
      1. Dipeptides
      2. Tripeptides
      3. Oligopeptides
      4. Polypeptides
    3. Prebiotic
      1. Fructans
      2. Galacto-Oligosaccharides
      3. Starch and Glucose-Derived Oligosaccharides
      4. Non-Carbohydrate Oligosaccharides
      5. Others
    4. Probiotics
      1. Lactobacilli
      2. Bifidobacteria
      3. Yeasts
    5. Minerals
      1. Zinc
      2. Calcium
      3. Phosphorus
      4. Magnesium
      5. Sodium
      6. Potassium
      7. Manganese
      8. Iron
      9. Copper
      10. Iodine
      11. Others
    6. Vitamins
      1. Vitamin A
      2. Vitamin c
      3. Vitamin d
      4. Vitamin E
      5. Vitamin K
      6. Vitamin B1
      7. Vitamin B2
      8. Vitamin B3
      9. Vitamin B6
      10. Vitamin B12
      11. Others
    7. Amino Acid
      1. Isoleucine
      2. Histidine
      3. Leucine
      4. Lysine
      5. Methionine
      6. Phenylalanine
      7. Threonine
      8. Tryptophan
      9. Valine
      10. Others
    8. Omega 3 and Structured Lipi
    9. Phytochemicals & Plant Extracts
    10. Fibers and Specialty Carbohydrates
    11. Carotenoids & Antioxidants
    12. Others
  8. Europe Bioactive ingredient market, BY Applications
    1. overview
    2. Functional Food
      1. Dairy
        1. Milk
        2. Yogurt
        3. Cheese
        4. Butter
        5. Others
    3. Dairy Alternatives
      1. Plant-Based Milk
      2. Plant-Based Yogurt
      3. Bioactive Ingredients
      4. Others
    4. Bread
    5. Cereal
    6. Egg Products
    7. Beverages
      1. Juices
      2. Smoothies
    8. Bars
      1. Protein Bars
      2. Sports Nutrition Bars
      3. Pre Work Out Bars
      4. Post Work Out Bars
      5. Others
    9. Pasta
    10. Snack Bars
    11. Animal Nutrition
      1. ANIMAL NUTRITION, BY ANIMAL CATEGORY
        1. Poultry
        2. Seafood
        3. Beef
        4. Pork
    12. Personal Care
      1. Hair Care
      2. Skin Care
    13. Dietary Supplements
    14. Gummy Supplements
    15. Others
  9. Europe Bioactive ingredient market, BY Source
    1. overview
    2. Plant
    3. Animal
    4. Microbial
  10. EUROPE Bioactive ingredient Market, BY GEOGRAPHY
    1. Europe
      1. Germany
      2. U.K.
      3. France
      4. ITALY
      5. Spain
      6. Netherlands
      7. Belgium
      8. Russia
      9. Turkey
      10. SWItzerland
      11. Denmark
      12. Sweden
      13. Poland
      14. Rest of Europe
  11. EUROPE BIOACTIVE INGREDIENT MARKET: COMPANY landscape
    1. company share analysis: EUROPE
  12. COMPANY PROFILE
    1. dsm
      1. COMPANY SNAPSHOT
      2. REVENUE ANALYSIS
      3. COMPANY SHARE ANALYSIS
      4. PRODUCT PORTFOLIO
      5. RECENT UPDATE
    2. basf se
      1. COMPANY SNAPSHOT
      2. REVENUE ANALYSIS
      3. COMPANY SHARE ANALYSIS
      4. PRODUCT PORTFOLIO
      5. RECENT UPDATES
    3. KERRY
      1. COMPANY SNAPSHOT
      2. REVENUE ANALYSIS
      3. COMPANY SHARE ANALYSIS
      4. PRODUCT PORTFOLIO
      5. RECENT UPDATE
    4. dupont
      1. COMPANY SNAPSHOT
      2. REVENUE ANALYSIS
      3. COMPANY SHARE ANALYSIS
      4. PRODUCT PORTFOLIO
      5. RECENT UPDATES
    5. ADM
      1. COMPANY SNAPSHOT
      2. REVENUE ANALYSIS
      3. COMPANY SHARE ANALYSIS
      4. PRODUCT PORTFOLIO
      5. RECENT UPDATE
    6. EUROPE BIO-CHEM TECHNOLOGY GROUP COMPANY LIMITED
      1. COMPANY SNAPSHOT
      2. REVENUE ANALYSIS
      3. PRODUCT PORTFOLIO
      4. RECENT UPDATE
    7. EVONIK Industries AG
      1. COMPANY SNAPSHOT
      2. REVENUE ANALYSIS
      3. PRODUCT PORTFOLIO
      4. RECENT UPDATE
    8. CARGILL, Incorporated
      1. COMPANY SNAPSHOT
      2. REVENUE ANALYSIS
      3. PRODUCT PORTFOLIO
      4. RECENT UPDATE
    9. Adisseo (A subsidiary of bluestar adisseo co., ltd.)
      1. COMPANY SNAPSHOT
      2. REVENUE ANALYSIS
      3. PRODUCT PORTFOLIO
      4. RECENT UPDATE
    10. Advanced animal nutrition pty ltd.
      1. COMPANY SNAPSHOT
      2. PRODUCT PORTFOLIO
      3. RECENT UPDATE
    11. Ajinomoto Co., Inc.
      1. COMPANY SNAPSHOT
      2. REVENUE ANALYSIS
      3. PRODUCT PORTFOLIO
      4. RECENT UPDATES
    12. Arla Food Ingrediants Group P/S (a subsidiary of Arla foods amba)
      1. COMPANY SNAPSHOT
      2. REVENUE ANALYSIS
      3. PRODUCT PORTFOLIO
      4. RECENT UPDATES
    13. Chr. hansen holding a/s
      1. COMPANY SNAPSHOT
      2. REVENUE ANALYSIS
      3. PRODUCT PORTFOLIO
      4. RECENT UPDATES
    14. FMC CORPORATION
      1. COMPANY SNAPSHOT
      2. REVENUE ANALYSIS
      3. PRODUCT PORTFOLIO
      4. RECENT UPDATE
    15. INGREDION
      1. COMPANY SNAPSHOT
      2. REVENUE ANALYSIS
      3. PRODUCT PORTFOLIO
      4. RECENT UPDATE
    16. novus international (A SUBSIDIARY OF Mitsui & Co. (U.S.A.), Inc.)
      1. COMPANY SNAPSHOT
      2. REVENUE ANALYSIS
      3. PRODUCT PORTFOLIO
      4. RECENT UPDATE
    17. pROBI
      1. COMPANY SNAPSHOT
      2. REVENUE ANALYSIS
      3. SOLUTION PORTFOLIO
      4. RECENT UPDATE
    18. Roquette FrèreS
      1. COMPANY SNAPSHOT
      2. PRODUCT PORTFOLIO
      3. RECENT UPDATE
    19. SabinsA
      1. COMPANY SNAPSHOT
      2. PRODUCT PORTFOLIO
      3. RECENT UPDATES
    20. sunrise nutrachem grouP
      1. COMPANY SNAPSHOT
      2. PRODUCT PORTFOLIO
      3. RECENT UPDATES
  13. QUESTIONNAIRES
  14. related reports

Lista de Tabela

TABLE 1 IMPORT DATA of Food preparations, n.e.s.; HS Code - 210690 (USD Thousand)

TABLE 2 EXPORT DATA OF FOOD PREPARATIONS, N.E.S.; HS CODE - 210690 (USD THOUSAND)

TABLE 1 Europe bioactive ingredient market, By Ingredient Type, 2019-2028 (USD Thousand)

TABLE 2 Europe Bioactive ingredient Market, By Ingredient Type, 2019-2028 (Tons)

TABLE 3 Europe Peptides in bioactive ingredient MARKET, BY REGION, 2019-2028 (USD Thousand)

TABLE 4 Europe Peptides in bioactive ingredient MARKET, BY REGION, 2019-2028 (Tons)

TABLE 5 Europe Peptides in Bioactive Ingredient Market, By Ingredient Type, 2019-2028 (USD Thousand)

TABLE 6 Europe prebiotic in bioactive ingredient MARKET, BY REGION, 2019-2028 (USD Thousand)

TABLE 7 Europe prebiotic in bioactive ingredient MARKET, BY REGION, 2019-2028 (Tons)

TABLE 8 Europe Prebiotic in Bioactive Ingredient Market, By Ingredient Type, 2019-2028 (USD Thousand)

TABLE 9 Europe Probiotics in bioactive ingredient MARKET, BY REGION, 2019-2028 (USD Thousand)

TABLE 10 Europe Probiotics in bioactive ingredient MARKET, BY REGION, 2019-2028 (Tons)

TABLE 11 Europe Probiotic in Bioactive Ingredient Market, By Ingredient Type, 2019-2028 (USD Thousand)

TABLE 12 Europe Minerals in bioactive ingredient MARKET, BY REGION, 2019-2028 (USD Thousand)

TABLE 13 Europe Minerals in bioactive ingredient MARKET, BY REGION, 2019-2028 (Tons)

TABLE 14 Europe Minerals in Bioactive Ingredient Market, By Ingredient Type, 2019-2028 (USD Thousand)

TABLE 15 Europe Vitamins in bioactive ingredient MARKET, BY REGION, 2019-2028 (USD Thousand)

TABLE 16 Europe Vitamins in bioactive ingredient MARKET, BY REGION, 2019-2028 (Tons)

TABLE 17 Europe Vitamins in Bioactive Ingredient Market, By Ingredient Type, 2019-2028 (USD Thousand)

TABLE 18 Europe Amino Acid in bioactive ingredient MARKET, BY REGION, 2019-2028 (USD Thousand)

TABLE 19 Europe Amino Acid in bioactive ingredient MARKET, BY REGION, 2019-2028 (Tons)

TABLE 20 Europe AMINO ACID in Bioactive Ingredient Market, By Ingredient Type, 2019-2028 (USD Thousand)

TABLE 21 Europe Omega 3 and Structured Lipi in bioactive ingredient MARKET, BY REGION, 2019-2028 (USD Thousand)

TABLE 22 Europe Omega 3 and Structured Lipi in bioactive ingredient MARKET, BY REGION, 2019-2028 (Tons)

TABLE 23 Europe Phytochemicals & Plant Extracts in bioactive ingredient MARKET, BY REGION, 2019-2028 (USD Thousand)

TABLE 24 Europe Phytochemicals & Plant Extracts in bioactive ingredient MARKET, BY REGION, 2019-2028 (Tons)

TABLE 25 Europe Fibers and Specialty Carbohydrates in bioactive ingredient MARKET, BY REGION, 2019-2028 (USD Thousand)

TABLE 26 Europe Fibers and Specialty Carbohydrates in bioactive ingredient MARKET, BY REGION, 2019-2028 (Tons)

TABLE 27 Europe Carotenoids & Antioxidants in bioactive ingredient MARKET, BY REGION, 2019-2028 (USD Thousand)

TABLE 28 Europe Carotenoids & Antioxidants in bioactive ingredient MARKET, BY REGION, 2019-2028 (Tons)

TABLE 29 Europe Others in bioactive ingredient MARKET, BY REGION, 2019-2028 (USD Thousand)

TABLE 30 Europe Others in bioactive ingredient MARKET, BY REGION, 2019-2028 (Tons)

TABLE 31 Europe bioactive ingredient market, By Applications, 2019-2028 (USD Thousand)

TABLE 32 Europe Functional Food in bioactive ingredient MARKET, BY REGION, 2019-2028 (USD Thousand)

TABLE 33 Europe Functional Food in Bioactive Ingredient Market, By Applications, 2019-2028 (USD Thousand)

TABLE 34 Europe Dairy in Bioactive Ingredient Market, By Applications, 2019-2028 (USD Thousand)

TABLE 35 Europe Dairy alternatives in Bioactive Ingredient Market, By Applications, 2019-2028 (USD Thousand)

TABLE 36 Europe Beverages in Bioactive Ingredient Market, By Applications, 2019-2028 (USD Thousand)

TABLE 37 Europe Bars in Bioactive Ingredient Market, By Applications, 2019-2028 (USD Thousand)

TABLE 38 Europe Animal Nutrition in bioactive ingredient MARKET, BY REGION, 2019-2028 (USD Thousand)

TABLE 39 Europe Animal Nutrition in Bioactive Ingredient Market, By Applications, 2019-2028 (USD Thousand)

TABLE 40 Europe Personal Care in bioactive ingredient MARKET, BY REGION, 2019-2028 (USD Thousand)

TABLE 41 Europe Personal care in Bioactive Ingredient Market, By Applications, 2019-2028 (USD Thousand)

TABLE 42 Europe Dietary Supplements in bioactive ingredient MARKET, BY REGION, 2019-2028 (USD Thousand)

TABLE 43 Europe Gummy Supplements in bioactive ingredient MARKET, BY REGION, 2019-2028 (USD Thousand)

TABLE 44 Europe Others in bioactive ingredient MARKET, BY REGION, 2019-2028 (USD Thousand)

TABLE 45 Europe bioactive ingredient market, By Source, 2019-2028 (USD Thousand)

TABLE 46 Europe Plant in bioactive ingredient MARKET, BY REGION, 2019-2028 (USD Thousand)

TABLE 47 Europe Animal in bioactive ingredient MARKET, BY REGION, 2019-2028 (USD Thousand)

TABLE 48 Europe Microbial in bioactive ingredient MARKET, BY REGION, 2019-2028 (USD Thousand)

TABLE 49 Europe bioactive ingredient Market, BY COUNtry, 2019-2028 (USD Thousand)

TABLE 50 Europe bioactive ingredient Market, BY COUNtry, 2019-2028 (tons)

TABLE 51 Europe Bioactive ingredient Market, By Ingredient Type, 2019-2028 (USD Thousand)

TABLE 52 Europe Bioactive ingredient Market, By Ingredient Type, 2019-2028 (Tons)

TABLE 53 Europe Peptides in Bioactive ingredient Market, By Ingredient Type, 2019-2028 (USD Thousand)

TABLE 54 Europe Prebiotic in Bioactive ingredient Market, By Ingredient Type, 2019-2028 (USD Thousand)

TABLE 55 Europe Probiotic in Bioactive ingredient Market, By Ingredient Type, 2019-2028 (USD Thousand)

TABLE 56 Europe Minerals in Bioactive ingredient Market, By Ingredient Type, 2019-2028 (USD Thousand)

TABLE 57 Europe Vitamins in Bioactive ingredient Market, By Ingredient Type, 2019-2028 (USD Thousand)

TABLE 58 Europe Amino Acid in Bioactive ingredient Market, By Ingredient Type, 2019-2028 (USD Thousand)

TABLE 59 Europe Bioactive ingredient Market, By Applications, 2019-2028 (USD Thousand)

TABLE 60 Europe Functional Food in Bioactive ingredient Market, By Applications, 2019-2028 (USD Thousand)

TABLE 61 Europe Dairy in Bioactive ingredient Market, By Applications, 2019-2028 (USD Thousand)

TABLE 62 Europe Dairy Alternatives in Bioactive ingredient Market, By Applications, 2019-2028 (USD Thousand)

TABLE 63 Europe Beverages in Bioactive ingredient Market, By Applications, 2019-2028 (USD Thousand)

TABLE 64 Europe Bars in Bioactive ingredient Market, By Applications, 2019-2028 (USD Thousand)

TABLE 65 Europe Animal Nutrition in Bioactive ingredient Market, By Applications, 2019-2028 (USD Thousand)

TABLE 66 Europe Personal Care in Bioactive ingredient Market, By Applications, 2019-2028 (USD Thousand)

TABLE 67 Europe Bioactive ingredient Market, By Source, 2019-2028 (USD Thousand)

TABLE 68 GERMANY Bioactive ingredient Market, By Ingredient Type, 2019-2028 (USD Thousand)

TABLE 69 GERMANY Bioactive ingredient Market, By Ingredient Type, 2019-2028 (Tons)

TABLE 70 GERMANY Peptides in Bioactive ingredient Market, By Ingredient Type, 2019-2028 (USD Thousand)

TABLE 71 GERMANY Prebiotic in Bioactive ingredient Market, By Ingredient Type, 2019-2028 (USD Thousand)

TABLE 72 GERMANY Probiotic in Bioactive ingredient Market, By Ingredient Type, 2019-2028 (USD Thousand)

TABLE 73 GERMANY Minerals in Bioactive ingredient Market, By Ingredient Type, 2019-2028 (USD Thousand)

TABLE 74 GERMANY Vitamins in Bioactive ingredient Market, By Ingredient Type, 2019-2028 (USD Thousand)

TABLE 75 GERMANY Amino Acid in Bioactive ingredient Market, By Ingredient Type, 2019-2028 (USD Thousand)

TABLE 76 GERMANY Bioactive ingredient Market, By Applications, 2019-2028 (USD Thousand)

TABLE 77 GERMANY Functional Food in Bioactive ingredient Market, By Applications, 2019-2028 (USD Thousand)

TABLE 78 GERMANY Dairy in Bioactive ingredient Market, By Applications, 2019-2028 (USD Thousand)

TABLE 79 GERMANY Dairy Alternatives in Bioactive ingredient Market, By Applications, 2019-2028 (USD Thousand)

TABLE 80 GERMANY Beverages in Bioactive ingredient Market, By Applications, 2019-2028 (USD Thousand)

TABLE 81 GERMANY Bars in Bioactive ingredient Market, By Applications, 2019-2028 (USD Thousand)

TABLE 82 GERMANY Animal Nutrition in Bioactive ingredient Market, By Applications, 2019-2028 (USD Thousand)

TABLE 83 GERMANY Personal Care in Bioactive ingredient Market, By Applications, 2019-2028 (USD Thousand)

TABLE 84 GERMANY Bioactive ingredient Market, By Source, 2019-2028 (USD Thousand)

TABLE 85 U.K. Bioactive ingredient Market, By Ingredient Type, 2019-2028 (USD Thousand)

TABLE 86 U.K. Bioactive ingredient Market, By Ingredient Type, 2019-2028 (Tons)

TABLE 87 U.K. Peptides in Bioactive ingredient Market, By Ingredient Type, 2019-2028 (USD Thousand)

TABLE 88 U.K. Prebiotic in Bioactive ingredient Market, By Ingredient Type, 2019-2028 (USD Thousand)

TABLE 89 U.K. Probiotic in Bioactive ingredient Market, By Ingredient Type, 2019-2028 (USD Thousand)

TABLE 90 U.K. Minerals in Bioactive ingredient Market, By Ingredient Type, 2019-2028 (USD Thousand)

TABLE 91 U.K. Vitamins in Bioactive ingredient Market, By Ingredient Type, 2019-2028 (USD Thousand)

TABLE 92 U.K. Amino Acid in Bioactive ingredient Market, By Ingredient Type, 2019-2028 (USD Thousand)

TABLE 93 U.K. Bioactive ingredient Market, By Applications, 2019-2028 (USD Thousand)

TABLE 94 U.K. Functional Food in Bioactive ingredient Market, By Applications, 2019-2028 (USD Thousand)

TABLE 95 U.K. Dairy in Bioactive ingredient Market, By Applications, 2019-2028 (USD Thousand)

TABLE 96 U.K. Dairy Alternatives in Bioactive ingredient Market, By Applications, 2019-2028 (USD Thousand)

TABLE 97 U.K. Beverages in Bioactive ingredient Market, By Applications, 2019-2028 (USD Thousand)

TABLE 98 U.K. Bars in Bioactive ingredient Market, By Applications, 2019-2028 (USD Thousand)

TABLE 99 U.K. Animal Nutrition in Bioactive ingredient Market, By Applications, 2019-2028 (USD Thousand)

TABLE 100 U.K. Personal Care in Bioactive ingredient Market, By Applications, 2019-2028 (USD Thousand)

TABLE 101 U.K. Bioactive ingredient Market, By Source, 2019-2028 (USD Thousand)

TABLE 102 FRANCE Bioactive ingredient Market, By Ingredient Type, 2019-2028 (USD Thousand)

TABLE 103 FRANCE Bioactive ingredient Market, By Ingredient Type, 2019-2028 (Tons)

TABLE 104 FRANCE Peptides in Bioactive ingredient Market, By Ingredient Type, 2019-2028 (USD Thousand)

TABLE 105 FRANCE Prebiotic in Bioactive ingredient Market, By Ingredient Type, 2019-2028 (USD Thousand)

TABLE 106 FRANCE Probiotic in Bioactive ingredient Market, By Ingredient Type, 2019-2028 (USD Thousand)

TABLE 107 FRANCE Minerals in Bioactive ingredient Market, By Ingredient Type, 2019-2028 (USD Thousand)

TABLE 108 FRANCE Vitamins in Bioactive ingredient Market, By Ingredient Type, 2019-2028 (USD Thousand)

TABLE 109 FRANCE Amino Acid in Bioactive ingredient Market, By Ingredient Type, 2019-2028 (USD Thousand)

TABLE 110 FRANCE Bioactive ingredient Market, By Applications, 2019-2028 (USD Thousand)

TABLE 111 FRANCE Functional Food in Bioactive ingredient Market, By Applications, 2019-2028 (USD Thousand)

TABLE 112 FRANCE Dairy in Bioactive ingredient Market, By Applications, 2019-2028 (USD Thousand)

TABLE 113 FRANCE Dairy Alternatives in Bioactive ingredient Market, By Applications, 2019-2028 (USD Thousand)

TABLE 114 FRANCE Beverages in Bioactive ingredient Market, By Applications, 2019-2028 (USD Thousand)

TABLE 115 FRANCE Bars in Bioactive ingredient Market, By Applications, 2019-2028 (USD Thousand)

TABLE 116 FRANCE Animal Nutrition in Bioactive ingredient Market, By Applications, 2019-2028 (USD Thousand)

TABLE 117 FRANCE Personal Care in Bioactive ingredient Market, By Applications, 2019-2028 (USD Thousand)

TABLE 118 FRANCE Bioactive ingredient Market, By Source, 2019-2028 (USD Thousand)

TABLE 119 ITALY Bioactive ingredient Market, By Ingredient Type, 2019-2028 (USD Thousand)

TABLE 120 ITALY Bioactive ingredient Market, By Ingredient Type, 2019-2028 (Tons)

TABLE 121 ITALY Peptides in Bioactive ingredient Market, By Ingredient Type, 2019-2028 (USD Thousand)

TABLE 122 ITALY Prebiotic in Bioactive ingredient Market, By Ingredient Type, 2019-2028 (USD Thousand)

TABLE 123 ITALY Probiotic in Bioactive ingredient Market, By Ingredient Type, 2019-2028 (USD Thousand)

TABLE 124 ITALY Minerals in Bioactive ingredient Market, By Ingredient Type, 2019-2028 (USD Thousand)

TABLE 125 ITALY Vitamins in Bioactive ingredient Market, By Ingredient Type, 2019-2028 (USD Thousand)

TABLE 126 ITALY Amino Acid in Bioactive ingredient Market, By Ingredient Type, 2019-2028 (USD Thousand)

TABLE 127 ITALY Bioactive ingredient Market, By Applications, 2019-2028 (USD Thousand)

TABLE 128 ITALY Functional Food in Bioactive ingredient Market, By Applications, 2019-2028 (USD Thousand)

TABLE 129 ITALY Dairy in Bioactive ingredient Market, By Applications, 2019-2028 (USD Thousand)

TABLE 130 ITALY Dairy Alternatives in Bioactive ingredient Market, By Applications, 2019-2028 (USD Thousand)

TABLE 131 ITALY Beverages in Bioactive ingredient Market, By Applications, 2019-2028 (USD Thousand)

TABLE 132 ITALY Bars in Bioactive ingredient Market, By Applications, 2019-2028 (USD Thousand)

TABLE 133 ITALY Animal Nutrition in Bioactive ingredient Market, By Applications, 2019-2028 (USD Thousand)

TABLE 134 ITALY Personal Care in Bioactive ingredient Market, By Applications, 2019-2028 (USD Thousand)

TABLE 135 ITALY Bioactive ingredient Market, By Source, 2019-2028 (USD Thousand)

TABLE 136 SPAIN Bioactive ingredient Market, By Ingredient Type, 2019-2028 (USD Thousand)

TABLE 137 SPAIN Bioactive ingredient Market, By Ingredient Type, 2019-2028 (Tons)

TABLE 138 SPAIN Peptides in Bioactive ingredient Market, By Ingredient Type, 2019-2028 (USD Thousand)

TABLE 139 SPAIN Prebiotic in Bioactive ingredient Market, By Ingredient Type, 2019-2028 (USD Thousand)

TABLE 140 SPAIN Probiotic in Bioactive ingredient Market, By Ingredient Type, 2019-2028 (USD Thousand)

TABLE 141 SPAIN Minerals in Bioactive ingredient Market, By Ingredient Type, 2019-2028 (USD Thousand)

TABLE 142 SPAIN Vitamins in Bioactive ingredient Market, By Ingredient Type, 2019-2028 (USD Thousand)

TABLE 143 SPAIN Amino Acid in Bioactive ingredient Market, By Ingredient Type, 2019-2028 (USD Thousand)

TABLE 144 SPAIN Bioactive ingredient Market, By Applications, 2019-2028 (USD Thousand)

TABLE 145 SPAIN Functional Food in Bioactive ingredient Market, By Applications, 2019-2028 (USD Thousand)

TABLE 146 SPAIN Dairy in Bioactive ingredient Market, By Applications, 2019-2028 (USD Thousand)

TABLE 147 SPAIN Dairy Alternatives in Bioactive ingredient Market, By Applications, 2019-2028 (USD Thousand)

TABLE 148 SPAIN Beverages in Bioactive ingredient Market, By Applications, 2019-2028 (USD Thousand)

TABLE 149 SPAIN Bars in Bioactive ingredient Market, By Applications, 2019-2028 (USD Thousand)

TABLE 150 SPAIN Animal Nutrition in Bioactive ingredient Market, By Applications, 2019-2028 (USD Thousand)

TABLE 151 SPAIN Personal Care in Bioactive ingredient Market, By Applications, 2019-2028 (USD Thousand)

TABLE 152 SPAIN Bioactive ingredient Market, By Source, 2019-2028 (USD Thousand)

TABLE 153 NETHERLANDS Bioactive ingredient Market, By Ingredient Type, 2019-2028 (USD Thousand)

TABLE 154 NETHERLANDS Bioactive ingredient Market, By Ingredient Type, 2019-2028 (Tons)

TABLE 155 NETHERLANDS Peptides in Bioactive ingredient Market, By Ingredient Type, 2019-2028 (USD Thousand)

TABLE 156 NETHERLANDS Prebiotic in Bioactive ingredient Market, By Ingredient Type, 2019-2028 (USD Thousand)

TABLE 157 NETHERLANDS Probiotic in Bioactive ingredient Market, By Ingredient Type, 2019-2028 (USD Thousand)

TABLE 158 NETHERLANDS Minerals in Bioactive ingredient Market, By Ingredient Type, 2019-2028 (USD Thousand)

TABLE 159 NETHERLANDS Vitamins in Bioactive ingredient Market, By Ingredient Type, 2019-2028 (USD Thousand)

TABLE 160 NETHERLANDS Amino Acid in Bioactive ingredient Market, By Ingredient Type, 2019-2028 (USD Thousand)

TABLE 161 NETHERLANDS Bioactive ingredient Market, By Applications, 2019-2028 (USD Thousand)

TABLE 162 NETHERLANDS Functional Food in Bioactive ingredient Market, By Applications, 2019-2028 (USD Thousand)

TABLE 163 NETHERLANDS Dairy in Bioactive ingredient Market, By Applications, 2019-2028 (USD Thousand)

TABLE 164 NETHERLANDS Dairy Alternatives in Bioactive ingredient Market, By Applications, 2019-2028 (USD Thousand)

TABLE 165 NETHERLANDS Beverages in Bioactive ingredient Market, By Applications, 2019-2028 (USD Thousand)

TABLE 166 NETHERLANDS Bars in Bioactive ingredient Market, By Applications, 2019-2028 (USD Thousand)

TABLE 167 NETHERLANDS Animal Nutrition in Bioactive ingredient Market, By Applications, 2019-2028 (USD Thousand)

TABLE 168 NETHERLANDS Personal Care in Bioactive ingredient Market, By Applications, 2019-2028 (USD Thousand)

TABLE 169 NETHERLANDS Bioactive ingredient Market, By Source, 2019-2028 (USD Thousand)

TABLE 170 BELGIUM Bioactive ingredient Market, By Ingredient Type, 2019-2028 (USD Thousand)

TABLE 171 BELGIUM Bioactive ingredient Market, By Ingredient Type, 2019-2028 (Tons)

TABLE 172 BELGIUM Peptides in Bioactive ingredient Market, By Ingredient Type, 2019-2028 (USD Thousand)

TABLE 173 BELGIUM Prebiotic in Bioactive ingredient Market, By Ingredient Type, 2019-2028 (USD Thousand)

TABLE 174 BELGIUM Probiotic in Bioactive ingredient Market, By Ingredient Type, 2019-2028 (USD Thousand)

TABLE 175 BELGIUM Minerals in Bioactive ingredient Market, By Ingredient Type, 2019-2028 (USD Thousand)

TABLE 176 BELGIUM Vitamins in Bioactive ingredient Market, By Ingredient Type, 2019-2028 (USD Thousand)

TABLE 177 BELGIUM Amino Acid in Bioactive ingredient Market, By Ingredient Type, 2019-2028 (USD Thousand)

TABLE 178 BELGIUM Bioactive ingredient Market, By Applications, 2019-2028 (USD Thousand)

TABLE 179 BELGIUM Functional Food in Bioactive ingredient Market, By Applications, 2019-2028 (USD Thousand)

TABLE 180 BELGIUM Dairy in Bioactive ingredient Market, By Applications, 2019-2028 (USD Thousand)

TABLE 181 BELGIUM Dairy Alternatives in Bioactive ingredient Market, By Applications, 2019-2028 (USD Thousand)

TABLE 182 BELGIUM Beverages in Bioactive ingredient Market, By Applications, 2019-2028 (USD Thousand)

TABLE 183 BELGIUM Bars in Bioactive ingredient Market, By Applications, 2019-2028 (USD Thousand)

TABLE 184 BELGIUM Animal Nutrition in Bioactive ingredient Market, By Applications, 2019-2028 (USD Thousand)

TABLE 185 BELGIUM Personal Care in Bioactive ingredient Market, By Applications, 2019-2028 (USD Thousand)

TABLE 186 BELGIUM Bioactive ingredient Market, By Source, 2019-2028 (USD Thousand)

TABLE 187 RUSSIA Bioactive ingredient Market, By Ingredient Type, 2019-2028 (USD Thousand)

TABLE 188 RUSSIA Bioactive ingredient Market, By Ingredient Type, 2019-2028 (Tons)

TABLE 189 RUSSIA Peptides in Bioactive ingredient Market, By Ingredient Type, 2019-2028 (USD Thousand)

TABLE 190 RUSSIA Prebiotic in Bioactive ingredient Market, By Ingredient Type, 2019-2028 (USD Thousand)

TABLE 191 RUSSIA Probiotic in Bioactive ingredient Market, By Ingredient Type, 2019-2028 (USD Thousand)

TABLE 192 RUSSIA Minerals in Bioactive ingredient Market, By Ingredient Type, 2019-2028 (USD Thousand)

TABLE 193 RUSSIA Vitamins in Bioactive ingredient Market, By Ingredient Type, 2019-2028 (USD Thousand)

TABLE 194 RUSSIA Amino Acid in Bioactive ingredient Market, By Ingredient Type, 2019-2028 (USD Thousand)

TABLE 195 RUSSIA Bioactive ingredient Market, By Applications, 2019-2028 (USD Thousand)

TABLE 196 RUSSIA Functional Food in Bioactive ingredient Market, By Applications, 2019-2028 (USD Thousand)

TABLE 197 RUSSIA Dairy in Bioactive ingredient Market, By Applications, 2019-2028 (USD Thousand)

TABLE 198 RUSSIA Dairy Alternatives in Bioactive ingredient Market, By Applications, 2019-2028 (USD Thousand)

TABLE 199 RUSSIA Beverages in Bioactive ingredient Market, By Applications, 2019-2028 (USD Thousand)

TABLE 200 RUSSIA Bars in Bioactive ingredient Market, By Applications, 2019-2028 (USD Thousand)

TABLE 201 RUSSIA Animal Nutrition in Bioactive ingredient Market, By Applications, 2019-2028 (USD Thousand)

TABLE 202 RUSSIA Personal Care in Bioactive ingredient Market, By Applications, 2019-2028 (USD Thousand)

TABLE 203 RUSSIA Bioactive ingredient Market, By Source, 2019-2028 (USD Thousand)

TABLE 204 TURKEY Bioactive ingredient Market, By Ingredient Type, 2019-2028 (USD Thousand)

TABLE 205 TURKEY Bioactive ingredient Market, By Ingredient Type, 2019-2028 (Tons)

TABLE 206 TURKEY Peptides in Bioactive ingredient Market, By Ingredient Type, 2019-2028 (USD Thousand)

TABLE 207 TURKEY Prebiotic in Bioactive ingredient Market, By Ingredient Type, 2019-2028 (USD Thousand)

TABLE 208 TURKEY Probiotic in Bioactive ingredient Market, By Ingredient Type, 2019-2028 (USD Thousand)

TABLE 209 TURKEY Minerals in Bioactive ingredient Market, By Ingredient Type, 2019-2028 (USD Thousand)

TABLE 210 TURKEY Vitamins in Bioactive ingredient Market, By Ingredient Type, 2019-2028 (USD Thousand)

TABLE 211 TURKEY Amino Acid in Bioactive ingredient Market, By Ingredient Type, 2019-2028 (USD Thousand)

TABLE 212 TURKEY Bioactive ingredient Market, By Applications, 2019-2028 (USD Thousand)

TABLE 213 TURKEY Functional Food in Bioactive ingredient Market, By Applications, 2019-2028 (USD Thousand)

TABLE 214 TURKEY Dairy in Bioactive ingredient Market, By Applications, 2019-2028 (USD Thousand)

TABLE 215 TURKEY Dairy Alternatives in Bioactive ingredient Market, By Applications, 2019-2028 (USD Thousand)

TABLE 216 TURKEY Beverages in Bioactive ingredient Market, By Applications, 2019-2028 (USD Thousand)

TABLE 217 TURKEY Bars in Bioactive ingredient Market, By Applications, 2019-2028 (USD Thousand)

TABLE 218 TURKEY Animal Nutrition in Bioactive ingredient Market, By Applications, 2019-2028 (USD Thousand)

TABLE 219 TURKEY Personal Care in Bioactive ingredient Market, By Applications, 2019-2028 (USD Thousand)

TABLE 220 TURKEY Bioactive ingredient Market, By Source, 2019-2028 (USD Thousand)

TABLE 221 SWITZERLAND Bioactive ingredient Market, By Ingredient Type, 2019-2028 (USD Thousand)

TABLE 222 SWITZERLAND Bioactive ingredient Market, By Ingredient Type, 2019-2028 (Tons)

TABLE 223 SWITZERLAND Peptides in Bioactive ingredient Market, By Ingredient Type, 2019-2028 (USD Thousand)

TABLE 224 SWITZERLAND Prebiotic in Bioactive ingredient Market, By Ingredient Type, 2019-2028 (USD Thousand)

TABLE 225 SWITZERLAND Probiotic in Bioactive ingredient Market, By Ingredient Type, 2019-2028 (USD Thousand)

TABLE 226 SWITZERLAND Minerals in Bioactive ingredient Market, By Ingredient Type, 2019-2028 (USD Thousand)

TABLE 227 SWITZERLAND Vitamins in Bioactive ingredient Market, By Ingredient Type, 2019-2028 (USD Thousand)

TABLE 228 SWITZERLAND Amino Acid in Bioactive ingredient Market, By Ingredient Type, 2019-2028 (USD Thousand)

TABLE 229 SWITZERLAND Bioactive ingredient Market, By Applications, 2019-2028 (USD Thousand)

TABLE 230 SWITZERLAND Functional Food in Bioactive ingredient Market, By Applications, 2019-2028 (USD Thousand)

TABLE 231 SWITZERLAND Dairy in Bioactive ingredient Market, By Applications, 2019-2028 (USD Thousand)

TABLE 232 SWITZERLAND Dairy Alternatives in Bioactive ingredient Market, By Applications, 2019-2028 (USD Thousand)

TABLE 233 SWITZERLAND Beverages in Bioactive ingredient Market, By Applications, 2019-2028 (USD Thousand)

TABLE 234 SWITZERLAND Bars in Bioactive ingredient Market, By Applications, 2019-2028 (USD Thousand)

TABLE 235 SWITZERLAND Animal Nutrition in Bioactive ingredient Market, By Applications, 2019-2028 (USD Thousand)

TABLE 236 SWITZERLAND Personal Care in Bioactive ingredient Market, By Applications, 2019-2028 (USD Thousand)

TABLE 237 SWITZERLAND Bioactive ingredient Market, By Source, 2019-2028 (USD Thousand)

TABLE 238 DENMARK Bioactive ingredient Market, By Ingredient Type, 2019-2028 (USD Thousand)

TABLE 239 DENMARK Bioactive ingredient Market, By Ingredient Type, 2019-2028 (Tons)

TABLE 240 DENMARK Peptides in Bioactive ingredient Market, By Ingredient Type, 2019-2028 (USD Thousand)

TABLE 241 DENMARK Prebiotic in Bioactive ingredient Market, By Ingredient Type, 2019-2028 (USD Thousand)

TABLE 242 DENMARK Probiotic in Bioactive ingredient Market, By Ingredient Type, 2019-2028 (USD Thousand)

TABLE 243 DENMARK Minerals in Bioactive ingredient Market, By Ingredient Type, 2019-2028 (USD Thousand)

TABLE 244 DENMARK Vitamins in Bioactive ingredient Market, By Ingredient Type, 2019-2028 (USD Thousand)

TABLE 245 DENMARK Amino Acid in Bioactive ingredient Market, By Ingredient Type, 2019-2028 (USD Thousand)

TABLE 246 DENMARK Bioactive ingredient Market, By Applications, 2019-2028 (USD Thousand)

TABLE 247 DENMARK Functional Food in Bioactive ingredient Market, By Applications, 2019-2028 (USD Thousand)

TABLE 248 DENMARK Dairy in Bioactive ingredient Market, By Applications, 2019-2028 (USD Thousand)

TABLE 249 DENMARK Dairy Alternatives in Bioactive ingredient Market, By Applications, 2019-2028 (USD Thousand)

TABLE 250 DENMARK Beverages in Bioactive ingredient Market, By Applications, 2019-2028 (USD Thousand)

TABLE 251 DENMARK Bars in Bioactive ingredient Market, By Applications, 2019-2028 (USD Thousand)

TABLE 252 DENMARK Animal Nutrition in Bioactive ingredient Market, By Applications, 2019-2028 (USD Thousand)

TABLE 253 DENMARK Personal Care in Bioactive ingredient Market, By Applications, 2019-2028 (USD Thousand)

TABLE 254 DENMARK Bioactive ingredient Market, By Source, 2019-2028 (USD Thousand)

TABLE 255 SWEDEN Bioactive ingredient Market, By Ingredient Type, 2019-2028 (USD Thousand)

TABLE 256 SWEDEN Bioactive ingredient Market, By Ingredient Type, 2019-2028 (Tons)

TABLE 257 SWEDEN Peptides in Bioactive ingredient Market, By Ingredient Type, 2019-2028 (USD Thousand)

TABLE 258 SWEDEN Prebiotic in Bioactive ingredient Market, By Ingredient Type, 2019-2028 (USD Thousand)

TABLE 259 SWEDEN Probiotic in Bioactive ingredient Market, By Ingredient Type, 2019-2028 (USD Thousand)

TABLE 260 SWEDEN Minerals in Bioactive ingredient Market, By Ingredient Type, 2019-2028 (USD Thousand)

TABLE 261 SWEDEN Vitamins in Bioactive ingredient Market, By Ingredient Type, 2019-2028 (USD Thousand)

TABLE 262 SWEDEN Amino Acid in Bioactive ingredient Market, By Ingredient Type, 2019-2028 (USD Thousand)

TABLE 263 SWEDEN Bioactive ingredient Market, By Applications, 2019-2028 (USD Thousand)

TABLE 264 SWEDEN Functional Food in Bioactive ingredient Market, By Applications, 2019-2028 (USD Thousand)

TABLE 265 SWEDEN Dairy in Bioactive ingredient Market, By Applications, 2019-2028 (USD Thousand)

TABLE 266 SWEDEN Dairy Alternatives in Bioactive ingredient Market, By Applications, 2019-2028 (USD Thousand)

TABLE 267 SWEDEN Beverages in Bioactive ingredient Market, By Applications, 2019-2028 (USD Thousand)

TABLE 268 SWEDEN Bars in Bioactive ingredient Market, By Applications, 2019-2028 (USD Thousand)

TABLE 269 SWEDEN Animal Nutrition in Bioactive ingredient Market, By Applications, 2019-2028 (USD Thousand)

TABLE 270 SWEDEN Personal Care in Bioactive ingredient Market, By Applications, 2019-2028 (USD Thousand)

TABLE 271 SWEDEN Bioactive ingredient Market, By Source, 2019-2028 (USD Thousand)

TABLE 272 POLAND Bioactive ingredient Market, By Ingredient Type, 2019-2028 (USD Thousand)

TABLE 273 POLAND Bioactive ingredient Market, By Ingredient Type, 2019-2028 (Tons)

TABLE 274 POLAND Peptides in Bioactive ingredient Market, By Ingredient Type, 2019-2028 (USD Thousand)

TABLE 275 POLAND Prebiotic in Bioactive ingredient Market, By Ingredient Type, 2019-2028 (USD Thousand)

TABLE 276 POLAND Probiotic in Bioactive ingredient Market, By Ingredient Type, 2019-2028 (USD Thousand)

TABLE 277 POLAND Minerals in Bioactive ingredient Market, By Ingredient Type, 2019-2028 (USD Thousand)

TABLE 278 POLAND Vitamins in Bioactive ingredient Market, By Ingredient Type, 2019-2028 (USD Thousand)

TABLE 279 POLAND Amino Acid in Bioactive ingredient Market, By Ingredient Type, 2019-2028 (USD Thousand)

TABLE 280 POLAND Bioactive ingredient Market, By Applications, 2019-2028 (USD Thousand)

TABLE 281 POLAND Functional Food in Bioactive ingredient Market, By Applications, 2019-2028 (USD Thousand)

TABLE 282 POLAND Dairy in Bioactive ingredient Market, By Applications, 2019-2028 (USD Thousand)

TABLE 283 POLAND Dairy Alternatives in Bioactive ingredient Market, By Applications, 2019-2028 (USD Thousand)

TABLE 284 POLAND Beverages in Bioactive ingredient Market, By Applications, 2019-2028 (USD Thousand)

TABLE 285 POLAND Bars in Bioactive ingredient Market, By Applications, 2019-2028 (USD Thousand)

TABLE 286 POLAND Animal Nutrition in Bioactive ingredient Market, By Applications, 2019-2028 (USD Thousand)

TABLE 287 POLAND Personal Care in Bioactive ingredient Market, By Applications, 2019-2028 (USD Thousand)

TABLE 288 POLAND Bioactive ingredient Market, By Source, 2019-2028 (USD Thousand)

TABLE 289 REST OF EUROPE Bioactive ingredient Market, By Ingredient Type, 2019-2028 (USD Thousand)

TABLE 290 REST OF EUROPE Bioactive ingredient Market, By Ingredient Type, 2019-2028 (Tons)

Lista de Figura

FIGURE 1 EUROPE BIOACTIVE INGREDIENT MARKET: segmentation

FIGURE 2 EUROPE BIOACTIVE INGREDIENT MARKET: data triangulation

FIGURE 3 EUROPE BIOACTIVE INGREDIENT MARKET: DROC ANALYSIS

FIGURE 4 EUROPE BIOACTIVE INGREDIENT MARKET: Europe VS. regional MARKET analysis

FIGURE 5 EUROPE BIOACTIVE INGREDIENT MARKET: company research analysis

FIGURE 6 EUROPE BIOACTIVE INGREDIENT MARKET: THE Ingredient Type LIFE LINE CURVE

FIGURE 7 EUROPE BIOACTIVE INGREDIENT MARKET: MULTIVARIATE MODELLING

FIGURE 8 EUROPE BIOACTIVE INGREDIENT MARKET: INTERVIEW DEMOGRAPHICS

FIGURE 9 EUROPE BIOACTIVE INGREDIENT MARKET: DBMR MARKET POSITION GRID

FIGURE 10 EUROPE BIOACTIVE INGREDIENT MARKET: MARKET application COVERAGE GRID

FIGURE 11 EUROPE BIOACTIVE INGREDIENT MARKET: THE MARKET CHALLENGE MATRIX

FIGURE 12 EUROPE BIOACTIVE INGREDIENT MARKET: vendor share analysis

FIGURE 13 EUROPE BIOACTIVE INGREDIENT MARKET: SEGMENTATION

FIGURE 14 Rising demand of bioactive ingredients in functional foodIS DRIVING the EUROPE BIOACTIVE INGREDIENT MARKET in the forecast period of 2021 to 2028

FIGURE 15 peptide SEGMENT is expected to account for the largest share of the EUROPE BIOACTIVE INGREDIENT MARKET in 2021 & 2028

FIGURE 16 Figure 1 DRIVERS, RESTRAINTS, OPPORTUNITIES AND CHALLENGEs OF Europe Bioactive Ingredient MARKET

FIGURE 17 : DRUG USED FOR DIABETES (DOSAGE PER 1,000 INHABITANTS, PER DAY)

FIGURE 1 Europe bioactive ingredient MARKET: BY Ingredient Type, 2020

FIGURE 2 Europe bioactive ingredient MARKET: BY Applications, 2020

FIGURE 3 Europe bioactive ingredient MARKET: BY source, 2020

FIGURE 4 EUROPE bioactive ingredient market: SNAPSHOT (2020)

FIGURE 5 EUROPE BIOACTIVE INGREDIENT market: by COUNTRY (2020)

FIGURE 6 EUROPE BIOACTIVE INGREDIENT market: by COUNTRY (2021 & 2028)

FIGURE 7 EUROPE BIOACTIVE INGREDIENT market: by COUNTRY (2020 & 2028)

FIGURE 8 EUROPE BIOACTIVE INGREDIENT market: by Ingredient Type (2021-2028)

FIGURE 9 EUROPE BIOACTIVE INGREDIENT MARKET: company share 2020 (%)

View Detailed Information Right Arrow

Metodologia de Investigação

A recolha de dados e a análise do ano base são feitas através de módulos de recolha de dados com amostras grandes. A etapa inclui a obtenção de informações de mercado ou dados relacionados através de diversas fontes e estratégias. Inclui examinar e planear antecipadamente todos os dados adquiridos no passado. Da mesma forma, envolve o exame de inconsistências de informação observadas em diferentes fontes de informação. Os dados de mercado são analisados ​​e estimados utilizando modelos estatísticos e coerentes de mercado. Além disso, a análise da quota de mercado e a análise das principais tendências são os principais fatores de sucesso no relatório de mercado. Para saber mais, solicite uma chamada de analista ou abra a sua consulta.

A principal metodologia de investigação utilizada pela equipa de investigação do DBMR é a triangulação de dados que envolve a mineração de dados, a análise do impacto das variáveis ​​de dados no mercado e a validação primária (especialista do setor). Os modelos de dados incluem grelha de posicionamento de fornecedores, análise da linha de tempo do mercado, visão geral e guia de mercado, grelha de posicionamento da empresa, análise de patentes, análise de preços, análise da quota de mercado da empresa, normas de medição, análise global versus regional e de participação dos fornecedores. Para saber mais sobre a metodologia de investigação, faça uma consulta para falar com os nossos especialistas do setor.

Personalização disponível

A Data Bridge Market Research é líder em investigação formativa avançada. Orgulhamo-nos de servir os nossos clientes novos e existentes com dados e análises que correspondem e atendem aos seus objetivos. O relatório pode ser personalizado para incluir análise de tendências de preços de marcas-alvo, compreensão do mercado para países adicionais (solicite a lista de países), dados de resultados de ensaios clínicos, revisão de literatura, mercado remodelado e análise de base de produtos . A análise de mercado dos concorrentes-alvo pode ser analisada desde análises baseadas em tecnologia até estratégias de carteira de mercado. Podemos adicionar quantos concorrentes necessitar de dados no formato e estilo de dados que procura. A nossa equipa de analistas também pode fornecer dados em tabelas dinâmicas de ficheiros Excel em bruto (livro de factos) ou pode ajudá-lo a criar apresentações a partir dos conjuntos de dados disponíveis no relatório.

Perguntas frequentes

Europe Bioactive Ingredient Market to grow at a CAGR of 7.1% by forecast 2028.
Europe Bioactive Ingredient Market value to reach USD 12,713,978.02 thousand by 2028.
The major market players engaged in the global bioactive ingredient market are DSM, BASF SE , Kerry, DuPont, ADM, Global Bio-chem Technology Group Company Limited, Evonik Industries AG, Cargill, Incorporated, Arla Food Ingredients Group P/S (a subsidiary of Arla Foods amba), FMC Corporation, Sunrise Nutrachem Group, Adisseo (a subsidiary of Bluestar Adisseo Co., Ltd.), Chr.Hansen Holding A/S, Sabinsa, Ajinomoto Co., Inc, NOVUS INTERNATIONAL (a subsidiary of Mitsui & Co. (U.S.A.), Inc.), Ingredion, Roquette Frères, Probi and Advanced Animal Nutrition Pty Ltd.
The countries covered in the Europe Bioactive Ingredient market report are Germany, U.K., France, Italy, Spain, Netherlands, Belgium, Russia, Turkey, Switzerland, Poland, Denmark, and the Rest of Europe.