
Global Bioreactors Market
Market Size in USD Million
CAGR :
% 
 USD
1,327.75 Million
USD
2,439.43 Million
2022
2030
USD
1,327.75 Million
USD
2,439.43 Million
2022
2030
| 2023 –2030 | |
| USD 1,327.75 Million | |
| USD 2,439.43 Million | |
| % | |
|
Bioreactors Market Analysis and Size
The United States and Canada are two of the region's largest countries, invest heavily in research and development. According to the National Center for Health Statistics (NCHS) at the Centers for Disease Control and Prevention (CDC), the United States spent approximately USD 7,767 million on biotechnology research in 2020. They also predicted that by 2022, this figure would rise to USD 7,912 million. The high amount spent is expected to boost market growth because it translates to increased demand for new drugs and pharmaceutical ingredients produced by bioreactors.
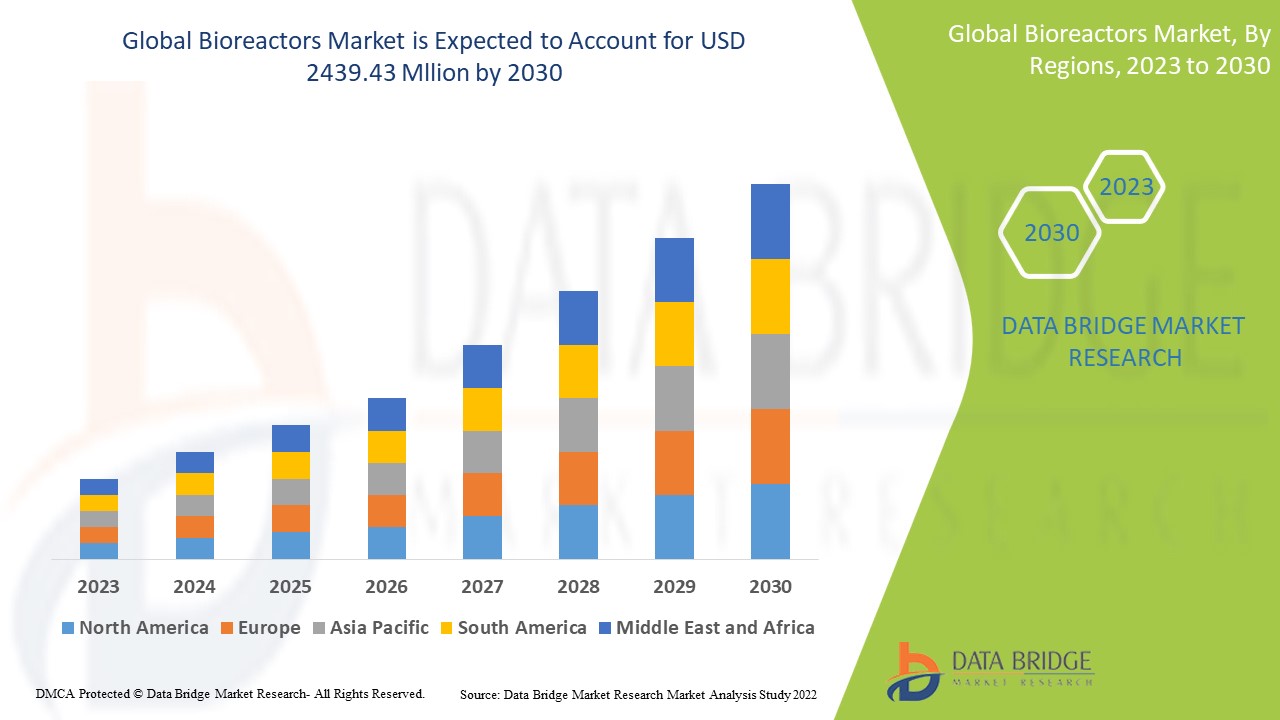
Data Bridge Market Research analyses that the bioreactors market which was USD 1327.75 million in 2022, is expected to reach USD 2439.43 million by 2030, at a CAGR of 7.9% during the forecast period 2023 to 2030. In addition to the insights on market scenarios such as market value, growth rate, segmentation, geographical coverage, and major players, the market reports curated by the Data Bridge Market Research also include depth expert analysis, patient epidemiology, pipeline analysis, pricing analysis, and regulatory framework.
Bioreactors Market Scope and Segmentation
|
Report Metric |
Details |
|
Forecast Period |
2023 to 2030 |
|
Base Year |
2022 |
|
Historic Years |
2021 (Customizable to 2015 - 2020) |
|
Quantitative Units |
Revenue in USD Million, Volumes in Units, Pricing in USD |
|
Segments Covered |
Product Type (Single-use, Reusable), Cell (Mammalian Cells, Bacterial Cells, Yeast Cells), Molecule (Monoclonal Antibodies, Vaccines, Recombinant Proteins, Stem Cells, Gene Therapy), Usage (Lab-Scale Production, Developmental, Pre-clinical and Clinical, Commercial Production, Pilot-Scale Production and Full-Scale Production), Scale (5L-20L, 20L-200L, 200L-1500L and Above 1500L), Material (Glass, Stainless Steel and Single Use), Control Type (Manual and Automated), Suppliers (OEM, System Integrators, EPCs), End User (Research and Development Departments, Research and Development Institutes, CROs, Biopharmaceutical Companies, Biopharmaceutical Manufacturer and CMOs) |
|
Countries Covered |
U.S., Canada and Mexico in North America, Germany, France, U.K., Netherlands, Switzerland, Belgium, Russia, Italy, Spain, Turkey, Rest of Europe in Europe, China, Japan, India, South Korea, Singapore, Malaysia, Australia, Thailand, Indonesia, Philippines, Rest of Asia-Pacific (APAC) in the Asia-Pacific (APAC), Saudi Arabia, U.A.E, South Africa, Egypt, Israel, Rest of Middle East and Africa (MEA) as a part of Middle East and Africa (MEA), Brazil, Argentina and Rest of South America as part of South America |
|
Market Players Covered |
Sartorius AG (Germany), Thermo Fisher Scientific Inc. (U.S.), General Electric (U.S.), Eppendorf AG (Germany), Merck KGaA (Germany), Pall Corporation (U.S.), ZETA (India), PIERRE GUERIN (France), PRaj Hipurity Systems Limited (India), Bioengineering AG (Switzerland), Infors AG (Switzerland), Solaris Biotechnology Srl. (Italy), Bbi Biotech (Germany), Shanghai Bailun Biotechnology co., Ltd. (China), PBS Biotech Inc. (U.S.), CerCell A/S (Denmark), GEA Group Aktiengesellschaft (Germany) |
|
Market Opportunities |
|
Market Definition
A bioreactor is a device that provides a controlled environment for organisms such as animal cells, mammalian cells, yeast cells, and bacteria to grow. They are used in the production of pharmaceuticals such as monoclonal antibodies and vaccines. A controlled environment is required for the manufacture of biological, biochemical, and biomechanically engineered products. A bioreactor is a vessel, tub, or tank that acts as a biological catalyst to aid in the chemical transformation of biological raw materials. Bioreactors have long been used to produce high-value products and therapeutic biomolecules. These instruments regulate and track environmental conditions throughout the culture's ongoing reaction.
Bioreactors Market Dynamics
Drivers
- Broad applications in manufacturing of novel molecules
The growing adoption of advanced technologies to simplify complex manufacturing will drive the market demand. The segmental statistics are expected to be driven by the widespread use of bioreactors in developing and manufacturing complex molecules such as nucleic acids and proteins. These are the certain factors which propel the market growth.
- Initiatives by major corporations
Initiatives by major corporations are also boosting market growth. For instance, Eppendorf's SciVario system for small- and bench-scale applications was introduced in February 2020. The new system is intended for academic and industrial use. Furthermore, in August 2019, the UK-based REPROCELL Europe Ltd announced exclusive distribution rights to the ABLE Biott Bioreactor System. They are a single-use reactor series for stem cell culture. The ABLE Biott Bioreactor System is a lab-scaled bioreactor system that allows stem cell researchers to study and culture pluripotent stem cells in a novel way. These are the initiatives which propel the growth of market.
Opportunities
- Rising R&D activities
Furthermore, growing R&D activities for preventive vaccine development around the world have increased demand for clinical-stage bioreactors. For instance, ABEC has supplied CSR bioreactors to Serum Institute of India Pvt. Ltd. (SIIPL) to manufacture COVID-19 vaccine. As a result of increased adoption of bioreactors in several manufacturing facilities, the market will continue to grow significantly during the forecast period.
Restraints/Challenges
- Lack of availability
The bioreactors market is hampered by a lack of availability and access to various alternative bioreactor methods, as well as a stringent regulatory environment for the system and materials used.
This bioreactors market report provides details of new recent developments, trade regulations, import-export analysis, production analysis, value chain optimization, market share, impact of domestic and localized market players, analyses opportunities in terms of emerging revenue pockets, changes in market regulations, strategic market growth analysis, market size, category market growths, application niches and dominance, product approvals, product launches, geographic expansions, technological innovations in the market. To gain more info on the bioreactors market contact Data Bridge Market Research for an Analyst Brief, our team will help you take an informed market decision to achieve market growth.
Recent Developments
- In 2022, Merck announced the acquisition of Lonza's MAST platform, an automated aseptic bioreactor sampling system. These platforms assist customers in optimising data during bioprocessing. This acquisition will assist the company in expanding its market presence.
- In 2020, Danaher Corporation acquired General Electric Life Sciences' CYTIVA biopharma business. This strategy has assisted the company in broadening its product offering for biopharma customers and improving market penetration.
Global Bioreactors Market Scope
The bioreactors market is segmented on the basis of product type, cell, molecule, usage, scale, material, control type, suppliers and end user. The growth amongst these segments will help you analyze meagre growth segments in the industries and provide the users with a valuable market overview and market insights to help them make strategic decisions for identifying core market applications.
Product Type
- Single-use
- Reusable
Cell
- Mammalian Cells
- Bacterial Cells
- Yeast Cells
Molecule
- Monoclonal Antibodies
- Vaccines
- Recombinant Proteins
- Stem Cells
- Gene Therapy
Usage
- Lab-Scale Production
- Developmental
- Pre-clinical and Clinical
- Commercial Production
- Pilot-Scale Production
- Full-Scale Production
Scale
- 5L-20L
- 20L-200L
- 200L-1500L
- Above 1500L
Material
- Glass
- Stainless Steel
- Single Use
Control Type
- Manual
- Automated
Suppliers
- OEM
- System Integrators
- EPCs
End User
- Research and Development Departments
- Research and Development Institutes
- CROs
- Biopharmaceutical Companies
- Biopharmaceutical Manufacturer and CMOs
Bioreactors Market Regional Analysis/Insights
The bioreactors market is analyzed and market size insights and trends are provided by country, product type, cell, molecule, usage, scale, material, control type, suppliers and end user as referenced above.
The countries covered in the bioreactors market report are U.S., Canada and Mexico in North America, Germany, France, U.K., Netherlands, Switzerland, Belgium, Russia, Italy, Spain, Turkey, Rest of Europe in Europe, China, Japan, India, South Korea, Singapore, Malaysia, Australia, Thailand, Indonesia, Philippines, Rest of Asia-Pacific (APAC) in the Asia-Pacific (APAC), Saudi Arabia, U.A.E, South Africa, Egypt, Israel, Rest of Middle East and Africa (MEA) as a part of Middle East and Africa (MEA), Brazil, Argentina and Rest of South America as part of South America.
North America dominates the bioreactors market because of advances in life science research and development Furthermore, an increase in investment and the number of biomanufacturing facilities will fuel the region's bioreactors market growth during the forecast period.
Asia-Pacific is expected to grow at the highest growth rate in the forecast period of 2023 to 2030 because of the rise in chronic diseases Furthermore, the growing demand for novel biologic drugs, as well as the growing number of pharmaceutical companies.
The country section of the report also provides individual market impacting factors and changes in regulation in the market domestically that impacts the current and future trends of the market. Data points like down-stream and upstream value chain analysis, technical trends and porter's five forces analysis, case studies are some of the pointers used to forecast the market scenario for individual countries. Also, the presence and availability of global brands and their challenges faced due to large or scarce competition from local and domestic brands, impact of domestic tariffs and trade routes are considered while providing forecast analysis of the country data.
Healthcare Infrastructure Growth Installed base and New Technology Penetration
The bioreactors market also provides you with detailed market analysis for every country growth in healthcare expenditure for capital equipment, installed base of different kind of products for bioreactors market, impact of technology using life line curves and changes in healthcare regulatory scenarios and their impact on the bioreactors market. The data is available for historic period 2011-2021.
Competitive Landscape and Bioreactors Market Share Analysis
The bioreactors market competitive landscape provides details by competitor. Details included are company overview, company financials, revenue generated, market potential, investment in research and development, new market initiatives, global presence, production sites and facilities, production capacities, company strengths and weaknesses, product launch, product width and breadth, application dominance. The above data points provided are only related to the companies' focus related to bioreactors market.
Some of the major players operating in the bioreactors market are:
- Sartorius AG (Germany)
- Thermo Fisher Scientific Inc. (U.S.)
- General Electric (U.S.)
- Eppendorf AG (Germany)
- Merck KGaA (Germany)
- Pall Corporation (U.S.)
- ZETA (India)
- PIERRE GUERIN (France)
- PRaj Hipurity Systems Limited (India)
- Bioengineering AG (Switzerland)
- Infors AG (Switzerland)
- Solaris Biotechnology Srl. (Italy)
- Bbi Biotech (Germany)
- Shanghai Bailun Biotechnology co., Ltd. (China)
- PBS Biotech Inc. (U.S.)
- CerCell A/S (Denmark)
- GEA Group Aktiengesellschaft (Germany)
SKU-
Get online access to the report on the World's First Market Intelligence Cloud

- Interactive Data Analysis Dashboard
- Company Analysis Dashboard for high growth potential opportunities
- Research Analyst Access for customization & queries
- Competitor Analysis with Interactive dashboard
- Latest News, Updates & Trend analysis
- Harness the Power of Benchmark Analysis for Comprehensive Competitor Tracking
Table of Content
1 INTRODUCTION
1.1 OBJECTIVES OF THE STUDY
1.2 MARKET DEFINITION
1.3 OVERVIEW OF GLOBAL BIOREACTORS MARKET
1.4 CURRENCY AND PRICING
1.5 LIMITATION
1.6 MARKETS COVERED
2 MARKET SEGMENTATION
2.1 KEY TAKEAWAYS
2.2 ARRIVING AT THE GLOBAL BIOREACTORS SIZE
2.2.1 VENDOR POSITIONING GRID
2.2.2 TECHNOLOGY LIFE LINE CURVE
2.2.3 TRIPOD DATA VALIDATION MODEL
2.2.4 MARKET GUIDE
2.2.5 MULTIVARIATE MODELLING
2.2.6 TOP TO BOTTOM ANALYSIS
2.2.7 CHALLENGE MATRIX
2.2.8 APPLICATION COVERAGE GRID
2.2.9 STANDARDS OF MEASUREMENT
2.2.10 VENDOR SHARE ANALYSIS
2.2.11 DATA POINTS FROM KEY PRIMARY INTERVIEWS
2.2.12 DATA POINTS FROM KEY SECONDARY DATABASES
2.3 GLOBAL BIOREACTORS MARKET: RESEARCH SNAPSHOT
2.4 ASSUMPTIONS
3 MARKET OVERVIEW
3.1 DRIVERS
3.2 RESTRAINTS
3.3 OPPORTUNITIES
3.4 CHALLENGES
4 EXECUTIVE SUMMARY
5 PREMIUM INSIGHTS
5.1 PESTEL ANALYSIS
5.2 PORTER’S FIVE FORCES MODEL
6 INDUSTRY INSIGHTS
6.1 MICRO AND MACRO ECONOMIC FACTORS
6.2 PENETRATION AND GROWTH PROSPECT MAPPING
6.3 KEY PRICING STRATEGIES
6.4 INTERVIEWS WITH SPECIALIST
6.5 ANALYIS AND RECOMMENDATION
7 INTELLECTUAL PROPERTY (IP) PORTFOLIO
7.1 PATENT QUALITY AND STRENGTH
7.2 PATENT FAMILIES
7.3 LICENSING AND COLLABORATIONS
7.4 COMPETITIVE LANDSCAPE
7.5 IP STRATEGY AND MANAGEMENT
7.6 OTHER
8 COST ANALYSIS BREAKDOWN
9 TECHNONLOGY ROADMAP
10 INNOVATION TRACKER AND STRATEGIC ANALYSIS
10.1 MAJOR DEALS AND STRATEGIC ALLIANCES ANALYSIS
10.1.1 JOINT VENTURES
10.1.2 MERGERS AND ACQUISITIONS
10.1.3 LICENSING AND PARTNERSHIP
10.1.4 TECHNOLOGY COLLABORATIONS
10.1.5 STRATEGIC DIVESTMENTS
10.2 NUMBER OF PRODUCTS IN DEVELOPMENT
10.3 STAGE OF DEVELOPMENT
10.4 TIMELINES AND MILESTONES
10.5 INNOVATION STRATEGIES AND METHODOLOGIES
10.6 RISK ASSESSMENT AND MITIGATION
10.7 FUTURE OUTLOOK
11 REGULATORY COMPLIANCE
11.1 REGULATORY AUTHORITIES
11.2 REGULATORY CLASSIFICATIONS
11.2.1 CLASS I
11.2.2 CLASS II
11.2.3 CLASS III
11.3 REGULATORY SUBMISSIONS
11.4 INTERNATIONAL HARMONIZATION
11.5 COMPLIANCE AND QUALITY MANAGEMENT SYSTEMS
11.6 REGULATORY CHALLENGES AND STRATEGIES
12 REIMBURSEMENT FRAMEWORK
13 OPPUTUNITY MAP ANALYSIS
14 VALUE CHAIN ANALYSIS
15 HEALTHCARE ECONOMY
15.1 HEALTHCARE EXPENDITURE
15.2 CAPITAL EXPENDITURE
15.3 CAPEX TRENDS
15.4 CAPEX ALLOCATION
15.5 FUNDING SOURCES
15.6 INDUSTRY BENCHMARKS
15.7 GDP RATION IN OVERALL GDP
15.8 HEALTHCARE SYSTEM STRUCTURE
15.9 GOVERNMENT POLICIES
15.1 ECONOMIC DEVELOPMENT
16 GLOBAL BIOREACTORS MARKET, BY PRODUCT
16.1 OVERVIEW
16.2 SINGLE USE BIOREACTORS
16.2.1 STIRRED TANK SINGLE-USE BIOREACTORS
16.2.2 BUBBLE COLUMN SINGLE-USE BIOREACTORS
16.2.2.1. TRICKLE BED REACTOR
16.2.2.2. FLUIDIZED BED REACTOR
16.2.3 WAVE INDUCED SINGLE-USE BIOREACTORS
16.3 RESUABLE BIOREACTORS
16.3.1 BY TYPE
16.3.1.1. STIRRED TANKED FERMENTOR
16.3.1.1.1. BY MODE
16.3.1.1.1.1 AUTOMATED
16.3.1.1.1.2 MANUAL
16.3.1.2. ROCKER BIOREACTOR
16.3.1.2.1. BY MODE
16.3.1.2.1.1 AUTOMATED
16.3.1.2.1.2 MANUAL
16.3.1.3. AIRLIEFT FERMENTOR
16.3.1.3.1. INTERNAL LOOP
16.3.1.3.2. EXTERNAL LOOP
16.3.1.4. PACKED BED FERMENTOR
16.3.1.5. OTHERS
17 GLOBAL BIOREACTORS MARKET, BY MODE
17.1 OVERVIEW
17.2 AUTOMATED
17.2.1 SINGLE USE BIOREACTORS
17.2.2 REUSABLE BIOREACTORS
17.3 MANUAL
17.3.1 SINGLE USE BIOREACTORS
17.3.2 REUSABLE BIOREACTORS
17.4
18 GLOBAL BIOREACTORS MARKET, BY CELL TYPE
18.1 OVERVIEW
18.2 MAMMALIAN CELLS
18.3 YEAST CELLS
18.4 BACTERIAL CELLS
19 GLOBAL BIOREACTORS MARKET, BY CAPACITY
19.1 OVERVIEW
19.2 20-200 L
19.3 200-1500 L
19.4 ABOVE 1500 L
19.5 OTHERS
20 GLOBAL BIOREACTORS MARKET, BY MATERIAL TYPE
20.1 OVERVIEW
20.2 STAINLESS STEEL
20.3 GLASS
20.4 OTHERS
21 GLOBAL BIOREACTORS MARKET, BY USAGE
21.1 OVERVIEW
21.2 LAB-SCALE PRODUCTION
21.2.1 PRE-CLINICAL AND CLINICAL
21.2.2 COMMERCIAL PRODUCTION
21.3 PILOT-SCALE PRODUCTION
21.4 FULL-SCALE PRODUCTION
22 GLOBAL BIOREACTORS MARKET, BY PROCESS
22.1 OVERVIEW
22.2 DOWNSTREAM
22.3 UPSTREAM
23 GLOBAL BIOREACTORS MARKET, BY MOLECULE
23.1 OVERVIEW
23.2 MONOCLONAL ANTIBODIES
23.2.1 SINGLE USE BIOREACTORS
23.2.2 REUSABLE BIOREACTORS
23.3 VACCINES
23.3.1 SINGLE USE BIOREACTORS
23.3.2 REUSABLE BIOREACTORS
23.4 RECOMBINANT PROTEINS
23.4.1 SINGLE USE BIOREACTORS
23.4.2 REUSABLE BIOREACTORS
23.5 STEM CELLS AND GENE THERAPY
23.5.1 SINGLE USE BIOREACTORS
23.5.2 REUSABLE BIOREACTORS
23.6 OTHERS
24 GLOBAL BIOREACTORS MARKET, BY END USER
24.1 OVERVIEW
24.2 PHARMACEUTICAL AND BIOPHARMACEUTICAL COMPANIES
24.2.1 SMALL
24.2.2 MEDIUM
24.2.3 LARGE
24.3 CONTRACT RESEARCH ORGANIZATIONS
24.3.1 SMALL
24.3.2 MEDIUM
24.3.3 LARGE
24.4 CONTRACT MANUFUCTURING ORGANIZATIONS
24.4.1 SMALL
24.4.2 MEDIUM
24.4.3 LARGE
24.5 RESEARC AND ACADEMIC INSTITUTES
24.6 OTHERS
25 GLOBAL BIOREACTORS MARKET, BY DISTRIBUTION CHANNEL
25.1 OVERVIEW
25.2 DIRECT TENDER
25.3 RETAIL SALES
25.4 ONLINE SALES
25.5 OTHERS
26 GLOBAL BIOREACTORS MARKET, SWOT AND DBMR ANALYSIS
27 GLOBAL BIOREACTORS MARKET, COMPANY LANDSCAPE
27.1 COMPANY SHARE ANALYSIS: GLOBAL
27.2 COMPANY SHARE ANALYSIS: NORTH AMERICA
27.3 COMPANY SHARE ANALYSIS: EUROPE
27.4 COMPANY SHARE ANALYSIS: ASIA-PACIFIC
27.5 MERGERS & ACQUISITIONS
27.6 NEW PRODUCT DEVELOPMENT & APPROVALS
27.7 EXPANSIONS
27.8 REGULATORY CHANGES
27.9 PARTNERSHIP AND OTHER STRATEGIC DEVELOPMENTS
28 GLOBAL BIOREACTORS MARKET, BY REGION
28.1 GLOBAL BIOREACTORS MARKET, (ALL SEGMENTATION PROVIDED ABOVE IS REPRESENTED IN THIS CHAPTER BY COUNTRY)
28.2 NORTH AMERICA
28.2.1 U.S.
28.2.2 CANADA
28.2.3 MEXICO
28.3 EUROPE
28.3.1 GERMANY
28.3.2 U.K.
28.3.3 ITALY
28.3.4 FRANCE
28.3.5 SPAIN
28.3.6 RUSSIA
28.3.7 SWITZERLAND
28.3.8 TURKEY
28.3.9 BELGIUM
28.3.10 NETHERLANDS
28.3.11 DENMARK
28.3.12 SWEDEN
28.3.13 POLAND
28.3.14 NORWAY
28.3.15 FINLAND
28.3.16 REST OF EUROPE
28.4 ASIA-PACIFIC
28.4.1 JAPAN
28.4.2 CHINA
28.4.3 SOUTH KOREA
28.4.4 INDIA
28.4.5 SINGAPORE
28.4.6 THAILAND
28.4.7 INDONESIA
28.4.8 MALAYSIA
28.4.9 PHILIPPINES
28.4.10 AUSTRALIA
28.4.11 NEW ZEALAND
28.4.12 VIETNAM
28.4.13 TAIWAN
28.4.14 REST OF ASIA-PACIFIC
28.5 SOUTH AMERICA
28.5.1 BRAZIL
28.5.2 ARGENTINA
28.5.3 REST OF SOUTH AMERICA
28.6 MIDDLE EAST AND AFRICA
28.6.1 SOUTH AFRICA
28.6.2 EGYPT
28.6.3 BAHRAIN
28.6.4 UNITED ARAB EMIRATES
28.6.5 KUWAIT
28.6.6 OMAN
28.6.7 QATAR
28.6.8 SAUDI ARABIA
28.6.9 REST OF MEA
28.7 KEY PRIMARY INSIGHTS: BY MAJOR COUNTRIES
29 GLOBAL BIOREACTORS MARKET, COMPANY PROFILE
29.1 THERMOFISHER SCIENTIFIC, INC.
29.1.1 COMPANY OVERVIEW
29.1.2 REVENUE ANALYSIS
29.1.3 GEOGRAPHIC PRESENCE
29.1.4 PRODUCT PORTFOLIO
29.1.5 RECENT DEVELOPMENTS
29.2 SARTORIUS AG
29.2.1 COMPANY OVERVIEW
29.2.2 REVENUE ANALYSIS
29.2.3 GEOGRAPHIC PRESENCE
29.2.4 PRODUCT PORTFOLIO
29.2.5 RECENT DEVELOPMENTS
29.3 EPPENDORF SE
29.3.1 COMPANY OVERVIEW
29.3.2 REVENUE ANALYSIS
29.3.3 GEOGRAPHIC PRESENCE
29.3.4 PRODUCT PORTFOLIO
29.3.5 RECENT DEVELOPMENTS
29.4 MERCK KGAA
29.4.1 COMPANY OVERVIEW
29.4.2 REVENUE ANALYSIS
29.4.3 GEOGRAPHIC PRESENCE
29.4.4 PRODUCT PORTFOLIO
29.4.5 RECENT DEVELOPMENTS
29.5 DANAHER
29.5.1 COMPANY OVERVIEW
29.5.2 REVENUE ANALYSIS
29.5.3 GEOGRAPHIC PRESENCE
29.5.4 PRODUCT PORTFOLIO
29.5.5 RECENT DEVELOPMENTS
29.6 PIERRE GUERIN
29.6.1 COMPANY OVERVIEW
29.6.2 REVENUE ANALYSIS
29.6.3 GEOGRAPHIC PRESENCE
29.6.4 PRODUCT PORTFOLIO
29.6.5 RECENT DEVELOPMENTS
29.7 PRAJ-HIPURITY SYSTEMS LIMITED
29.7.1 COMPANY OVERVIEW
29.7.2 REVENUE ANALYSIS
29.7.3 GEOGRAPHIC PRESENCE
29.7.4 PRODUCT PORTFOLIO
29.7.5 RECENT DEVELOPMENTS
29.8 BIOENGINEERING AG
29.8.1 COMPANY OVERVIEW
29.8.2 REVENUE ANALYSIS
29.8.3 GEOGRAPHIC PRESENCE
29.8.4 PRODUCT PORTFOLIO
29.8.5 RECENT DEVELOPMENTS
29.9 SOLARIS SALES & PRODUCTION
29.9.1 COMPANY OVERVIEW
29.9.2 REVENUE ANALYSIS
29.9.3 GEOGRAPHIC PRESENCE
29.9.4 PRODUCT PORTFOLIO
29.9.5 RECENT DEVELOPMENTS
29.1 INFORS AG
29.10.1 COMPANY OVERVIEW
29.10.2 REVENUE ANALYSIS
29.10.3 GEOGRAPHIC PRESENCE
29.10.4 PRODUCT PORTFOLIO
29.10.5 RECENT DEVELOPMENTS
29.11 PBS BIOTECH
29.11.1 COMPANY OVERVIEW
29.11.2 REVENUE ANALYSIS
29.11.3 GEOGRAPHIC PRESENCE
29.11.4 PRODUCT PORTFOLIO
29.11.5 RECENT DEVELOPMENTS
29.12 GETTINGE AB
29.12.1 COMPANY OVERVIEW
29.12.2 REVENUE ANALYSIS
29.12.3 GEOGRAPHIC PRESENCE
29.12.4 PRODUCT PORTFOLIO
29.12.5 RECENT DEVELOPMENTS
29.13 CELLEXUS
29.13.1 COMPANY OVERVIEW
29.13.2 REVENUE ANALYSIS
29.13.3 GEOGRAPHIC PRESENCE
29.13.4 PRODUCT PORTFOLIO
29.13.5 RECENT DEVELOPMENTS
29.14 CERCELL A/S
29.14.1 COMPANY OVERVIEW
29.14.2 REVENUE ANALYSIS
29.14.3 GEOGRAPHIC PRESENCE
29.14.4 PRODUCT PORTFOLIO
29.14.5 RECENT DEVELOPMENTS
29.15 CESCO BIOENGINEERING CO., LTD.
29.15.1 COMPANY OVERVIEW
29.15.2 REVENUE ANALYSIS
29.15.3 GEOGRAPHIC PRESENCE
29.15.4 PRODUCT PORTFOLIO
29.15.5 RECENT DEVELOPMENTS
29.16 SOLIDA BIOTECH GMBH
29.16.1 COMPANY OVERVIEW
29.16.2 REVENUE ANALYSIS
29.16.3 GEOGRAPHIC PRESENCE
29.16.4 PRODUCT PORTFOLIO
29.16.5 RECENT DEVELOPMENTS
29.17 IKA
29.17.1 COMPANY OVERVIEW
29.17.2 REVENUE ANALYSIS
29.17.3 GEOGRAPHIC PRESENCE
29.17.4 PRODUCT PORTFOLIO
29.17.5 RECENT DEVELOPMENTS
29.18 MORIMATSU LIFESCIENCES CO., LTD.
29.18.1 COMPANY OVERVIEW
29.18.2 REVENUE ANALYSIS
29.18.3 GEOGRAPHIC PRESENCE
29.18.4 PRODUCT PORTFOLIO
29.18.5 RECENT DEVELOPMENTS
29.19 BIONET
29.19.1 COMPANY OVERVIEW
29.19.2 REVENUE ANALYSIS
29.19.3 GEOGRAPHIC PRESENCE
29.19.4 PRODUCT PORTFOLIO
29.19.5 RECENT DEVELOPMENTS
29.2 WUXI BIOLOGICS
29.20.1 COMPANY OVERVIEW
29.20.2 REVENUE ANALYSIS
29.20.3 GEOGRAPHIC PRESENCE
29.20.4 PRODUCT PORTFOLIO
29.20.5 RECENT DEVELOPMENTS
29.21 ESCO MICRO PTE LTD.
29.21.1 COMPANY OVERVIEW
29.21.2 REVENUE ANALYSIS
29.21.3 GEOGRAPHIC PRESENCE
29.21.4 PRODUCT PORTFOLIO
29.21.5 RECENT DEVELOPMENTS
29.22 DCI INC
29.22.1 COMPANY OVERVIEW
29.22.2 REVENUE ANALYSIS
29.22.3 GEOGRAPHIC PRESENCE
29.22.4 PRODUCT PORTFOLIO
29.22.5 RECENT DEVELOPMENTS
30 RELATED REPORTS
31 CONCLUSION
32 QUESTIONNAIRE
33 ABOUT DATA BRIDGE MARKET RESEARCH
Research Methodology
Data collection and base year analysis are done using data collection modules with large sample sizes. The stage includes obtaining market information or related data through various sources and strategies. It includes examining and planning all the data acquired from the past in advance. It likewise envelops the examination of information inconsistencies seen across different information sources. The market data is analysed and estimated using market statistical and coherent models. Also, market share analysis and key trend analysis are the major success factors in the market report. To know more, please request an analyst call or drop down your inquiry.
The key research methodology used by DBMR research team is data triangulation which involves data mining, analysis of the impact of data variables on the market and primary (industry expert) validation. Data models include Vendor Positioning Grid, Market Time Line Analysis, Market Overview and Guide, Company Positioning Grid, Patent Analysis, Pricing Analysis, Company Market Share Analysis, Standards of Measurement, Global versus Regional and Vendor Share Analysis. To know more about the research methodology, drop in an inquiry to speak to our industry experts.
Customization Available
Data Bridge Market Research is a leader in advanced formative research. We take pride in servicing our existing and new customers with data and analysis that match and suits their goal. The report can be customized to include price trend analysis of target brands understanding the market for additional countries (ask for the list of countries), clinical trial results data, literature review, refurbished market and product base analysis. Market analysis of target competitors can be analyzed from technology-based analysis to market portfolio strategies. We can add as many competitors that you require data about in the format and data style you are looking for. Our team of analysts can also provide you data in crude raw excel files pivot tables (Fact book) or can assist you in creating presentations from the data sets available in the report.

