Global Refinery Process Additives Market Companies

Request for TOC Request for TOC Speak to Analyst Speak to Analyst Buy Now Buy Now Inquire Before Buying Inquire Before Free Sample Report Free Sample Report

Global Refinery Process Additives Market Companies

  • Chemical and Materials
  • Upcoming Report
  • Mar 2022
  • Global
  • 350 Pages
  • No of Tables: 220
  • No of Figures: 60

Companies Covered

Highest Market Share

Dominant Companies

    Other Companies

    Market Share Analysis

    Star 
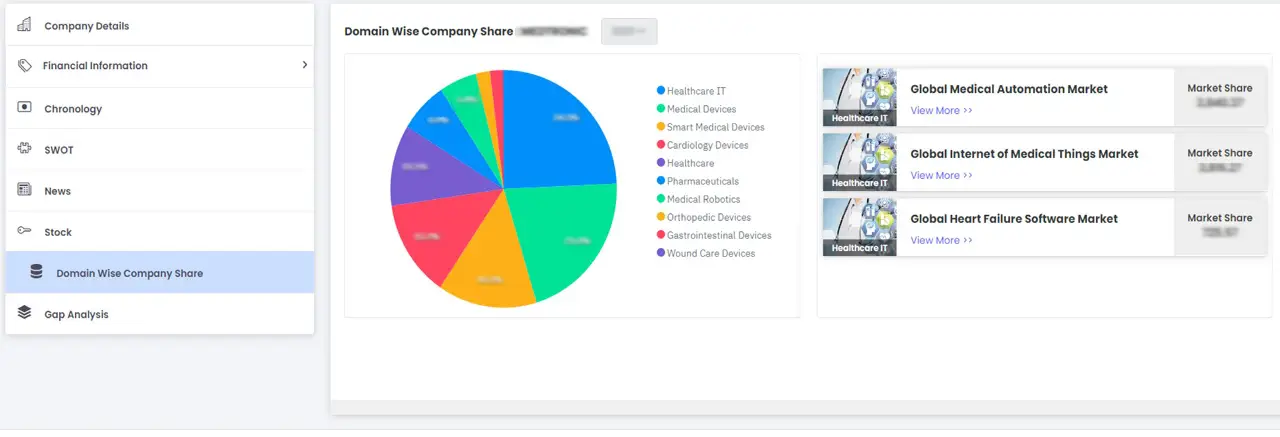
The data presented is for visualization purposes only and may not reflect actual results.
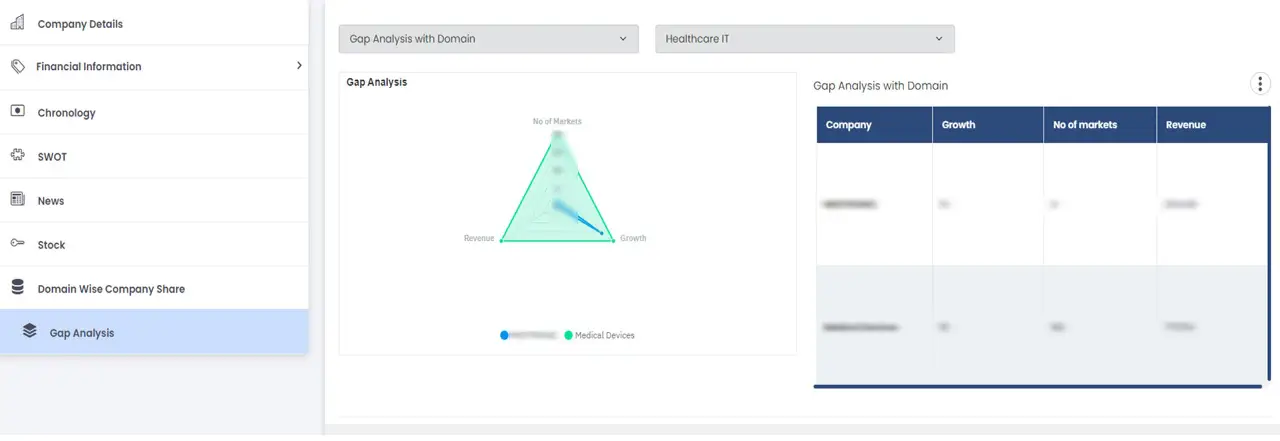
    Company Overview

    Overview

    The company overview furnishes clients with basic information about the company’s background and core operations. In this section, we generally include details about the company's founding, mission, key milestones, and overarching business activities. In addition, this section aims to give clients insights into the competitor's industry focus, illustrating where they direct their efforts and investments within the market landscape.

    Product Portfolio

    Understanding the competitor's product portfolio helps identify their strengths and weaknesses in various product categories. Our product portfolio section offers a detailed overview of the range of products and services that the companies offer. This includes information on the types of products, product information, and product segment. By analyzing the competitor’s product portfolio, clients can gain insights into their strategic focus areas, innovation capabilities, and market positioning.

    Market Share Geographical Coverage

    Analyzing sales geographical coverage also includes understanding the competitor's market penetration, customer base diversity, and regional sales tactics. To measure the economic occurrences of a competitor through sales, it is essential to analyze their sales distribution across different regions. This involves examining the sales volume, revenue contribution, and growth rates in various geographical markets. This section tells about the regions where the competitor is most successful, which can indicate strong market demand or effective sales strategies.

    Recent Developments

    The competitor's approach to market opportunities and challenges is reflected in their diverse strategic actions. Under this section, you can get an understanding of the competitor's behavior and attitude towards market opportunities and challenges. We got you covered with the latest updates on product launches, expansions, mergers and acquisitions, collaborations, partnerships, agreements, joint ventures, and awards and certifications for various companies.

    Nucleus : Company Analysis Platform

    Frequently Asked Questions

    The market is segmented based on , By Type (Product Quality Improvement Additives, Environmental Protection Additives, Extend Operating Cycle and Reduce Energy Consumption Additives, Raw Oil Quality and Catalytic Activity Improvement Additives, Product Distribution Improvement Additives), Functionality (Demulsifiers, Desalter, Corrosion inhibitors, Defoamer and Others), Application (Gasoline, Aviation fuel, Residual fuel and Others), Process (Distillation, Cracker, Desulfurization Catalytic Reforming and Others), Crude Type (Low Viscosity Crude Oil, Medium Viscosity Crude Oil, Heavy Viscosity Crude Oil)– Industry Trends and Forecast to 2029. .
    The Global Refinery Process Additives Market size was valued at USD 2100.00 USD Million in 2021.
    The Global Refinery Process Additives Market is projected to grow at a CAGR of 7% during the forecast period of 2022 to 2029.
    The major players operating in the market include Chevron Corporation, Total, Westlake Chemical Corporation, Mitsubishi Chemical Corporation, SABIC, LG Chem, BASF SE, 3M, Dow, DuPont, LSB INDUSTRIES, Sika AG, Innospec, ADEKA CORPORATION, Dorf Ketal Chemicals Pvt. , PMC Specialties Group, Afton Chemical, The Lubrizol Corporation, Clariant, LANXESS, Mayzo , Solvay, Akzo Nobel N.V., Arkema, Eastman Chemical Company.
    The market report covers data from the U.S., Canada and Mexico in North America, Germany, France, U.K., Netherlands, Switzerland, Belgium, Russia, Italy, Spain, Turkey, Rest of Europe in Europe, China, Japan, India, South Korea, Singapore, Malaysia, Australia, Thailand, Indonesia, Philippines, Rest of Asia-Pacific (APAC) in the Asia-Pacific (APAC), Saudi Arabia, U.A.E, South Africa, Egypt, Israel, Rest of Middle East and Africa (MEA) as a part of Middle East and Africa (MEA), Brazil, Argentina and Rest of South America as part of South America..