

Us Software Market
Marktgröße in Milliarden USD
CAGR :
% 
 USD
472.21 Billion
USD
1,377.68 Billion
2024
2032
USD
472.21 Billion
USD
1,377.68 Billion
2024
2032
| 2025 –2032 | |
| USD 472.21 Billion | |
| USD 1,377.68 Billion | |
| % | |
U.S. Software Market Segmentation, By Type (Finance, Video, Antivirus, Music, Resume, and Ad Spam) - Industry Trends and Forecast to 2031.
U.S. Software Market Analysis
Software refers to a set of instructions, data, or programs used to operate computers and execute specific tasks. In various industries and sectors, software is tailored to meet the distinct needs of users, streamlining processes and enhancing productivity. For instance, finance software helps individuals and businesses manage their financial transactions, budgeting, and investments, while video software enables the creation, editing, and playback of multimedia content. Antivirus software is designed to detect, prevent, and remove malicious software and protect systems from cybersecurity threats. Each category of software serves a particular function, offering specialized tools to simplify complex tasks.
U.S. Software Market size
Data Bridge Market Research analyses that the U.S. software market is expected to reach USD 1205.10 billion by 2031 from USD 472.21 billion in 2024, growing at a CAGR of 14.7% in the forecast period of 2025 to 2031. In addition to the insights on market scenarios such as market value, growth rate, segmentation, geographical coverage, and major players, the market reports curated by the Data Bridge Market Research also include in-depth expert analysis, geographically represented company-wise production and capacity, network layouts of distributors and partners, detailed and updated price trend analysis and deficit analysis of supply chain and demand.
U.S. Software Market Trends
The U.S. software market has seen significant growth driven by digital transformation across various sectors. Cloud computing continues to be a dominant trend, with businesses increasingly adopting Software as a Service (SaaS) solutions for their scalability and cost-effectiveness. Companies are focusing on enhancing collaboration and productivity through cloud-based tools, particularly in remote and hybrid work environments. Additionally, the rise of artificial intelligence and machine learning is reshaping software development, enabling more intelligent applications that enhance decision-making and automate routine tasks.
Another notable trend is the increasing emphasis on cybersecurity as organizations recognize the importance of protecting sensitive data and systems. The growing number of cyber threats has led to heightened investments in security software and services. Furthermore, regulatory compliance and data privacy concerns are prompting companies to prioritize secure software solutions. Overall, the U.S. software market is evolving rapidly, with innovation in technology and a focus on customer-centric solutions driving its expansion.
|
Attributes |
Agriculture Rollers Key Market Insights |
|
Segments Covered |
|
|
Abgedeckte Länder |
UNS |
|
Wichtige Marktteilnehmer |
Infor (USA), Workday, Inc. (USA), Microsoft (USA), Zoho Corporation Pvt. Ltd. (Indien), Avid Technology, Inc. (USA), Presonus Audio Electronics, Inc. (USA), Apple Inc. (USA), Adobe Inc. (USA), Cakewalk (BandLab Technologies) (Singapur), Cockos Incorporated (USA), MOTU, Inc. (USA), Verint Systems Inc. (USA), AxonSoft (USA), Panopto (USA), Arcues, Inc. (USA), Honeywell International Inc. (USA), Eagle Eye Networks (USA), Kaltura Inc. (USA), Employ Inc. (USA), ClearCo (Kanada), ApplicantPro Holdings, LLC (USA), ICIMS (USA), Ghostery GmbH (Deutschland), EyeDefender (Adblock Plus) (Deutschland), Bitdefender (Rumänien), Sophos (Gen Digital Inc) (Großbritannien), Norton Ltd. (USA), McAfee, LLC (USA), Trend Micro Incorporated (Japan), Fortinet, Inc. (USA), ESET spol. s ro (Slowakei) |
|
Marktchancen |
|
|
Wertschöpfende Dateninfosets |
Zusätzlich zu den Einblicken in Marktszenarien wie Marktwert, Wachstumsrate, Segmentierung, geografische Abdeckung und wichtige Akteure enthalten die von Data Bridge Market Research zusammengestellten Marktberichte auch ausführliche Expertenanalysen, Patientenepidemiologie, Pipeline-Analysen, Preisanalysen und regulatorische Rahmenbedingungen. |
Marktdefinition
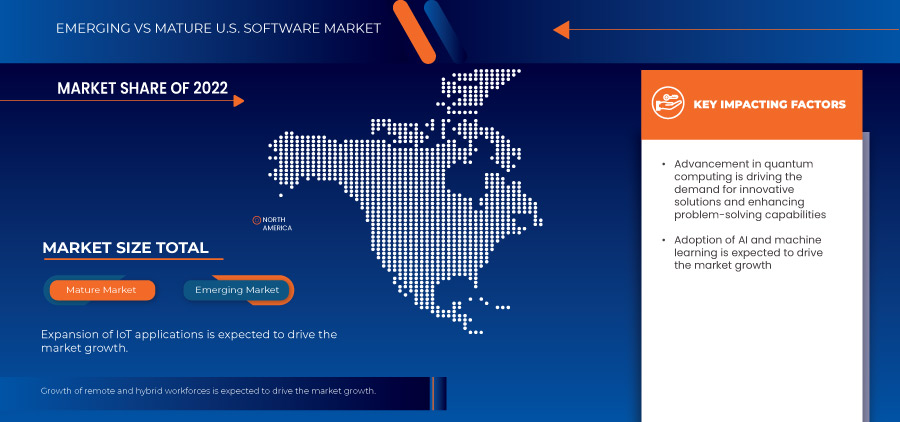
Der US-Softwaremarkt ist einer der größten und dynamischsten der Welt. Er wird angetrieben durch die fortschrittliche Technologieinfrastruktur des Landes, Innovationen und erhebliche Investitionen in Forschung und Entwicklung. Der Markt umfasst eine breite Palette von Sektoren, darunter Unternehmenssoftware, Cloud Computing, künstliche Intelligenz, Cybersicherheit und Verbraucheranwendungen. US-Softwareunternehmen wie Microsoft, Oracle und Salesforce sind Marktführer und profitieren von der starken Nachfrage nach digitaler Transformation in Branchen wie dem Gesundheitswesen, dem Finanzwesen und dem Bildungswesen. Die zunehmende Einführung von Cloud-basierten Diensten und Software-as-a-Service-Modellen (SaaS) hat das Marktwachstum ebenfalls angekurbelt und ermöglicht es Unternehmen, schnell zu skalieren und Unternehmen jeder Größe flexible Lösungen anzubieten.
Dynamik des US-Softwaremarktes
In diesem Abschnitt geht es um das Verständnis der Markttreiber, Vorteile, Chancen, Einschränkungen und Herausforderungen. All dies wird im Folgenden ausführlich erläutert:
Treiber
- Erweiterung von IOT-Anwendungen
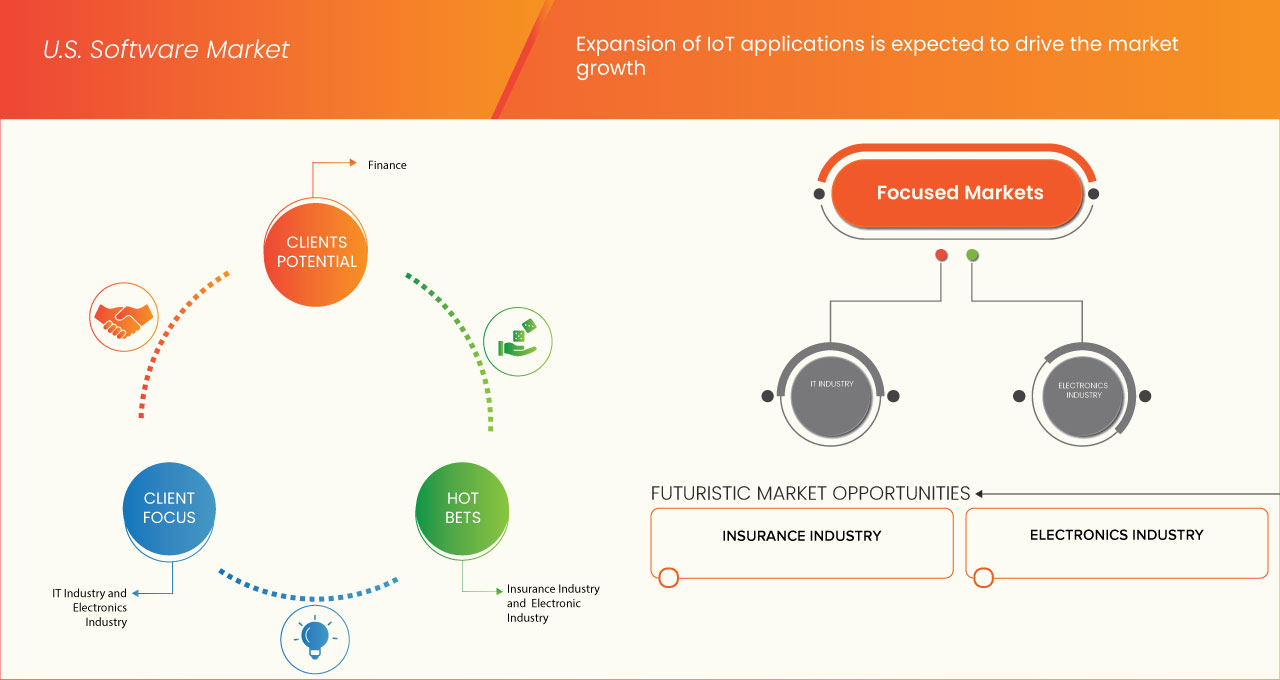
Der Ausbau des Internets der Dinge (IoT) ist aufgrund seiner weitreichenden Auswirkungen auf verschiedene Sektoren ein wichtiger Treiber für den US-Softwaremarkt. IoT verbindet eine Vielzahl von Geräten und Systemen, von Haushaltsgeräten und Industriemaschinen bis hin zu medizinischer Ausrüstung und Smart-City-Infrastruktur. Diese Konnektivität schafft eine Nachfrage nach robusten Softwarelösungen zur Verwaltung, Analyse und Sicherung der riesigen Datenmengen, die von diesen vernetzten Geräten generiert werden. Unternehmen investieren zunehmend in Softwareplattformen, die Echtzeit-Datenerfassung, prädiktive Analysen und die nahtlose Integration von IoT-Geräten ermöglichen, was zu einem Anstieg der Softwareentwicklung führt.
Zum Beispiel:-
- Die Integration von KI und IoT verbesserte die Effizienz und Automatisierung in verschiedenen Branchen erheblich. Unternehmen nutzten KI für vorausschauende Wartung und intelligentes Energiemanagement und steigerten so die betriebliche Produktivität. Trotz Herausforderungen wie Datenmanagement und Sicherheit zeigte die Zusammenarbeit von KI und IoT erhebliche Vorteile und Innovationen
Erhöhte Abhängigkeit von Cloud- und SAAS-Modellen
Die Abhängigkeit von Cloud-basierten Diensten und SaaS-Modellen (Software as a Service) ist ein Treiber für den US-Softwaremarkt, da sie die Bereitstellung und Nutzung von Software grundlegend verändern. Cloud-basierte Lösungen bieten skalierbare und kostengünstige Optionen für Unternehmen, da sie eine umfangreiche Infrastruktur vor Ort überflüssig machen und Unternehmen den Zugriff auf anspruchsvolle Softwareanwendungen über das Internet ermöglichen. Diese Verlagerung in die Cloud hat zu einer verstärkten Nutzung von SaaS geführt, bei dem Unternehmen für Software auf Abonnementbasis zahlen, anstatt Lizenzen direkt zu erwerben, was zu einer flexibleren und vorhersehbareren Kostenstruktur führt.
Zum Beispiel:-
- Im August 2024 wechselte Tyler Technologies zu Cloud-basierten Diensten und SaaS-Modellen und verlagerte sich von traditioneller On-Premise-Software auf wiederkehrende Einnahmequellen. Dieser Schritt verbesserte die Betriebseffizienz und das Vertrauen der Anleger, was möglicherweise den Aktienwert steigerte. Analysten prognostizierten ein erhebliches Umsatz- und Gewinnwachstum, wobei zukünftige Bewertungen ein niedrigeres KGV als derzeit erforderlich machten
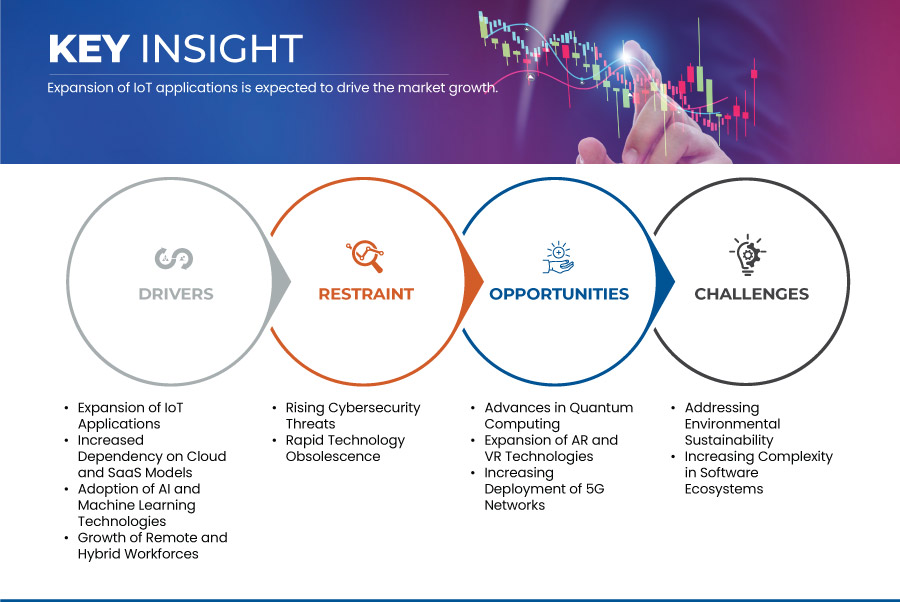
Gelegenheiten
- Fortschritte im Quantencomputing
Fortschritte in der Quantencomputertechnologie stellen eine große Chance für den US-Softwaremarkt dar, da sie versprechen, die Art und Weise, wie komplexe Probleme gelöst werden, zu revolutionieren und die Rechenleistung über aktuelle Grenzen hinaus zu steigern. Quantencomputer haben das Potenzial, komplizierte Probleme in Bereichen wie Kryptographie, Optimierung und Datenanalyse mit Geschwindigkeiten zu lösen, die klassische Computer bei weitem übertreffen. Dieser Durchbruch schafft eine Nachfrage nach neuen Softwareanwendungen und -plattformen, die die Leistungsfähigkeit des Quantencomputers nutzen und neue Wege für Innovation und Entwicklung in der Softwarebranche eröffnen.
Darüber hinaus ermutigt der Aufstieg der Quantencomputertechnologie Softwareunternehmen, neue Algorithmen und Ansätze zu erforschen, die speziell auf Quantenprozessoren zugeschnitten sind. Wenn Unternehmen in die Entwicklung von Quantenalgorithmen und deren Integration in klassische Systeme investieren, besteht die Möglichkeit, Softwarelösungen zu entwickeln, die bisher unlösbare Probleme angehen und Fortschritte in verschiedenen Sektoren vorantreiben, darunter Finanzen, Pharmazie und künstliche Intelligenz. Dieses aufstrebende Feld bietet erhebliche Wachstumsaussichten für Softwareentwickler und Technologieunternehmen an der Spitze der Quanteninnovation .
Zum Beispiel:-
- Im Mai 2024 stellte der 2018 ins Leben gerufene US-amerikanische National Quantum Initiative Act laut der Observer Research Foundation (ORF) über einen Zeitraum von fünf Jahren 1,2 Milliarden US-Dollar für die Forschung und Entwicklung im Bereich der Quantentechnologie durch Agenturen wie NIST, NSF und DOE bereit. IBM stellte einen Quantencomputer mit 1.121 Qubits vor, was einen deutlichen Sprung gegenüber dem vorherigen Modell mit 433 Qubits darstellt. Diese Leistung unterstreicht den raschen Fortschritt in der Quantentechnologie und IBMs Engagement, bis 2033 wichtige Herausforderungen wie Fehlerkorrektur und Skalierung auf Großsysteme anzugehen.
Ausbau der AR- und VR-Technologien
Das Wachstum der Technologien Augmented Reality (AR) und Virtual Reality (VR) bietet dem US-Softwaremarkt große Chancen, da es die Nachfrage nach innovativen Softwarelösungen ankurbelt, die diese immersiven Technologien nutzen. AR und VR ermöglichen neue Möglichkeiten der Interaktion mit digitalen Inhalten und Umgebungen und bieten Anwendungen in unterschiedlichen Bereichen wie Gaming, Bildung, Gesundheitswesen und Immobilien. Diese Expansion schafft einen wachsenden Markt für Softwareentwickler, die ansprechende AR- und VR-Anwendungen, -Tools und -Plattformen erstellen, die die immersiven und interaktiven Fähigkeiten dieser Technologien nutzen.
Zum Beispiel:-
- Im August 2024 hob der Artikel hervor, dass AR- und VR-Technologien in den letzten Jahren erhebliche Fortschritte gemacht haben, wobei Trends eine zunehmende Akzeptanz in verschiedenen Branchen zeigen. Unternehmen setzten AR und VR für verbesserte Kundenerlebnisse, Schulungen und Remote-Zusammenarbeit ein. Die Integration dieser Technologien in alltägliche Anwendungen markierte eine bemerkenswerte Veränderung ihrer Marktpräsenz. In den USA profitierte der Softwaremarkt von diesem Wachstum, wobei AR- und VR-Software für innovative Lösungen und Strategien zur Benutzereinbindung von entscheidender Bedeutung wurde. Diese Expansion unterstrich eine wachsende Nachfrage nach spezialisierter Software zur Unterstützung und Verbesserung immersiver Erlebnisse
Einschränkungen/Herausforderungen
- Ökologische Nachhaltigkeit
Die Umweltauswirkungen des Softwarebetriebs zu berücksichtigen , ist eine große Herausforderung für den US-Softwaremarkt, da das Wachstum der Branche und ihre Abhängigkeit von Rechenzentren und Cloud-Computing zu einem erheblichen Energieverbrauch und CO2-Emissionen beitragen. Die gestiegene Nachfrage nach Softwarediensten führt zu einem Bedarf an einer umfangreichen Datenverarbeitungs- und Speicherinfrastruktur, die wiederum eine große Menge an Strom verbraucht. Dieser Energieverbrauch, der oft aus nicht erneuerbaren Quellen stammt, stellt eine Herausforderung für Softwareunternehmen dar, die ihren CO2-Fußabdruck reduzieren und nachhaltigere Praktiken einführen möchten.
Zum Beispiel:-
- Im August 2022 steht der US-Softwaremarkt vor einer kritischen ökologischen Nachhaltigkeitsherausforderung: der Reduzierung des CO2-Fußabdrucks seiner digitalen Technologien. Obwohl Software den technologischen Fortschritt vorantreibt, trägt sie erheblich zu den globalen Treibhausgasemissionen bei, wobei der IKT-Sektor für bis zu 4 % dieser Emissionen verantwortlich ist. Da die digitale Nutzung aufgrund wachsender Internetanforderungen und energieintensiver Aktivitäten wie dem Mining von Kryptowährungen stark zunimmt, ist es für Entwickler und Unternehmen von entscheidender Bedeutung, sich auf energieeffiziente Codierung zu konzentrieren und grüne Technologien einzusetzen. Die Lösung dieser Probleme ist von entscheidender Bedeutung, um Softwareinnovationen mit umfassenderen Nachhaltigkeitszielen in Einklang zu bringen und ihre ökologischen Auswirkungen zu minimieren.
Zunehmende Komplexität in Software-Ökosystemen
Die zunehmende Komplexität von Software-Ökosystemen stellt eine große Herausforderung für den US-Softwaremarkt dar, da sie die Integration, Wartung und Verwaltung unterschiedlicher Systeme und Komponenten erschwert. Da Softwarelösungen immer stärker mit verschiedenen Plattformen, Diensten und Technologien verknüpft werden, wird die Verwaltung dieser Abhängigkeiten immer schwieriger. Diese Komplexität kann zu Integrationsproblemen führen, bei denen unterschiedliche Systeme nicht reibungslos zusammenarbeiten, was zu betrieblichen Ineffizienzen und längeren Entwicklungszeiten führt. Die Notwendigkeit, Kompatibilität und reibungslose Kommunikation über eine Vielzahl von Systemen hinweg sicherzustellen, erschwert die Softwareentwicklung und -implementierung zusätzlich.
Auswirkungen von Rohstoffknappheit und Lieferverzögerungen und aktuelles Marktszenario
Data Bridge Market Research bietet eine umfassende Marktanalyse und liefert Informationen, indem es die Auswirkungen und das aktuelle Marktumfeld von Rohstoffknappheit und Lieferverzögerungen berücksichtigt. Dies bedeutet, dass strategische Möglichkeiten bewertet, wirksame Aktionspläne erstellt und Unternehmen bei wichtigen Entscheidungen unterstützt werden.
Neben dem Standardbericht bieten wir auch detaillierte Analysen des Beschaffungsniveaus anhand prognostizierter Lieferverzögerungen, Händlerzuordnung nach Regionen, Warenanalysen, Produktionsanalysen, Preiszuordnungstrends, Beschaffung, Kategorieleistungsanalysen, Lösungen zum Lieferkettenrisikomanagement, erweitertes Benchmarking und andere Dienste für Beschaffung und strategische Unterstützung.
Erwartete Auswirkungen der Konjunkturabschwächung auf die Preisgestaltung und Verfügbarkeit von Produkten
Wenn die Wirtschaftstätigkeit nachlässt, leiden auch die Branchen darunter. Die prognostizierten Auswirkungen des Konjunkturabschwungs auf die Preisgestaltung und Verfügbarkeit der Produkte werden in den von DBMR bereitgestellten Markteinblickberichten und Informationsdiensten berücksichtigt. Damit sind unsere Kunden ihren Konkurrenten in der Regel immer einen Schritt voraus, können ihre Umsätze und Erträge prognostizieren und ihre Gewinn- und Verlustaufwendungen abschätzen.
Umfang des US-Softwaremarktes
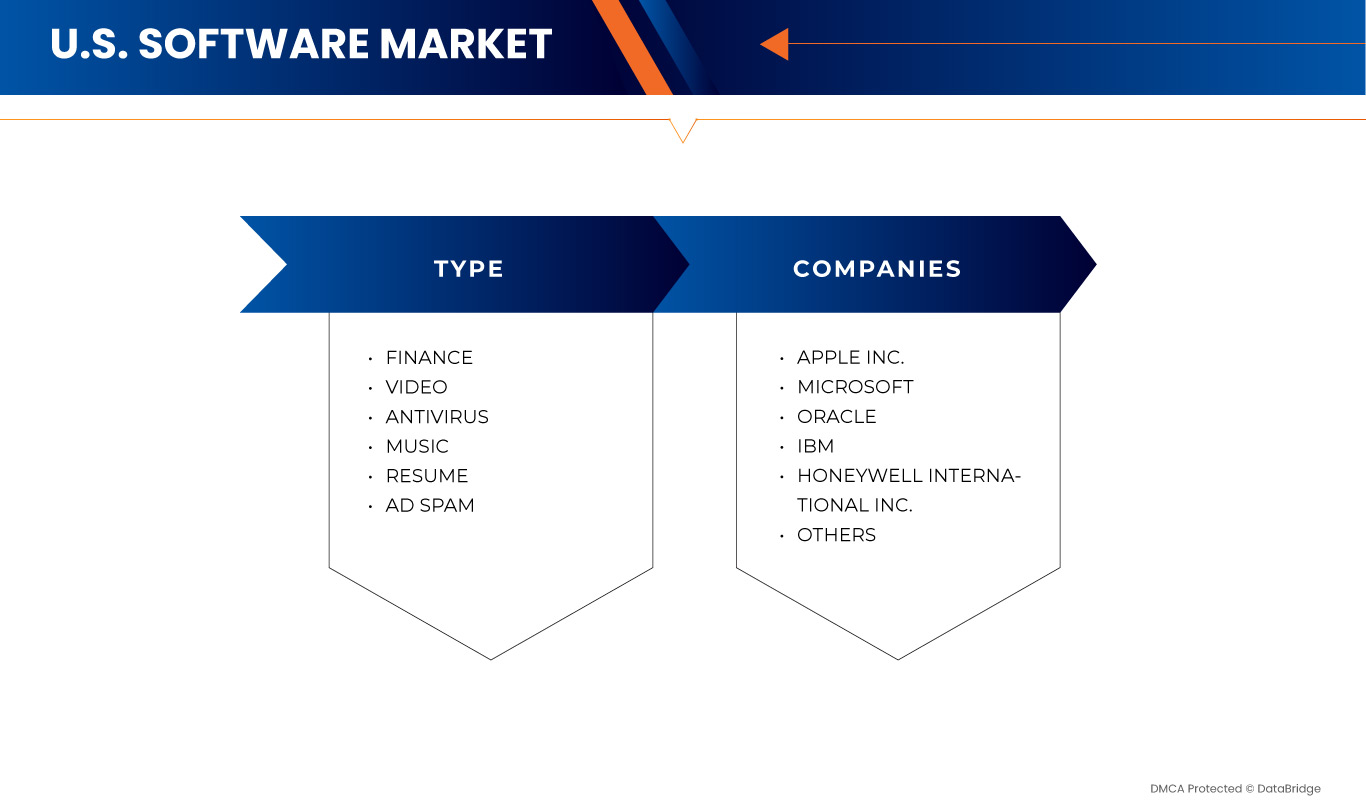
Der US-Softwaremarkt ist je nach Typ in zwei bemerkenswerte Segmente unterteilt.
Typ
- Finanzen
- Video
- Virenschutz
- Musik
- Wieder aufnehmen
- Werbe-Spam
Der Marktanteil von US-Software
Die Wettbewerbslandschaft des Marktes liefert Einzelheiten zu den einzelnen Wettbewerbern. Die enthaltenen Einzelheiten umfassen Unternehmensübersicht, Unternehmensfinanzen, erzielten Umsatz, Marktpotenzial, Investitionen in Forschung und Entwicklung, neue Marktinitiativen, Länderpräsenz, Produktionsstandorte und -anlagen, Produktionskapazitäten, Stärken und Schwächen des Unternehmens, Produkteinführung, Produktbreite und -umfang, Anwendungsdominanz. Die oben angegebenen Datenpunkte beziehen sich nur auf den Fokus der Unternehmen in Bezug auf den Markt.
Die auf dem Markt tätigen Software-Marktführer sind:
- Infor (USA)
- Workday, Inc. (USA)
- Microsoft (US)
- Zoho Corporation Pvt. Ltd. (Indien)
- Avid Technology, Inc. (USA)
- Presonus Audio Electronics, Inc. (USA)
- Apple Inc. (USA)
- Adobe Inc. (USA)
- Cakewalk (BandLab Technologies) (Singapur)
- Cockos Incorporated (USA)
- MOTU, Inc. (USA)
- Verint Systems Inc. (USA)
- AxonSoft (USA)
- Panopto (USA), Arcues, Inc. (USA),
- Honeywell International Inc. (USA)
Neueste Entwicklungen auf dem US-Softwaremarkt
- Im Februar 2024 stellte Microsoft Copilot for Finance vor, ein neues KI-gestütztes Tool innerhalb von Microsoft 365, das Finanzaufgaben wie Reporting und Analyse rationalisieren soll. Diese Innovation verspricht mehr Effizienz und Genauigkeit für Finanzfachleute und kommt Microsoft zugute, indem sie die Attraktivität und den Nutzen seiner Cloud-Dienste steigert und möglicherweise zu einer stärkeren Akzeptanz führt.
- Im Januar 2024 erweiterte Microsoft den Copilot für Microsoft 365 auf Unternehmen jeder Größe. Das KI-gesteuerte Tool steigerte die Produktivität, indem es Routineaufgaben automatisierte und erweiterte Dateneinblicke lieferte. Dies vergrößerte auch die Marktreichweite von Microsoft und stärkte seinen Wettbewerbsvorteil, da es nun ein breiteres Spektrum an Geschäftskunden anspricht.
- Im August 2024 hat Oracle seine zweite öffentliche Cloud-Region in Riad, Saudi-Arabien, eröffnet und damit seine Investitionen in die Cloud-Infrastruktur auf 1,5 Milliarden USD erhöht. Dieser Schritt unterstützt Saudi Vision 2030, indem er KI-Innovation und Geschäftsresilienz verbessert. Die neue Region stärkt neben der bestehenden Region Dschidda die Cloud-Präsenz von Oracle in den USA
SKU-
Erhalten Sie Online-Zugriff auf den Bericht zur weltweit ersten Market Intelligence Cloud

- Interaktives Datenanalyse-Dashboard
- Unternehmensanalyse-Dashboard für Chancen mit hohem Wachstumspotenzial
- Zugriff für Research-Analysten für Anpassungen und Abfragen
- Konkurrenzanalyse mit interaktivem Dashboard
- Aktuelle Nachrichten, Updates und Trendanalyse
- Nutzen Sie die Leistungsfähigkeit der Benchmark-Analyse für eine umfassende Konkurrenzverfolgung
Forschungsmethodik
Die Datenerfassung und Basisjahresanalyse werden mithilfe von Datenerfassungsmodulen mit großen Stichprobengrößen durchgeführt. Die Phase umfasst das Erhalten von Marktinformationen oder verwandten Daten aus verschiedenen Quellen und Strategien. Sie umfasst die Prüfung und Planung aller aus der Vergangenheit im Voraus erfassten Daten. Sie umfasst auch die Prüfung von Informationsinkonsistenzen, die in verschiedenen Informationsquellen auftreten. Die Marktdaten werden mithilfe von marktstatistischen und kohärenten Modellen analysiert und geschätzt. Darüber hinaus sind Marktanteilsanalyse und Schlüsseltrendanalyse die wichtigsten Erfolgsfaktoren im Marktbericht. Um mehr zu erfahren, fordern Sie bitte einen Analystenanruf an oder geben Sie Ihre Anfrage ein.
Die wichtigste Forschungsmethodik, die vom DBMR-Forschungsteam verwendet wird, ist die Datentriangulation, die Data Mining, die Analyse der Auswirkungen von Datenvariablen auf den Markt und die primäre (Branchenexperten-)Validierung umfasst. Zu den Datenmodellen gehören ein Lieferantenpositionierungsraster, eine Marktzeitlinienanalyse, ein Marktüberblick und -leitfaden, ein Firmenpositionierungsraster, eine Patentanalyse, eine Preisanalyse, eine Firmenmarktanteilsanalyse, Messstandards, eine globale versus eine regionale und Lieferantenanteilsanalyse. Um mehr über die Forschungsmethodik zu erfahren, senden Sie eine Anfrage an unsere Branchenexperten.
Anpassung möglich
Data Bridge Market Research ist ein führendes Unternehmen in der fortgeschrittenen formativen Forschung. Wir sind stolz darauf, unseren bestehenden und neuen Kunden Daten und Analysen zu bieten, die zu ihren Zielen passen. Der Bericht kann angepasst werden, um Preistrendanalysen von Zielmarken, Marktverständnis für zusätzliche Länder (fordern Sie die Länderliste an), Daten zu klinischen Studienergebnissen, Literaturübersicht, Analysen des Marktes für aufgearbeitete Produkte und Produktbasis einzuschließen. Marktanalysen von Zielkonkurrenten können von technologiebasierten Analysen bis hin zu Marktportfoliostrategien analysiert werden. Wir können so viele Wettbewerber hinzufügen, wie Sie Daten in dem von Ihnen gewünschten Format und Datenstil benötigen. Unser Analystenteam kann Ihnen auch Daten in groben Excel-Rohdateien und Pivot-Tabellen (Fact Book) bereitstellen oder Sie bei der Erstellung von Präsentationen aus den im Bericht verfügbaren Datensätzen unterstützen.

