
Global Gastric Cancer Diagnostics Market, By Product Type (Instruments, Reagents & Consumables, Services), Diagnostics Type (Confirmatory Test, Gastric Cancer Screening Tests/Physical Exam), Age Group (Adult, Pediatric, and Geriatrics), Disease Type (Intestinal Or Diffuse Adenocarcinoma, Carcinoid Tumor, Gastrointestinal Stromal Tumor (GIST), Gastric Lymphoma and Others), Stage (Stage 0, Stage I, Stage II, Stage III), Gender (Male and Female), Sample Type (Blood, Tissue, Urine, and Stool), End Users (Diagnostic Laboratories, Hospitals, Cancer Research Institutes, Oncology Specialty Clinics, and Others), Distribution Channel (Direct Tenders and Retail Sales) - Industry Trends and Forecast to 2030.
Gastric Cancer Diagnostics Market Analysis and Insights
The increase in the global geriatric population is driving the growth of the gastric cancer diagnostics industry. The prevalence of gastrointestinal tumors and lymphomas has also fueled the demand for gastric cancer diagnostics. The key market constraint is the need to lower the high prices associated with cancer diagnostic testing so that even developing countries may benefit from it.

Large numbers of market players are offering gastric cancer diagnostics products with innovations that pave the way for the growth of the global gastric cancer diagnostics market.
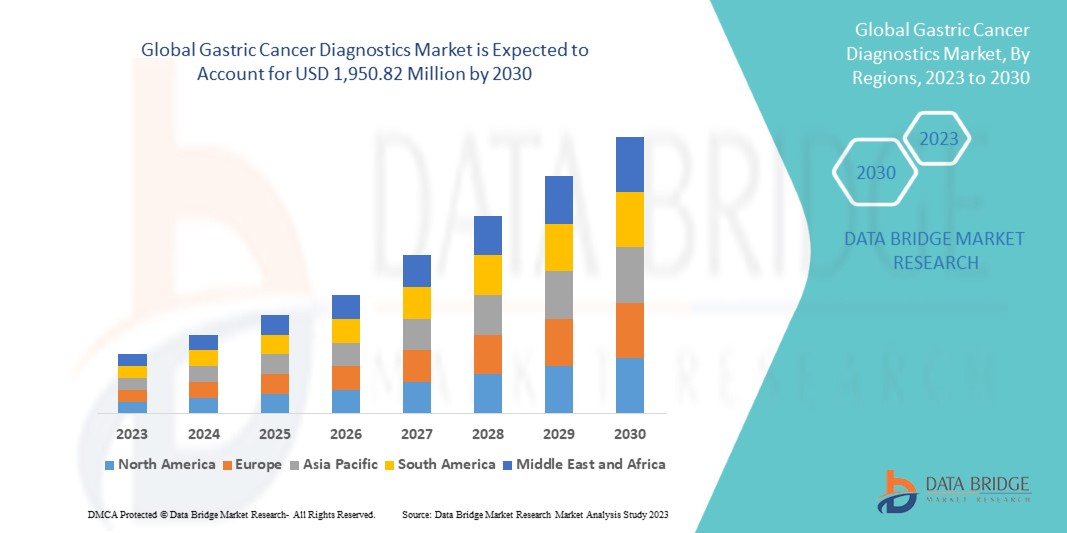
Data Bridge Market Research analyzes that the global gastric cancer diagnostics market is expected to reach a value of USD 1,950.82 million by 2030, at a CAGR of 8.% during the forecast period. Reagents and consumables account for the largest product type segment in the market due to rising demand for kits and reagents, and increasing health expenditures have accelerated the demand for smart medical devices.
|
Report Metric |
Details |
|
Forecast Period |
2023 to 2030 |
|
Base Year |
2022 |
|
Historic Years |
2021 (Customisable to 2015-2020) |
|
Quantitative Units |
Revenue in USD Million, Volumes in Units, Pricing in USD |
|
Segments Covered |
By Product Type (Instruments, Reagents & Consumables, Services), Diagnostics Type (Confirmatory Test, Gastric Cancer Screening Tests/Physical Exam), Age Group (Adult, Pediatric, and Geriatrics), Disease Type (Intestinal Or Diffuse Adenocarcinoma, Carcinoid Tumor, Gastrointestinal Stromal Tumor (GIST), Gastric Lymphoma and Others), Stage (Stage 0, Stage I, Stage II, Stage III), Gender (Male and Female), Sample Type (Blood, Tissue, Urine, and Stool), End Users (Diagnostic Laboratories, Hospitals, Cancer Research Institutes, Oncology Specialty Clinics, and Others), Distribution Channel (Direct Tenders and Retail Sales) |
|
Countries Covered |
U.S., Canada, and Mexico, Germany, U.K., France, Italy, Spain, Netherlands, Russia, Switzerland, Turkey, Belgium, rest of Europe, Japan, China, Australia, India, South Korea, Singapore, Indonesia, Thailand, Malaysia, Philippines, rest of Asia-Pacific, Brazil, Argentina, rest of South America, Saudi Arabia, South Africa, U.A.E, Israel, Egypt, and rest of Middle East and Africa |
|
Market Players Covered |
Myriad Genetics, Inc., ACON Laboratories, Inc., Teco Diagnostics., Vela Diagnostics, Abbott, AdvaCare Pharma, Fujirebio ( An H.U. Group company), Thermo Fisher Scientific Inc., F. Hoffmann-La Roche Ltd, General Electric, Agilent Technologies, Inc., Endofotonics Pte Ltd, Biohit Oyj, BIOCEPT, INC., FOUNDATION MEDICINE, INC., DiaSorin S.p.A, Paragon Genomics, Inc., BIOMÉRIEUX, and QIAGEN among others. |
Market Definition
Stomach cancer is a type of cancer that starts in the stomach and spreads throughout the body. The stomach is a muscular pouch that lies immediately below the ribs in the upper part of the abdomen. The stomach takes in and holds the food we eat before breaking it down and digesting it. Stomach cancer, commonly referred to as gastric cancer, can occur in any section of the stomach. Stomach cancers develop in the major section of the stomach in most parts of the world (stomach body). Various diagnostic tests used for the diagnosis of cancer include prescreening tests, biopsy, biomarkers, imaging tests, PET/CT scans, and ultrasound among others.
Cancer is caused by uncontrolled, abnormal cell proliferation that has the ability to spread and invade other sections of the body. Changes in the gene cause a single cell or a few cells to expand and replicate, which is when cancer begins. This could lead to the growth of a tumor, which is an abnormal mass of tissue. The creation of cancer cells in the stomach lining is known as gastric cancer or stomach cancer. Diet and stomach disorders are both risk factors for gastric cancer.
Global Gastric Cancer Diagnostics Market Dynamics
This section deals with understanding the market drivers, advantages, opportunities, restraints, and challenges. All of this is discussed in detail below:
Drivers
- Increase in incidence of gastrointestinal tumors, lymphoma, and adenocarcinoma
According to a report published in Clinical Medicine, gastric cancer is the fifth most common cancer and the fourth leading cause of cancer death worldwide in 2020. In 2020, an estimated 1.1 million cases (720,000 males and 370,000 females) of gastric cancer were diagnosed worldwide. Gastric cancer is responsible for about 1 in every 12 oncological fatalities. Every year, about a million new instances of stomach cancer are diagnosed around the world.
Es wird erwartet, dass die Zahl der Magenkrebserkrankungen aufgrund der Alterung und des Bevölkerungswachstums, des Lebensstils und des sozioökonomischen Wandels steigen wird. Auffällige Unterschiede in Bezug auf Rasse, soziokulturelle Normen, Verhaltensweisen und Ernährungstrends spiegeln sich in der Belastung und Verbreitung von Krebs in verschiedenen Regionen der Welt wider.
Daher wird erwartet, dass die weltweit steigende Zahl von Krebserkrankungen die Nachfrage nach Magenkrebsdiagnostik beschleunigen wird. Daher wird erwartet, dass die erhöhten Inzidenzraten von Magen-Darm-Tumoren, Lymphomen und Adenokarzinomen das Wachstum des globalen Marktes für Magenkrebsdiagnostik vorantreiben werden.
- Anstieg des Alkoholkonsums und Anstieg des Rauchens
Epidemiologische, klinische und Laborbefunde deuten auf einen Verhaltenszusammenhang zwischen Zigarettenrauchen und Alkoholkonsum hin. Der kombinierte Konsum von Zigaretten und Alkohol wirft zusätzlich zu den alleinigen Zigarettenkonsumrisiken weitere gesundheitliche Probleme auf und stellt somit ein ernstes Problem für die öffentliche Gesundheit dar, das weitere Untersuchungen erfordert.
Jedes Mal, wenn ein Raucher an einer brennenden Zigarette zieht, kommt es zu einer chemischen Kettenreaktion, bei der Dutzende gefährlicher Chemikalien freigesetzt werden. Zigarettenrauch enthält Substanzen, die über die Lippen, die Zunge und den Mund inhaliert werden, durch den Rachen und in die Lunge gelangen, Entzündungen verursachen und diese Körperteile krebserregenden Chemikalien aussetzen.
Daher ist zu erwarten, dass der Anstieg des Alkoholkonsums und der Anstieg des Rauchens das globale Wachstum des Magenkrebsmarktes vorantreiben werden.

Gelegenheit
- Steigende Nutzung automatisierter Systeme
Krebs ist eine System- und Netzwerkkrankheit. Dies bedeutet, dass in einer Krebszelle bestimmte netzwerkbezogene Gene nicht mehr richtig funktionieren. Komplexe Interaktionen in solchen Gennetzwerken müssen bei der Krebsbehandlung berücksichtigt werden. Insbesondere Algorithmen der künstlichen Intelligenz (KI) haben sich rasant weiterentwickelt, was sich im Fortschritt der Onkologie widerspiegelt.
Maschinelles Lernen und neuronale Netze gewinnen in der Präzisionsonkologie und Systemmedizin zunehmend an Bedeutung. Die Kombination von Bilddaten mit klinischen und molekularen Daten eröffnet eine Welt voller Möglichkeiten. Die Radiogenomik beispielsweise ist ein neues Feld, das sich auf die mehrdimensionale Datenverarbeitung konzentriert. Auch sie kann von den Fortschritten der KI profitieren.
Daher stellt die zunehmende Einführung automatisierter Systeme eine Chance für das Wachstum dieses Marktes dar.
Einschränkung/Herausforderung
- Fehlende finanzielle Unterstützung durch die Krankenkassen
Um ihre Ziele zu erreichen, benötigen Gesundheitssysteme finanzielle Ressourcen. Personal, Krankenhausversorgung und Medikamente sind die teuersten Aspekte der meisten Gesundheitssysteme. In den meisten tropischen Ländern wird die Gesundheitsversorgung durch eine Kombination aus staatlichen, privaten (hauptsächlich aus eigener Tasche) Ausgaben und internationaler Hilfe finanziert.
Die Finanzierung des Gesundheitswesens bleibt für Länder mit niedrigem und unterem mittlerem Einkommen ein zentrales Problem. Viele Länder mit oberem mittlerem Einkommen in Lateinamerika, Afrika und Asien konnten Gesundheitsfinanzierungsvereinbarungen treffen, die große Teile ihrer Bevölkerung abdecken. Diese Maßnahmen ermöglichen den Zugang zur Gesundheitsversorgung und schützen die Menschen gleichzeitig vor katastrophalen Schulden, die durch diesen Zugang entstehen. Die Finanzierung hingegen ist ein großes Hindernis für die Gesundheitsversorgung in Ländern mit niedrigem Einkommen (von denen die meisten in Afrika südlich der Sahara liegen).
Der Mangel an ausreichender finanzieller Unterstützung seitens der Krankenversicherungen stellt daher eine Hemmung für das Marktwachstum dar.
Jüngste Entwicklungen
- Im Oktober 2022 arbeitete die General Electric Company mit mehreren Forschungsinstituten wie den University of Cambridge Hospitals, Sophia Genetics und zuvor mit Optellum zusammen, um Bilddaten in Zusammenarbeit mit künstlicher Intelligenz zu nutzen. Dies wird dazu beitragen, die Diagnosezeit mehrerer Krebsarten zu verkürzen und den Patienten eine personalisierte Betreuung zu bieten. Dies hat dem Unternehmen geholfen, seinen Horizont in der Krebsdiagnostik zu erweitern
- Im März 2020 gab Thermo Fisher Scientific Inc. bekannt, dass es QIAGEN, ein niederländisches Unternehmen für Molekulardiagnostik und Gesundheitswesen, übernehmen werde. Diese Übernahme durch das Unternehmen wird sein Produktportfolio auf dem Markt erweitern und in Zukunft zu höheren Umsätzen führen.
Globaler Markt für Magenkrebsdiagnostik
Der globale Markt für Magenkrebsdiagnostik ist in neun wichtige Segmente unterteilt, basierend auf Produkttyp, Diagnosetyp, Altersgruppe, Krankheitstyp, Stadium, Geschlecht, Probe, Endbenutzer und Vertriebskanal. Das Wachstum zwischen den Segmenten hilft Ihnen bei der Analyse von Nischenwachstumsbereichen und Strategien zur Marktansprache sowie bei der Bestimmung Ihrer wichtigsten Anwendungsbereiche und der Unterschiede in Ihren Zielmärkten.
PRODUKTTYP
- Instrumente
- Reagenzien und Verbrauchsmaterialien
- Dienstleistungen
Auf der Grundlage des Produkttyps ist der Markt in Instrumente, Reagenzien und Verbrauchsmaterialien sowie Dienstleistungen segmentiert.
DIAGNOSTYP
- Bestätigungstest
- Magenkrebs-Screening-Tests/körperliche Untersuchung
Auf der Grundlage der Diagnoseart ist der Markt in Magenkrebs-Screeningtests/körperliche Untersuchungen und Bestätigungstests segmentiert.
ALTERSGRUPPE
- Erwachsene
- Pädiatrie
- Geriatrie
Auf der Grundlage der Altersgruppen ist der Markt in Erwachsene, Kinder und Geriatrie segmentiert.
TYP
- Intestinales oder diffuses Adenokarzinom
- Karzinoidtumor
- Gastrointestinaler Stromatumor (GIST)
- Magenlymphom
- Sonstiges
Auf der Grundlage des Typs wird der Markt in intestinales oder diffuses Adenokarzinom, Karzinoidtumor, gastrointestinalen Stromatumor (GIST), Magenlymphom und andere segmentiert.
BÜHNE
- Etappe 0
- Stufe I
- Stufe II
- Stufe III
Auf der Grundlage des Stadiums wird der Markt in Stadium 0, Stadium I, Stadium II und Stadium III segmentiert.
GESCHLECHT
- Männlich
- Weiblich
Auf der Grundlage des Geschlechts ist der Markt in männlich und weiblich segmentiert.
PROBENTYP
- Blut
- Gewebe
- Urin
- Hocker
Auf der Grundlage des Probentyps wird der Markt in Blut, Gewebe, Urin und Stuhl segmentiert.
Endverbraucher
- Diagnostische Labore
- Krankenhäuser
- Krebsforschungsinstitute
- Onkologische Spezialkliniken
- Sonstiges
Auf der Grundlage der Endbenutzer wird der Markt in Diagnoselabore, Krankenhäuser, Krebsforschungsinstitute, onkologische Fachkliniken und andere segmentiert.
VERTRIEBSKANAL
- Direkte Ausschreibungen
- Einzelhandelsumsätze
Auf der Grundlage der Vertriebskanäle wird der Markt in Direktausschreibungen und Einzelhandelsverkäufe segmentiert.

Globaler Markt für Magenkrebsdiagnostik – Regionale Analyse/Einblicke
Der globale Markt für Magenkrebsdiagnostik ist in neun wichtige Segmente unterteilt, basierend auf Produkttyp, Diagnosetyp, Altersgruppe, Krankheitstyp, Stadium, Geschlecht, Probe, Endbenutzer und Vertriebskanal.
Die in diesem Marktbericht abgedeckten Länder sind die USA, Kanada und Mexiko, Deutschland, Großbritannien, Frankreich, Italien, Spanien, die Niederlande, Russland, die Schweiz, die Türkei, Belgien, das übrige Europa, Japan, China, Australien, Indien, Südkorea, Singapur, Indonesien, Thailand, Malaysia, die Philippinen, der restliche asiatisch-pazifische Raum, Brasilien, Argentinien, das übrige Südamerika, Saudi-Arabien, Südafrika, die Vereinigten Arabischen Emirate, Israel, Ägypten sowie der restliche Nahe Osten und Afrika.
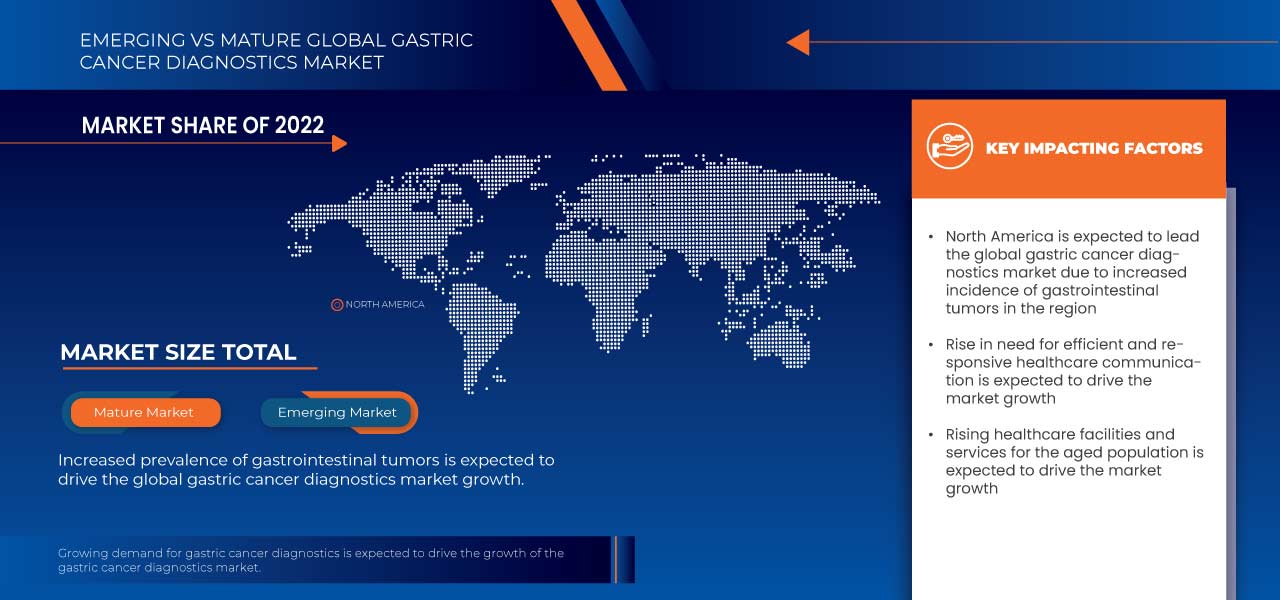
Aufgrund der zunehmenden Verbreitung von Magen-Darm-Tumoren wird Nordamerika voraussichtlich den globalen Markt für Magenkrebsdiagnostik dominieren. Die USA dominieren die Region Nordamerika aufgrund der starken Präsenz wichtiger Akteure. Deutschland dominiert die Region Europa aufgrund der steigenden Nachfrage aus Schwellenmärkten und der Expansion.
Der Länderabschnitt des Berichts enthält auch individuelle marktbeeinflussende Faktoren und Änderungen der Regulierung auf dem Inlandsmarkt, die sich auf die aktuellen und zukünftigen Trends des Marktes auswirken. Datenpunkte wie Neuverkäufe, Ersatzverkäufe, demografische Daten des Landes, Regulierungsgesetze und Import-/Exportzölle sind einige der wichtigsten Anhaltspunkte, die zur Prognose des Marktszenarios für einzelne Länder verwendet werden. Bei der Prognoseanalyse der Länderdaten werden auch die Präsenz und Verfügbarkeit globaler Marken und ihre Herausforderungen aufgrund großer oder geringer Konkurrenz durch lokale und inländische Marken sowie die Auswirkungen der Vertriebskanäle berücksichtigt.

Wettbewerbsumfeld und Magenkrebsdiagnostik Marktanteilsanalyse
Die Wettbewerbslandschaft des globalen Marktes für Magenkrebsdiagnostik liefert Details nach Wettbewerbern. Die enthaltenen Details sind Unternehmensübersicht, Unternehmensfinanzen, erzielter Umsatz, Marktpotenzial, Investitionen in Forschung und Entwicklung, neue Marktinitiativen, Produktionsstandorte und -anlagen, Stärken und Schwächen des Unternehmens, Produkteinführung, Produktzulassungen, Produktbreite und -umfang, Anwendungsdominanz und Produkttyp-Lebenslinienkurve. Die oben angegebenen Datenpunkte beziehen sich nur auf den Fokus des Unternehmens auf den Markt für Magenkrebsdiagnostik.
Zu den wichtigsten Akteuren auf dem globalen Markt für Magenkrebsdiagnostik zählen unter anderem Myriad Genetics, Inc., ACON Laboratories, Inc., Teco Diagnostics., Vela Diagnostics, Abbott, AdvaCare Pharma, Fujirebio (ein Unternehmen der HU Group), Thermo Fisher Scientific Inc., F. Hoffmann-La Roche Ltd, General Electric, Agilent Technologies, Inc., Endofotonics Pte Ltd, Biohit Oyj, BIOCEPT, INC., FOUNDATION MEDICINE, INC., DiaSorin SpA, Paragon Genomics, Inc., BIOMÉRIEUX und QIAGEN.
SKU-
Erhalten Sie Online-Zugriff auf den Bericht zur weltweit ersten Market Intelligence Cloud

- Interaktives Datenanalyse-Dashboard
- Unternehmensanalyse-Dashboard für Chancen mit hohem Wachstumspotenzial
- Zugriff für Research-Analysten für Anpassungen und Abfragen
- Konkurrenzanalyse mit interaktivem Dashboard
- Aktuelle Nachrichten, Updates und Trendanalyse
- Nutzen Sie die Leistungsfähigkeit der Benchmark-Analyse für eine umfassende Konkurrenzverfolgung
Inhaltsverzeichnis
- introduction
- OBJECTIVES OF THE STUDY
- MARKET DEFINITION
- OVERVIEW of GLOBAL gastric cancer diagnostics market
- LIMITATIONs
- MARKETS COVERED
- MARKET SEGMENTATION
- MARKETS COVERED
- geographical scope
- years considered for the study
- currency and pricing
- DBMR TRIPOD DATA VALIDATION MODEL
- MULTIVARIATE MODELLING
- packaging LIFELINE CURVE
- primary interviews with key opinion leaders
- DBMR MARKET POSITION GRID
- vendor share analysis
- MARKET END USER COVERAGE GRID
- secondary sourcEs
- assumptions
- EXECUTIVE SUMMARY
- PREMIUM INSIGHTS
- ROLE OF ARTIFICIAL INTELLIGENCE (AI) AND MACHINE LEARNING (ML) IN GASTRIC CANCER DIAGNOSTICS
- products (brands) Detailed information
- REGULATIONS OF GLOBAL GASTRIC CANCER DIAGNOSTICS MARKET
- Epidemiology
- market overview
- DRIVERS
- INCREASE IN INCIDENCE OF GASTROINTESTINAL TUMOURS, LYMPHOMA, AND ADENOCARCINOMA
- RISE IN ALCOHOL CONSUMPTION AND SURGE IN SMOKING
- INCREASE IN THE GERIATRIC POPULATION
- STRATEGIC INITIATIVES BY KEY MARKET PLAYERS
- RECENT ADVANCES IN GASTRIC CANCER DIAGNOSTICS
- RESTRAINTS
- HIGH COST OF TESTING
- LACK OF SUFFICIENT FINANCIAL SUPPORT FROM HEALTH INSURANCE POLICIES
- OPPORTUNITIES
- RISING HEALTHCARE SPENDING
- ADOPTION OF AUTOMATED SYSTEMS
- INCREASED RESEARCH AND DEVELOPMENT ON CANCER DIAGNOSTICS
- CHALLENGES
- STRINGENT REGULATIONS AND POLICIES FOR APPROVING THE COMPLICATED NATURE OF RADIATION DEVICES
- LIMITATIONS OF RADIATION TESTS
- IMPACT OF COVID-19 ON GLOBAL GASTRIC CANCER DIAGNOSTICS MARKET
- IMPACT ON PRICE
- IMPACT ON DEMAND
- IMPACT ON SUPPLY CHAIN
- KEY INITIATIVES BY MARKET PLAYERS DURING COVID-19
- CONCLUSION
- global gastric cancer diagnostics market, By product type
- overview
- Reagents & Consumables
- Kits
- DNA POLYMERASE KITS
- PCR KITS
- NUCLEIC ACID ISOLATION KITS
- OTHERS
- Reagents
- ASSAYS
- BUFFERS
- PRIMERS
- OTHERS
- instruments
- services
- global gastric cancer diagnostics market, By diagnostic type
- overview
- confirmatory test
- imaging tests
- PET SCAN/CT SCAN
- CT SCAN
- ULTRASOUND
- MRI
- X-RAY
- biomarker
- DNA BIOMARKER
- RNA BIOMARKER
- PROTEIN BIOMARKER
- biopsy
- gastric cancer screening tests/physical exam
- global gastric cancer diagnostics market, By age group
- overview
- geriatrics
- adult
- pediatric
- global gastric cancer diagnostics market, By disease type
- overview
- intestinal or diffuse adenocarcinoma
- carcinoid tumor
- gastrointestinal stromal tumor
- gastric lymphoma
- others
- global gastric cancer diagnostics market, By stage
- overview
- stage i
- stage iA
- stage iB
- stage iI
- stage IiA
- stage IiB
- stage iII
- stage IiIA
- stage IiIB
- stage IiIC
- stage 0
- global gastric cancer diagnostics market, By GENDER
- overview
- male
- female
- global gastric cancer diagnostics market, By sample type
- overview
- stool
- tissue
- blood
- urine
- global gastric cancer diagnostics market, By end user
- overview
- hospitals
- diagnostic laboratories
- cancer research institutes
- oncology specialty clinics
- others
- global gastric cancer diagnostics market, By distribution channel
- overview
- direct tenders
- Retail Sales
- GLOBAL gastric cancer diagnostics MARKET, BY REGION
- overview
- NORTH AMERICA
- U.S.
- Canada
- Mexico
- EUROPE
- Germany
- France
- U.K.
- Russia
- Italy
- Spain
- Belgium
- Netherlands
- Turkey
- Switzerland
- Rest of Europe
- Asia-Pacific
- South Korea
- JAPAN
- CHINA
- AUSTRALIA
- Singapore
- India
- THAILAND
- Malaysia
- INDONESIA
- PHILIPPINES
- Rest of ASIA-PACIFIC
- SOUTH AMERICA
- Brazil
- Argentina
- Rest of South America
- MIDDLE EAST AND AFRICA
- South Africa
- Saudi Arabia
- U.A.E.
- Egypt
- Israel
- Rest of Middle East & Africa
- GLOBAL Gastric Cancer diagnostics Market: COMPANY landscape
- company share analysis: global
- company share analysis: north america
- company share analysis: europe
- company share analysis: Asia-Pacific
- SWOT
- Company profile
- F. Hoffmann-La Roche Ltd
- COMPANY SNAPSHOT
- REVENUE ANALYSIS
- COMPANY SHARE ANALYSIS
- PRODUCT PORTFOLIO
- RECENT DEVELOPMENT
- GENERAL ELECTRIC COMPANY
- COMPANY SNAPSHOT
- REVENUE ANALYSIS
- COMPANY SHARE ANALYSIS
- PRODUCT PORTFOLIO
- RECENT DEVELOPMENT
- BIOMÉRIEUX SA
- COMPANY SNAPSHOT
- REVENUE ANALYSIS
- COMPANY SHARE ANALYSIS
- PRODUCT PORTFOLIO
- RECENT DEVELOPMENT
- Myriad Genetics, Inc.
- COMPANY SNAPSHOT
- REVENUE ANALYSIS
- COMPANY SHARE ANALYSIS
- PRODUCT PORTFOLIO
- RECENT DEVELOPMENT
- abbott
- COMPANY SNAPSHOT
- REVENUE ANALYSIS
- COMPANY SHARE ANALYSIS
- PRODUCT PORTFOLIO
- RECENT DEVELOPMENT
- ACON Laboratories, Inc.
- COMPANY SNAPSHOT
- PRODUCT PORTFOLIO
- RECENT DEVELOPMENT
- ADVACARE PHARMA
- COMPANY SNAPSHOT
- PRODUCT PORTFOLIO
- RECENT DEVELOPMENT
- AGILENT TECHNOLOGIES, INC.
- COMPANY SNAPSHOT
- REVENUE ANALYSIS
- PRODUCT PORTFOLIO
- RECENT DEVELOPMENTS
- BIOCEPT, INC.
- COMPANY SNAPSHOT
- REVENUE ANALYSIS
- PRODUCT PORTFOLIO
- RECENT DEVELOPMENT
- Biohit Oyj
- COMPANY SNAPSHOT
- REVENUE ANALYSIS
- PRODUCT PORTFOLIO
- RECENT DEVELOPMENT
- DiaSorin S.p.A
- COMPANY SNAPSHOT
- REVENUE ANALYSIS
- PRODUCT PORTFOLIO
- RECENT DEVELOPMENT
- Endofotonics Pte Ltd
- COMPANY SNAPSHOT
- PRODUCT PORTFOLIO
- RECENT DEVELOPMENT
- foundation medicine, inc.
- COMPANY SNAPSHOT
- PRODUCT PORTFOLIO
- RECENT DEVELOPMENTS
- fujirebio (an h.u. group company)
- COMPANY SNAPSHOT
- REVENUE ANALYSIS
- PRODUCT PORTFOLIO
- RECENT DEVELOPMENT
- MiRXES
- COMPANY SNAPSHOT
- PRODUCT PORTFOLIO
- RECENT DEVELOPMENT
- Paragon Genomics, Inc.
- COMPANY SNAPSHOT
- PRODUCT PORTFOLIO
- RECENT DEVELOPMENTS
- qiagen
- COMPANY SNAPSHOT
- REVENUE ANALYSIS
- PRODUCT PORTFOLIO
- RECENT DEVELOPMENT
- teco diagnostics
- COMPANY SNAPSHOT
- PRODUCT PORTFOLIO
- RECENT DEVELOPMENT
- Thermo Fisher Scientific Inc.
- COMPANY SNAPSHOT
- REVENUE ANALYSIS
- PRODUCT PORTFOLIO
- RECENT DEVELOPMENTS
- vela diagnostics
- COMPANY SNAPSHOT
- PRODUCT PORTFOLIO
- RECENT DEVELOPMENTS
- questionnaire
- related reports
Tabellenverzeichnis
TABLE 1 global gastric cancer diagnostics market, By product type, 2019-2028 (USD million)
TABLE 2 Global reagents & consumables in Gastric cancer diagnostics Market, By Region, 2019-2028 (USD Million)
TABLE 3 global Reagent and consumables IN gastric cancer diagnostics market, By product type, 2019-2028 (USD million)
TABLE 4 global kits IN gastric cancer diagnostics market, By product type, 2019-2028 (USD million)
TABLE 5 global reagents IN gastric cancer diagnostics market, By product type, 2019-2028 (USD million)
TABLE 6 Global instruments in Gastric cancer diagnostics Market, By Region, 2019-2028 (USD Million)
TABLE 7 Global services in Gastric cancer diagnostics Market, By Region, 2019-2028 (USD Million)
TABLE 8 global gastric cancer diagnostics market, By diagnostic type, 2019-2028 (USD million)
TABLE 9 Global confirmatory test in Gastric cancer diagnostics Market, By Region, 2019-2028 (USD Million)
TABLE 10 Global confirmatory test in Gastric cancer diagnostics Market, By diagnostic type, 2019-2028 (USD Million)
TABLE 11 Global imaging tests in Gastric cancer diagnostics Market, By diagnostic type, 2019-2028 (USD Million)
TABLE 12 Global biomarker in Gastric cancer diagnostics Market, By diagnostic type, 2019-2028 (USD Million)
TABLE 13 Global gastric cancer screening tests/physical exam in Gastric cancer diagnostics Market, By Region, 2019-2028 (USD Million)
TABLE 14 global gastric cancer diagnostics market, By age group, 2019-2028 (USD million)
TABLE 15 Global geriatrics in Gastric cancer diagnostics Market, By Region, 2019-2028 (USD Million)
TABLE 16 Global adult in Gastric cancer diagnostics Market, By Region, 2019-2028 (USD Million)
TABLE 17 Global pediatric in Gastric cancer diagnostics Market, By Region, 2019-2028 (USD Million)
TABLE 18 global gastric cancer diagnostics market, By disease type, 2019-2028 (USD million)
TABLE 19 Global intestinal or diffuse ADENOCARCINOMA in Gastric cancer diagnostics Market, By Region, 2019-2028 (USD Million)
TABLE 20 Global carcinoid tumor in Gastric cancer diagnostics Market, By Region, 2019-2028 (USD Million)
TABLE 21 Global gastrointestinal stromal tumor in Gastric cancer diagnostics Market, By Region, 2019-2028 (USD Million)
TABLE 22 Global gastric lymphoma in Gastric cancer diagnostics Market, By Region, 2019-2028 (USD Million)
TABLE 23 Global others in Gastric cancer diagnostics Market, By Region, 2019-2028 (USD Million)
TABLE 24 global gastric cancer diagnostics market, By stage, 2019-2028 (USD million)
TABLE 25 Global stage i in Gastric cancer diagnostics Market, By Region, 2019-2028 (USD Million)
TABLE 26 Global stage i in Gastric cancer diagnostics Market, By stage, 2019-2028 (USD Million)
TABLE 27 Global stage iI in Gastric cancer diagnostics Market, By Region, 2019-2028 (USD Million)
TABLE 28 Global stage iI in Gastric cancer diagnostics Market, By stage, 2019-2028 (USD Million)
TABLE 29 Global stage iII in Gastric cancer diagnostics Market, By Region, 2019-2028 (USD Million)
TABLE 30 Global stage iIi in Gastric cancer diagnostics Market, By stage, 2019-2028 (USD Million)
TABLE 31 Global stage 0 in Gastric cancer diagnostics Market, By Region, 2019-2028 (USD Million)
TABLE 32 global gastric cancer diagnostics market, By gender, 2019-2028 (USD million)
TABLE 33 Global male in Gastric cancer diagnostics Market, By Region, 2019-2028 (USD Million)
TABLE 34 Global female in Gastric cancer diagnostics Market, By Region, 2019-2028 (USD Million)
TABLE 35 global gastric cancer diagnostics market, By sample type, 2019-2028 (USD million)
TABLE 36 Global stool in Gastric cancer diagnostics Market, By Region, 2019-2028 (USD Million)
TABLE 37 Global tissue in Gastric cancer diagnostics Market, By Region, 2019-2028 (USD Million)
TABLE 38 Global blood in Gastric cancer diagnostics Market, By Region, 2019-2028 (USD Million)
TABLE 39 Global urine in Gastric cancer diagnostics Market, By Region, 2019-2028 (USD Million)
TABLE 40 global gastric cancer diagnostics market, By end user, 2019-2028 (USD million)
TABLE 41 Global HOSPITALS in Gastric cancer diagnostics Market, By Region, 2019-2028 (USD Million)
TABLE 42 Global diagnostic laboratories in Gastric cancer diagnostics Market, By Region, 2019-2028 (USD Million)
TABLE 43 Global cancer research institutes in Gastric cancer diagnostics Market, By Region, 2019-2028 (USD Million)
TABLE 44 Global oncology specialty clinics in Gastric cancer diagnostics Market, By Region, 2019-2028 (USD Million)
TABLE 45 Global others in Gastric cancer diagnostics Market, By Region, 2019-2028 (USD Million)
TABLE 46 global gastric cancer diagnostics market, By distribution channel, 2019-2028 (USD million)
TABLE 47 Global direct tenders in Gastric cancer diagnostics Market, By Region, 2019-2028 (USD Million)
TABLE 48 Global Retail Sales in Gastric cancer diagnostics Market, By Region, 2019-2028 (USD Million)
TABLE 49 GLOBAL gastric cancer diagnostics market, By region, 2019-2028 (usd million)
TABLE 50 NORTH AMERICA Gastric Cancer Diagnostics Market, By COUNTRY, 2019-2028 (USD Million)
TABLE 51 North America Gastric Cancer Diagnostics Market, By Product Type, 2019-2028 (USD Million)
TABLE 52 North America Reagents & Consumables in Gastric Cancer Diagnostics Market, By Product Type, 2019-2028 (USD Million)
TABLE 53 North America Kits in Gastric Cancer Diagnostics Market, By Product Type, 2019-2028 (USD Million)
TABLE 54 North America Reagents in Gastric Cancer Diagnostics Market, By Product Type, 2019-2028 (USD Million)
TABLE 55 North America Gastric Cancer Diagnostics Market, By Diagnostic Type, 2019-2028 (USD Million)
TABLE 56 North America Confirmatory tests in Gastric Cancer Diagnostics Market, By Diagnostic Type, 2019-2028 (USD Million)
TABLE 57 North America Imaging Tests in Gastric Cancer Diagnostics Market, By Diagnostic Type, 2019-2028 (USD Million)
TABLE 58 North America Biomarker in Gastric Cancer Diagnostics Market, By Diagnostic Type, 2019-2028 (USD Million)
TABLE 59 North America Gastric Cancer Diagnostics Market, By Age Group, 2019-2028 (USD Million)
TABLE 60 North America Gastric Cancer Diagnostics Market, By Disease Type, 2019-2028 (USD Million)
TABLE 61 North America Gastric Cancer Diagnostics Market, By Stage, 2019-2028 (USD Million)
TABLE 62 North America Stage I in Gastric Cancer Diagnostics Market, By Stage, 2019-2028 (USD Million)
TABLE 63 North America Stage II in Gastric Cancer Diagnostics Market, By Stage, 2019-2028 (USD Million)
TABLE 64 North America Stage III in Gastric Cancer Diagnostics Market, By Stage, 2019-2028 (USD Million)
TABLE 65 North America Gastric Cancer Diagnostics Market, By Gender, 2019-2028 (USD Million)
TABLE 66 North America Gastric Cancer Diagnostics Market, By Sample Type, 2019-2028 (USD Million)
TABLE 67 North America Gastric Cancer Diagnostics Market, By End User, 2019-2028 (USD Million)
TABLE 68 North America Gastric Cancer Diagnostics Market, By Distribution CHannel, 2019-2028 (USD Million)
TABLE 69 U.S. Gastric Cancer Diagnostics Market, By Product Type, 2019-2028 (USD Million)
TABLE 70 U.S. Reagents & Consumables in Gastric Cancer Diagnostics Market, By Product Type, 2019-2028 (USD Million)
TABLE 71 U.S. Kits in Gastric Cancer Diagnostics Market, By Product Type, 2019-2028 (USD Million)
TABLE 72 U.S. Reagents in Gastric Cancer Diagnostics Market, By Product Type, 2019-2028 (USD Million)
TABLE 73 U.S. Gastric Cancer Diagnostics Market, By Diagnostic Type, 2019-2028 (USD Million)
TABLE 74 U.S. Confirmatory tests in Gastric Cancer Diagnostics Market, By Diagnostic Type, 2019-2028 (USD Million)
TABLE 75 U.S. Imaging Tests in Gastric Cancer Diagnostics Market, By Diagnostic Type, 2019-2028 (USD Million)
TABLE 76 U.S. Biomarker in Gastric Cancer Diagnostics Market, By Diagnostic Type, 2019-2028 (USD Million)
TABLE 77 U.S. Gastric Cancer Diagnostics Market, By Age Group, 2019-2028 (USD Million)
TABLE 78 U.S. Gastric Cancer Diagnostics Market, By Disease Type, 2019-2028 (USD Million)
TABLE 79 U.S. Gastric Cancer Diagnostics Market, By Stage, 2019-2028 (USD Million)
TABLE 80 U.S. Stage I in Gastric Cancer Diagnostics Market, By Stage, 2019-2028 (USD Million)
TABLE 81 U.S. Stage II in Gastric Cancer Diagnostics Market, By Stage, 2019-2028 (USD Million)
TABLE 82 U.S. Stage III in Gastric Cancer Diagnostics Market, By Stage, 2019-2028 (USD Million)
TABLE 83 U.S. Gastric Cancer Diagnostics Market, By Gender, 2019-2028 (USD Million)
TABLE 84 U.S. Gastric Cancer Diagnostics Market, By Sample Type, 2019-2028 (USD Million)
TABLE 85 U.S. Gastric Cancer Diagnostics Market, By End User, 2019-2028 (USD Million)
TABLE 86 U.S. Gastric Cancer Diagnostics Market, By Distribution CHannel, 2019-2028 (USD Million)
TABLE 87 Canada Gastric Cancer Diagnostics Market, By Product Type, 2019-2028 (USD Million)
TABLE 88 Canada Reagents & Consumables in Gastric Cancer Diagnostics Market, By Product Type, 2019-2028 (USD Million)
TABLE 89 Canada Kits in Gastric Cancer Diagnostics Market, By Product Type, 2019-2028 (USD Million)
TABLE 90 Canada Reagents in Gastric Cancer Diagnostics Market, By Product Type, 2019-2028 (USD Million)
TABLE 91 Canada Gastric Cancer Diagnostics Market, By Diagnostic Type, 2019-2028 (USD Million)
TABLE 92 Canada Confirmatory tests in Gastric Cancer Diagnostics Market, By Diagnostic Type, 2019-2028 (USD Million)
TABLE 93 Canada Imaging Tests in Gastric Cancer Diagnostics Market, By Diagnostic Type, 2019-2028 (USD Million)
TABLE 94 Canada Biomarker in Gastric Cancer Diagnostics Market, By Diagnostic Type, 2019-2028 (USD Million)
TABLE 95 Canada Gastric Cancer Diagnostics Market, By Age Group, 2019-2028 (USD Million)
TABLE 96 Canada Gastric Cancer Diagnostics Market, By Disease Type, 2019-2028 (USD Million)
TABLE 97 Canada Gastric Cancer Diagnostics Market, By Stage, 2019-2028 (USD Million)
TABLE 98 Canada Stage I in Gastric Cancer Diagnostics Market, By Stage, 2019-2028 (USD Million)
TABLE 99 Canada Stage II in Gastric Cancer Diagnostics Market, By Stage, 2019-2028 (USD Million)
TABLE 100 Canada Stage III in Gastric Cancer Diagnostics Market, By Stage, 2019-2028 (USD Million)
TABLE 101 Canada Gastric Cancer Diagnostics Market, By Gender, 2019-2028 (USD Million)
TABLE 102 Canada Gastric Cancer Diagnostics Market, By Sample Type, 2019-2028 (USD Million)
TABLE 103 Canada Gastric Cancer Diagnostics Market, By End User, 2019-2028 (USD Million)
TABLE 104 Canada Gastric Cancer Diagnostics Market, By Distribution CHannel, 2019-2028 (USD Million)
TABLE 105 Mexico Gastric Cancer Diagnostics Market, By Product Type, 2019-2028 (USD Million)
TABLE 106 Mexico Reagents & Consumables in Gastric Cancer Diagnostics Market, By Product Type, 2019-2028 (USD Million)
TABLE 107 Mexico Kits in Gastric Cancer Diagnostics Market, By Product Type, 2019-2028 (USD Million)
TABLE 108 Mexico Reagents in Gastric Cancer Diagnostics Market, By Product Type, 2019-2028 (USD Million)
TABLE 109 Mexico Gastric Cancer Diagnostics Market, By Diagnostic Type, 2019-2028 (USD Million)
TABLE 110 Mexico Confirmatory tests in Gastric Cancer Diagnostics Market, By Diagnostic Type, 2019-2028 (USD Million)
TABLE 111 Mexico Imaging Tests in Gastric Cancer Diagnostics Market, By Diagnostic Type, 2019-2028 (USD Million)
TABLE 112 Mexico Biomarker in Gastric Cancer Diagnostics Market, By Diagnostic Type, 2019-2028 (USD Million)
TABLE 113 Mexico Gastric Cancer Diagnostics Market, By Age Group, 2019-2028 (USD Million)
TABLE 114 Mexico Gastric Cancer Diagnostics Market, By Disease Type, 2019-2028 (USD Million)
TABLE 115 Mexico Gastric Cancer Diagnostics Market, By Stage, 2019-2028 (USD Million)
TABLE 116 Mexico Stage I in Gastric Cancer Diagnostics Market, By Stage, 2019-2028 (USD Million)
TABLE 117 Mexico Stage II in Gastric Cancer Diagnostics Market, By Stage, 2019-2028 (USD Million)
TABLE 118 Mexico Stage III in Gastric Cancer Diagnostics Market, By Stage, 2019-2028 (USD Million)
TABLE 119 Mexico Gastric Cancer Diagnostics Market, By Gender, 2019-2028 (USD Million)
TABLE 120 Mexico Gastric Cancer Diagnostics Market, By Sample Type, 2019-2028 (USD Million)
TABLE 121 Mexico Gastric Cancer Diagnostics Market, By End User, 2019-2028 (USD Million)
TABLE 122 Mexico Gastric Cancer Diagnostics Market, By Distribution CHannel, 2019-2028 (USD Million)
TABLE 123 EUROPE Gastric Cancer Diagnostics Market, By COUNTRY, 2019-2028 (USD Million)
TABLE 124 Europe Gastric Cancer Diagnostics Market, By Product Type, 2019-2028 (USD Million)
TABLE 125 Europe Reagents & Consumables in Gastric Cancer Diagnostics Market, By Product Type, 2019-2028 (USD Million)
TABLE 126 Europe Kits in Gastric Cancer Diagnostics Market, By Product Type, 2019-2028 (USD Million)
TABLE 127 Europe Reagents in Gastric Cancer Diagnostics Market, By Product Type, 2019-2028 (USD Million)
TABLE 128 Europe Gastric Cancer Diagnostics Market, By Diagnostic Type, 2019-2028 (USD Million)
TABLE 129 Europe Confirmatory tests in Gastric Cancer Diagnostics Market, By Diagnostic Type, 2019-2028 (USD Million)
TABLE 130 Europe Imaging Tests in Gastric Cancer Diagnostics Market, By Diagnostic Type, 2019-2028 (USD Million)
TABLE 131 Europe Biomarker in Gastric Cancer Diagnostics Market, By Diagnostic Type, 2019-2028 (USD Million)
TABLE 132 Europe Gastric Cancer Diagnostics Market, By Age Group, 2019-2028 (USD Million)
TABLE 133 Europe Gastric Cancer Diagnostics Market, By Disease Type, 2019-2028 (USD Million)
TABLE 134 Europe Gastric Cancer Diagnostics Market, By Stage, 2019-2028 (USD Million)
TABLE 135 Europe Stage I in Gastric Cancer Diagnostics Market, By Stage, 2019-2028 (USD Million)
TABLE 136 Europe Stage II in Gastric Cancer Diagnostics Market, By Stage, 2019-2028 (USD Million)
TABLE 137 Europe Stage III in Gastric Cancer Diagnostics Market, By Stage, 2019-2028 (USD Million)
TABLE 138 Europe Gastric Cancer Diagnostics Market, By Gender, 2019-2028 (USD Million)
TABLE 139 Europe Gastric Cancer Diagnostics Market, By Sample Type, 2019-2028 (USD Million)
TABLE 140 Europe Gastric Cancer Diagnostics Market, By End User, 2019-2028 (USD Million)
TABLE 141 Europe Gastric Cancer Diagnostics Market, By Distribution CHannel, 2019-2028 (USD Million)
TABLE 142 Germany Gastric Cancer Diagnostics Market, By Product Type, 2019-2028 (USD Million)
TABLE 143 Germany Reagents & Consumables in Gastric Cancer Diagnostics Market, By Product Type, 2019-2028 (USD Million)
TABLE 144 Germany Kits in Gastric Cancer Diagnostics Market, By Product Type, 2019-2028 (USD Million)
TABLE 145 Germany Reagents in Gastric Cancer Diagnostics Market, By Product Type, 2019-2028 (USD Million)
TABLE 146 Germany Gastric Cancer Diagnostics Market, By Diagnostic Type, 2019-2028 (USD Million)
TABLE 147 Germany Confirmatory tests in Gastric Cancer Diagnostics Market, By Diagnostic Type, 2019-2028 (USD Million)
TABLE 148 Germany Imaging Tests in Gastric Cancer Diagnostics Market, By Diagnostic Type, 2019-2028 (USD Million)
TABLE 149 Germany Biomarker in Gastric Cancer Diagnostics Market, By Diagnostic Type, 2019-2028 (USD Million)
TABLE 150 Germany Gastric Cancer Diagnostics Market, By Age Group, 2019-2028 (USD Million)
TABLE 151 Germany Gastric Cancer Diagnostics Market, By Disease Type, 2019-2028 (USD Million)
TABLE 152 Germany Gastric Cancer Diagnostics Market, By Stage, 2019-2028 (USD Million)
TABLE 153 Germany Stage I in Gastric Cancer Diagnostics Market, By Stage, 2019-2028 (USD Million)
TABLE 154 Germany Stage II in Gastric Cancer Diagnostics Market, By Stage, 2019-2028 (USD Million)
TABLE 155 Germany Stage III in Gastric Cancer Diagnostics Market, By Stage, 2019-2028 (USD Million)
TABLE 156 Germany Gastric Cancer Diagnostics Market, By Gender, 2019-2028 (USD Million)
TABLE 157 Germany Gastric Cancer Diagnostics Market, By Sample Type, 2019-2028 (USD Million)
TABLE 158 Germany Gastric Cancer Diagnostics Market, By End User, 2019-2028 (USD Million)
TABLE 159 Germany Gastric Cancer Diagnostics Market, By Distribution CHannel, 2019-2028 (USD Million)
TABLE 160 France Gastric Cancer Diagnostics Market, By Product Type, 2019-2028 (USD Million)
TABLE 161 France Reagents & Consumables in Gastric Cancer Diagnostics Market, By Product Type, 2019-2028 (USD Million)
TABLE 162 France Kits in Gastric Cancer Diagnostics Market, By Product Type, 2019-2028 (USD Million)
TABLE 163 France Reagents in Gastric Cancer Diagnostics Market, By Product Type, 2019-2028 (USD Million)
TABLE 164 France Gastric Cancer Diagnostics Market, By Diagnostic Type, 2019-2028 (USD Million)
TABLE 165 France Confirmatory tests in Gastric Cancer Diagnostics Market, By Diagnostic Type, 2019-2028 (USD Million)
TABLE 166 France Imaging Tests in Gastric Cancer Diagnostics Market, By Diagnostic Type, 2019-2028 (USD Million)
TABLE 167 France Biomarker in Gastric Cancer Diagnostics Market, By Diagnostic Type, 2019-2028 (USD Million)
TABLE 168 France Gastric Cancer Diagnostics Market, By Age Group, 2019-2028 (USD Million)
TABLE 169 France Gastric Cancer Diagnostics Market, By Disease Type, 2019-2028 (USD Million)
TABLE 170 France Gastric Cancer Diagnostics Market, By Stage, 2019-2028 (USD Million)
TABLE 171 France Stage I in Gastric Cancer Diagnostics Market, By Stage, 2019-2028 (USD Million)
TABLE 172 France Stage II in Gastric Cancer Diagnostics Market, By Stage, 2019-2028 (USD Million)
TABLE 173 France Stage III in Gastric Cancer Diagnostics Market, By Stage, 2019-2028 (USD Million)
TABLE 174 France Gastric Cancer Diagnostics Market, By Gender, 2019-2028 (USD Million)
TABLE 175 France Gastric Cancer Diagnostics Market, By Sample Type, 2019-2028 (USD Million)
TABLE 176 France Gastric Cancer Diagnostics Market, By End User, 2019-2028 (USD Million)
TABLE 177 France Gastric Cancer Diagnostics Market, By Distribution CHannel, 2019-2028 (USD Million)
TABLE 178 U.K. Gastric Cancer Diagnostics Market, By Product Type, 2019-2028 (USD Million)
TABLE 179 U.K. Reagents & Consumables in Gastric Cancer Diagnostics Market, By Product Type, 2019-2028 (USD Million)
TABLE 180 U.K. Kits in Gastric Cancer Diagnostics Market, By Product Type, 2019-2028 (USD Million)
TABLE 181 U.K. Reagents in Gastric Cancer Diagnostics Market, By Product Type, 2019-2028 (USD Million)
TABLE 182 U.K. Gastric Cancer Diagnostics Market, By Diagnostic Type, 2019-2028 (USD Million)
TABLE 183 U.K. Confirmatory tests in Gastric Cancer Diagnostics Market, By Diagnostic Type, 2019-2028 (USD Million)
TABLE 184 U.K. Imaging Tests in Gastric Cancer Diagnostics Market, By Diagnostic Type, 2019-2028 (USD Million)
TABLE 185 U.K. Biomarker in Gastric Cancer Diagnostics Market, By Diagnostic Type, 2019-2028 (USD Million)
TABLE 186 U.K. Gastric Cancer Diagnostics Market, By Age Group, 2019-2028 (USD Million)
TABLE 187 U.K. Gastric Cancer Diagnostics Market, By Disease Type, 2019-2028 (USD Million)
TABLE 188 U.K. Gastric Cancer Diagnostics Market, By Stage, 2019-2028 (USD Million)
TABLE 189 U.K. Stage I in Gastric Cancer Diagnostics Market, By Stage, 2019-2028 (USD Million)
TABLE 190 U.K. Stage II in Gastric Cancer Diagnostics Market, By Stage, 2019-2028 (USD Million)
TABLE 191 U.K. Stage III in Gastric Cancer Diagnostics Market, By Stage, 2019-2028 (USD Million)
TABLE 192 U.K. Gastric Cancer Diagnostics Market, By Gender, 2019-2028 (USD Million)
TABLE 193 U.K. Gastric Cancer Diagnostics Market, By Sample Type, 2019-2028 (USD Million)
TABLE 194 U.K. Gastric Cancer Diagnostics Market, By End User, 2019-2028 (USD Million)
TABLE 195 U.K. Gastric Cancer Diagnostics Market, By Distribution CHannel, 2019-2028 (USD Million)
TABLE 196 Russia Gastric Cancer Diagnostics Market, By Product Type, 2019-2028 (USD Million)
TABLE 197 Russia Reagents & Consumables in Gastric Cancer Diagnostics Market, By Product Type, 2019-2028 (USD Million)
TABLE 198 Russia Kits in Gastric Cancer Diagnostics Market, By Product Type, 2019-2028 (USD Million)
TABLE 199 Russia Reagents in Gastric Cancer Diagnostics Market, By Product Type, 2019-2028 (USD Million)
TABLE 200 Russia Gastric Cancer Diagnostics Market, By Diagnostic Type, 2019-2028 (USD Million)
TABLE 201 Russia Confirmatory tests in Gastric Cancer Diagnostics Market, By Diagnostic Type, 2019-2028 (USD Million)
TABLE 202 Russia Imaging Tests in Gastric Cancer Diagnostics Market, By Diagnostic Type, 2019-2028 (USD Million)
TABLE 203 Russia Biomarker in Gastric Cancer Diagnostics Market, By Diagnostic Type, 2019-2028 (USD Million)
TABLE 204 Russia Gastric Cancer Diagnostics Market, By Age Group, 2019-2028 (USD Million)
TABLE 205 Russia Gastric Cancer Diagnostics Market, By Disease Type, 2019-2028 (USD Million)
TABLE 206 Russia Gastric Cancer Diagnostics Market, By Stage, 2019-2028 (USD Million)
TABLE 207 Russia Stage I in Gastric Cancer Diagnostics Market, By Stage, 2019-2028 (USD Million)
TABLE 208 Russia Stage II in Gastric Cancer Diagnostics Market, By Stage, 2019-2028 (USD Million)
TABLE 209 Russia Stage III in Gastric Cancer Diagnostics Market, By Stage, 2019-2028 (USD Million)
TABLE 210 Russia Gastric Cancer Diagnostics Market, By Gender, 2019-2028 (USD Million)
TABLE 211 Russia Gastric Cancer Diagnostics Market, By Sample Type, 2019-2028 (USD Million)
TABLE 212 Russia Gastric Cancer Diagnostics Market, By End User, 2019-2028 (USD Million)
TABLE 213 Russia Gastric Cancer Diagnostics Market, By Distribution CHannel, 2019-2028 (USD Million)
TABLE 214 Italy Gastric Cancer Diagnostics Market, By Product Type, 2019-2028 (USD Million)
TABLE 215 Italy Reagents & Consumables in Gastric Cancer Diagnostics Market, By Product Type, 2019-2028 (USD Million)
TABLE 216 Italy Kits in Gastric Cancer Diagnostics Market, By Product Type, 2019-2028 (USD Million)
TABLE 217 Italy Reagents in Gastric Cancer Diagnostics Market, By Product Type, 2019-2028 (USD Million)
TABLE 218 Italy Gastric Cancer Diagnostics Market, By Diagnostic Type, 2019-2028 (USD Million)
TABLE 219 Italy Confirmatory tests in Gastric Cancer Diagnostics Market, By Diagnostic Type, 2019-2028 (USD Million)
TABLE 220 Italy Imaging Tests in Gastric Cancer Diagnostics Market, By Diagnostic Type, 2019-2028 (USD Million)
TABLE 221 Italy Biomarker in Gastric Cancer Diagnostics Market, By Diagnostic Type, 2019-2028 (USD Million)
TABLE 222 Italy Gastric Cancer Diagnostics Market, By Age Group, 2019-2028 (USD Million)
TABLE 223 Italy Gastric Cancer Diagnostics Market, By Disease Type, 2019-2028 (USD Million)
TABLE 224 Italy Gastric Cancer Diagnostics Market, By Stage, 2019-2028 (USD Million)
TABLE 225 Italy Stage I in Gastric Cancer Diagnostics Market, By Stage, 2019-2028 (USD Million)
TABLE 226 Italy Stage II in Gastric Cancer Diagnostics Market, By Stage, 2019-2028 (USD Million)
TABLE 227 Italy Stage III in Gastric Cancer Diagnostics Market, By Stage, 2019-2028 (USD Million)
TABLE 228 Italy Gastric Cancer Diagnostics Market, By Gender, 2019-2028 (USD Million)
TABLE 229 Italy Gastric Cancer Diagnostics Market, By Sample Type, 2019-2028 (USD Million)
TABLE 230 Italy Gastric Cancer Diagnostics Market, By End User, 2019-2028 (USD Million)
TABLE 231 Italy Gastric Cancer Diagnostics Market, By Distribution CHannel, 2019-2028 (USD Million)
TABLE 232 Spain Gastric Cancer Diagnostics Market, By Product Type, 2019-2028 (USD Million)
TABLE 233 Spain Reagents & Consumables in Gastric Cancer Diagnostics Market, By Product Type, 2019-2028 (USD Million)
TABLE 234 Spain Kits in Gastric Cancer Diagnostics Market, By Product Type, 2019-2028 (USD Million)
TABLE 235 Spain Reagents in Gastric Cancer Diagnostics Market, By Product Type, 2019-2028 (USD Million)
TABLE 236 Spain Gastric Cancer Diagnostics Market, By Diagnostic Type, 2019-2028 (USD Million)
TABLE 237 Spain Confirmatory tests in Gastric Cancer Diagnostics Market, By Diagnostic Type, 2019-2028 (USD Million)
TABLE 238 Spain Imaging Tests in Gastric Cancer Diagnostics Market, By Diagnostic Type, 2019-2028 (USD Million)
TABLE 239 Spain Biomarker in Gastric Cancer Diagnostics Market, By Diagnostic Type, 2019-2028 (USD Million)
TABLE 240 Spain Gastric Cancer Diagnostics Market, By Age Group, 2019-2028 (USD Million)
TABLE 241 Spain Gastric Cancer Diagnostics Market, By Disease Type, 2019-2028 (USD Million)
TABLE 242 Spain Gastric Cancer Diagnostics Market, By Stage, 2019-2028 (USD Million)
TABLE 243 Spain Stage I in Gastric Cancer Diagnostics Market, By Stage, 2019-2028 (USD Million)
TABLE 244 Spain Stage II in Gastric Cancer Diagnostics Market, By Stage, 2019-2028 (USD Million)
TABLE 245 Spain Stage III in Gastric Cancer Diagnostics Market, By Stage, 2019-2028 (USD Million)
TABLE 246 Spain Gastric Cancer Diagnostics Market, By Gender, 2019-2028 (USD Million)
TABLE 247 Spain Gastric Cancer Diagnostics Market, By Sample Type, 2019-2028 (USD Million)
TABLE 248 Spain Gastric Cancer Diagnostics Market, By End User, 2019-2028 (USD Million)
TABLE 249 Spain Gastric Cancer Diagnostics Market, By Distribution CHannel, 2019-2028 (USD Million)
TABLE 250 Belgium Gastric Cancer Diagnostics Market, By Product Type, 2019-2028 (USD Million)
TABLE 251 Belgium Reagents & Consumables in Gastric Cancer Diagnostics Market, By Product Type, 2019-2028 (USD Million)
TABLE 252 Belgium Kits in Gastric Cancer Diagnostics Market, By Product Type, 2019-2028 (USD Million)
TABLE 253 Belgium Reagents in Gastric Cancer Diagnostics Market, By Product Type, 2019-2028 (USD Million)
TABLE 254 Belgium Gastric Cancer Diagnostics Market, By Diagnostic Type, 2019-2028 (USD Million)
TABLE 255 Belgium Confirmatory tests in Gastric Cancer Diagnostics Market, By Diagnostic Type, 2019-2028 (USD Million)
TABLE 256 Belgium Imaging Tests in Gastric Cancer Diagnostics Market, By Diagnostic Type, 2019-2028 (USD Million)
TABLE 257 Belgium Biomarker in Gastric Cancer Diagnostics Market, By Diagnostic Type, 2019-2028 (USD Million)
TABLE 258 Belgium Gastric Cancer Diagnostics Market, By Age Group, 2019-2028 (USD Million)
TABLE 259 Belgium Gastric Cancer Diagnostics Market, By Disease Type, 2019-2028 (USD Million)
TABLE 260 Belgium Gastric Cancer Diagnostics Market, By Stage, 2019-2028 (USD Million)
TABLE 261 Belgium Stage I in Gastric Cancer Diagnostics Market, By Stage, 2019-2028 (USD Million)
TABLE 262 Belgium Stage II in Gastric Cancer Diagnostics Market, By Stage, 2019-2028 (USD Million)
TABLE 263 Belgium Stage III in Gastric Cancer Diagnostics Market, By Stage, 2019-2028 (USD Million)
TABLE 264 Belgium Gastric Cancer Diagnostics Market, By Gender, 2019-2028 (USD Million)
TABLE 265 Belgium Gastric Cancer Diagnostics Market, By Sample Type, 2019-2028 (USD Million)
TABLE 266 Belgium Gastric Cancer Diagnostics Market, By End User, 2019-2028 (USD Million)
TABLE 267 Belgium Gastric Cancer Diagnostics Market, By Distribution CHannel, 2019-2028 (USD Million)
TABLE 268 Netherlands Gastric Cancer Diagnostics Market, By Product Type, 2019-2028 (USD Million)
TABLE 269 Netherlands Reagents & Consumables in Gastric Cancer Diagnostics Market, By Product Type, 2019-2028 (USD Million)
TABLE 270 Netherlands Kits in Gastric Cancer Diagnostics Market, By Product Type, 2019-2028 (USD Million)
TABLE 271 Netherlands Reagents in Gastric Cancer Diagnostics Market, By Product Type, 2019-2028 (USD Million)
TABLE 272 Netherlands Gastric Cancer Diagnostics Market, By Diagnostic Type, 2019-2028 (USD Million)
TABLE 273 Netherlands Confirmatory tests in Gastric Cancer Diagnostics Market, By Diagnostic Type, 2019-2028 (USD Million)
TABLE 274 Netherlands Imaging Tests in Gastric Cancer Diagnostics Market, By Diagnostic Type, 2019-2028 (USD Million)
TABLE 275 Netherlands Biomarker in Gastric Cancer Diagnostics Market, By Diagnostic Type, 2019-2028 (USD Million)
TABLE 276 Netherlands Gastric Cancer Diagnostics Market, By Age Group, 2019-2028 (USD Million)
TABLE 277 Netherlands Gastric Cancer Diagnostics Market, By Disease Type, 2019-2028 (USD Million)
TABLE 278 Netherlands Gastric Cancer Diagnostics Market, By Stage, 2019-2028 (USD Million)
TABLE 279 Netherlands Stage I in Gastric Cancer Diagnostics Market, By Stage, 2019-2028 (USD Million)
TABLE 280 Netherlands Stage II in Gastric Cancer Diagnostics Market, By Stage, 2019-2028 (USD Million)
TABLE 281 Netherlands Stage III in Gastric Cancer Diagnostics Market, By Stage, 2019-2028 (USD Million)
TABLE 282 Netherlands Gastric Cancer Diagnostics Market, By Gender, 2019-2028 (USD Million)
TABLE 283 Netherlands Gastric Cancer Diagnostics Market, By Sample Type, 2019-2028 (USD Million)
TABLE 284 Netherlands Gastric Cancer Diagnostics Market, By End User, 2019-2028 (USD Million)
TABLE 285 Netherlands Gastric Cancer Diagnostics Market, By Distribution CHannel, 2019-2028 (USD Million)
TABLE 286 Turkey Gastric Cancer Diagnostics Market, By Product Type, 2019-2028 (USD Million)
TABLE 287 Turkey Reagents & Consumables in Gastric Cancer Diagnostics Market, By Product Type, 2019-2028 (USD Million)
TABLE 288 Turkey Kits in Gastric Cancer Diagnostics Market, By Product Type, 2019-2028 (USD Million)
TABLE 289 Turkey Reagents in Gastric Cancer Diagnostics Market, By Product Type, 2019-2028 (USD Million)
TABLE 290 Turkey Gastric Cancer Diagnostics Market, By Diagnostic Type, 2019-2028 (USD Million)
TABLE 291 Turkey Confirmatory tests in Gastric Cancer Diagnostics Market, By Diagnostic Type, 2019-2028 (USD Million)
TABLE 292 Turkey Imaging Tests in Gastric Cancer Diagnostics Market, By Diagnostic Type, 2019-2028 (USD Million)
TABLE 293 Turkey Biomarker in Gastric Cancer Diagnostics Market, By Diagnostic Type, 2019-2028 (USD Million)
TABLE 294 Turkey Gastric Cancer Diagnostics Market, By Age Group, 2019-2028 (USD Million)
TABLE 295 Turkey Gastric Cancer Diagnostics Market, By Disease Type, 2019-2028 (USD Million)
TABLE 296 Turkey Gastric Cancer Diagnostics Market, By Stage, 2019-2028 (USD Million)
TABLE 297 Turkey Stage I in Gastric Cancer Diagnostics Market, By Stage, 2019-2028 (USD Million)
TABLE 298 Turkey Stage II in Gastric Cancer Diagnostics Market, By Stage, 2019-2028 (USD Million)
TABLE 299 Turkey Stage III in Gastric Cancer Diagnostics Market, By Stage, 2019-2028 (USD Million)
TABLE 300 Turkey Gastric Cancer Diagnostics Market, By Gender, 2019-2028 (USD Million)
TABLE 301 Turkey Gastric Cancer Diagnostics Market, By Sample Type, 2019-2028 (USD Million)
TABLE 302 Turkey Gastric Cancer Diagnostics Market, By End User, 2019-2028 (USD Million)
TABLE 303 Turkey Gastric Cancer Diagnostics Market, By Distribution CHannel, 2019-2028 (USD Million)
TABLE 304 Switzerland Gastric Cancer Diagnostics Market, By Product Type, 2019-2028 (USD Million)
TABLE 305 Switzerland Reagents & Consumables in Gastric Cancer Diagnostics Market, By Product Type, 2019-2028 (USD Million)
TABLE 306 Switzerland Kits in Gastric Cancer Diagnostics Market, By Product Type, 2019-2028 (USD Million)
TABLE 307 Switzerland Reagents in Gastric Cancer Diagnostics Market, By Product Type, 2019-2028 (USD Million)
TABLE 308 Switzerland Gastric Cancer Diagnostics Market, By Diagnostic Type, 2019-2028 (USD Million)
TABLE 309 Switzerland Confirmatory tests in Gastric Cancer Diagnostics Market, By Diagnostic Type, 2019-2028 (USD Million)
TABLE 310 Switzerland Imaging Tests in Gastric Cancer Diagnostics Market, By Diagnostic Type, 2019-2028 (USD Million)
TABLE 311 Switzerland Biomarker in Gastric Cancer Diagnostics Market, By Diagnostic Type, 2019-2028 (USD Million)
TABLE 312 Switzerland Gastric Cancer Diagnostics Market, By Age Group, 2019-2028 (USD Million)
TABLE 313 Switzerland Gastric Cancer Diagnostics Market, By Disease Type, 2019-2028 (USD Million)
TABLE 314 Switzerland Gastric Cancer Diagnostics Market, By Stage, 2019-2028 (USD Million)
TABLE 315 Switzerland Stage I in Gastric Cancer Diagnostics Market, By Stage, 2019-2028 (USD Million)
TABLE 316 Switzerland Stage II in Gastric Cancer Diagnostics Market, By Stage, 2019-2028 (USD Million)
TABLE 317 Switzerland Stage III in Gastric Cancer Diagnostics Market, By Stage, 2019-2028 (USD Million)
TABLE 318 Switzerland Gastric Cancer Diagnostics Market, By Gender, 2019-2028 (USD Million)
TABLE 319 Switzerland Gastric Cancer Diagnostics Market, By Sample Type, 2019-2028 (USD Million)
TABLE 320 Switzerland Gastric Cancer Diagnostics Market, By End User, 2019-2028 (USD Million)
TABLE 321 Switzerland Gastric Cancer Diagnostics Market, By Distribution CHannel, 2019-2028 (USD Million)
TABLE 322 Rest of Europe Gastric Cancer Diagnostics Market, By Product Type, 2019-2028 (USD Million)
TABLE 323 ASIA-PACIFIC Gastric Cancer Diagnostics Market, By COUNTRY, 2019-2028 (USD Million)
TABLE 324 Asia-Pacific Gastric Cancer Diagnostics Market, By Product Type, 2019-2028 (USD Million)
TABLE 325 Asia-Pacific Reagents & Consumables in Gastric Cancer Diagnostics Market, By Product Type, 2019-2028 (USD Million)
TABLE 326 Asia-Pacific Kits in Gastric Cancer Diagnostics Market, By Product Type, 2019-2028 (USD Million)
TABLE 327 Asia-Pacific Reagents in Gastric Cancer Diagnostics Market, By Product Type, 2019-2028 (USD Million)
TABLE 328 Asia-Pacific Gastric Cancer Diagnostics Market, By Diagnostic Type, 2019-2028 (USD Million)
TABLE 329 Asia-Pacific Confirmatory tests in Gastric Cancer Diagnostics Market, By Diagnostic Type, 2019-2028 (USD Million)
TABLE 330 Asia-Pacific Imaging Tests in Gastric Cancer Diagnostics Market, By Diagnostic Type, 2019-2028 (USD Million)
TABLE 331 Asia-Pacific Biomarker in Gastric Cancer Diagnostics Market, By Diagnostic Type, 2019-2028 (USD Million)
TABLE 332 Asia-Pacific Gastric Cancer Diagnostics Market, By Age Group, 2019-2028 (USD Million)
TABLE 333 Asia-Pacific Gastric Cancer Diagnostics Market, By Disease Type, 2019-2028 (USD Million)
TABLE 334 Asia-Pacific Gastric Cancer Diagnostics Market, By Stage, 2019-2028 (USD Million)
TABLE 335 Asia-Pacific Stage I in Gastric Cancer Diagnostics Market, By Stage, 2019-2028 (USD Million)
TABLE 336 Asia-Pacific Stage II in Gastric Cancer Diagnostics Market, By Stage, 2019-2028 (USD Million)
TABLE 337 Asia-Pacific Stage III in Gastric Cancer Diagnostics Market, By Stage, 2019-2028 (USD Million)
TABLE 338 Asia-Pacific Gastric Cancer Diagnostics Market, By Gender, 2019-2028 (USD Million)
TABLE 339 Asia-Pacific Gastric Cancer Diagnostics Market, By Sample Type, 2019-2028 (USD Million)
TABLE 340 Asia-Pacific Gastric Cancer Diagnostics Market, By End User, 2019-2028 (USD Million)
TABLE 341 Asia-Pacific Gastric Cancer Diagnostics Market, By Distribution CHannel, 2019-2028 (USD Million)
TABLE 342 SOUTH KOREA Gastric Cancer Diagnostics Market, By Product Type, 2019-2028 (USD Million)
TABLE 343 SOUTH KOREA Reagents & Consumables in Gastric Cancer Diagnostics Market, By Product Type, 2019-2028 (USD Million)
TABLE 344 SOUTH KOREA Kits in Gastric Cancer Diagnostics Market, By Product Type, 2019-2028 (USD Million)
TABLE 345 SOUTH KOREA Reagents in Gastric Cancer Diagnostics Market, By Product Type, 2019-2028 (USD Million)
TABLE 346 SOUTH KOREA Gastric Cancer Diagnostics Market, By Diagnostic Type, 2019-2028 (USD Million)
TABLE 347 SOUTH KOREA Confirmatory tests in Gastric Cancer Diagnostics Market, By Diagnostic Type, 2019-2028 (USD Million)
TABLE 348 SOUTH KOREA Imaging Tests in Gastric Cancer Diagnostics Market, By Diagnostic Type, 2019-2028 (USD Million)
TABLE 349 SOUTH KOREA Biomarker in Gastric Cancer Diagnostics Market, By Diagnostic Type, 2019-2028 (USD Million)
TABLE 350 SOUTH KOREA Gastric Cancer Diagnostics Market, By Age Group, 2019-2028 (USD Million)
TABLE 351 SOUTH KOREA Gastric Cancer Diagnostics Market, By Disease Type, 2019-2028 (USD Million)
TABLE 352 SOUTH KOREA Gastric Cancer Diagnostics Market, By Stage, 2019-2028 (USD Million)
TABLE 353 SOUTH KOREA Stage I in Gastric Cancer Diagnostics Market, By Stage, 2019-2028 (USD Million)
TABLE 354 SOUTH KOREA Stage II in Gastric Cancer Diagnostics Market, By Stage, 2019-2028 (USD Million)
TABLE 355 SOUTH KOREA Stage III in Gastric Cancer Diagnostics Market, By Stage, 2019-2028 (USD Million)
TABLE 356 SOUTH KOREA Gastric Cancer Diagnostics Market, By Gender, 2019-2028 (USD Million)
TABLE 357 SOUTH KOREA Gastric Cancer Diagnostics Market, By Sample Type, 2019-2028 (USD Million)
TABLE 358 SOUTH KOREA Gastric Cancer Diagnostics Market, By End User, 2019-2028 (USD Million)
TABLE 359 SOUTH KOREA Gastric Cancer Diagnostics Market, By Distribution CHannel, 2019-2028 (USD Million)
TABLE 360 JAPAN Gastric Cancer Diagnostics Market, By Product Type, 2019-2028 (USD Million)
TABLE 361 JAPAN Reagents & Consumables in Gastric Cancer Diagnostics Market, By Product Type, 2019-2028 (USD Million)
TABLE 362 JAPAN Kits in Gastric Cancer Diagnostics Market, By Product Type, 2019-2028 (USD Million)
TABLE 363 JAPAN Reagents in Gastric Cancer Diagnostics Market, By Product Type, 2019-2028 (USD Million)
TABLE 364 JAPAN Gastric Cancer Diagnostics Market, By Diagnostic Type, 2019-2028 (USD Million)
TABLE 365 JAPAN Confirmatory tests in Gastric Cancer Diagnostics Market, By Diagnostic Type, 2019-2028 (USD Million)
TABLE 366 JAPAN Imaging Tests in Gastric Cancer Diagnostics Market, By Diagnostic Type, 2019-2028 (USD Million)
TABLE 367 JAPAN Biomarker in Gastric Cancer Diagnostics Market, By Diagnostic Type, 2019-2028 (USD Million)
TABLE 368 JAPAN Gastric Cancer Diagnostics Market, By Age Group, 2019-2028 (USD Million)
TABLE 369 JAPAN Gastric Cancer Diagnostics Market, By Disease Type, 2019-2028 (USD Million)
TABLE 370 JAPAN Gastric Cancer Diagnostics Market, By Stage, 2019-2028 (USD Million)
TABLE 371 JAPAN Stage I in Gastric Cancer Diagnostics Market, By Stage, 2019-2028 (USD Million)
TABLE 372 JAPAN Stage II in Gastric Cancer Diagnostics Market, By Stage, 2019-2028 (USD Million)
TABLE 373 JAPAN Stage III in Gastric Cancer Diagnostics Market, By Stage, 2019-2028 (USD Million)
TABLE 374 JAPAN Gastric Cancer Diagnostics Market, By Gender, 2019-2028 (USD Million)
TABLE 375 JAPAN Gastric Cancer Diagnostics Market, By Sample Type, 2019-2028 (USD Million)
TABLE 376 JAPAN Gastric Cancer Diagnostics Market, By End User, 2019-2028 (USD Million)
TABLE 377 JAPAN Gastric Cancer Diagnostics Market, By Distribution CHannel, 2019-2028 (USD Million)
TABLE 378 CHINA Gastric Cancer Diagnostics Market, By Product Type, 2019-2028 (USD Million)
TABLE 379 CHINA Reagents & Consumables in Gastric Cancer Diagnostics Market, By Product Type, 2019-2028 (USD Million)
TABLE 380 CHINA Kits in Gastric Cancer Diagnostics Market, By Product Type, 2019-2028 (USD Million)
TABLE 381 CHINA Reagents in Gastric Cancer Diagnostics Market, By Product Type, 2019-2028 (USD Million)
TABLE 382 CHINA Gastric Cancer Diagnostics Market, By Diagnostic Type, 2019-2028 (USD Million)
TABLE 383 CHINA Confirmatory tests in Gastric Cancer Diagnostics Market, By Diagnostic Type, 2019-2028 (USD Million)
TABLE 384 CHINA Imaging Tests in Gastric Cancer Diagnostics Market, By Diagnostic Type, 2019-2028 (USD Million)
TABLE 385 CHINA Biomarker in Gastric Cancer Diagnostics Market, By Diagnostic Type, 2019-2028 (USD Million)
TABLE 386 CHINA Gastric Cancer Diagnostics Market, By Age Group, 2019-2028 (USD Million)
TABLE 387 CHINA Gastric Cancer Diagnostics Market, By Disease Type, 2019-2028 (USD Million)
TABLE 388 CHINA Gastric Cancer Diagnostics Market, By Stage, 2019-2028 (USD Million)
TABLE 389 CHINA Stage I in Gastric Cancer Diagnostics Market, By Stage, 2019-2028 (USD Million)
TABLE 390 CHINA Stage II in Gastric Cancer Diagnostics Market, By Stage, 2019-2028 (USD Million)
TABLE 391 CHINA Stage III in Gastric Cancer Diagnostics Market, By Stage, 2019-2028 (USD Million)
TABLE 392 CHINA Gastric Cancer Diagnostics Market, By Gender, 2019-2028 (USD Million)
TABLE 393 CHINA Gastric Cancer Diagnostics Market, By Sample Type, 2019-2028 (USD Million)
TABLE 394 CHINA Gastric Cancer Diagnostics Market, By End User, 2019-2028 (USD Million)
TABLE 395 CHINA Gastric Cancer Diagnostics Market, By Distribution CHannel, 2019-2028 (USD Million)
TABLE 396 Australia Gastric Cancer Diagnostics Market, By Product Type, 2019-2028 (USD Million)
TABLE 397 Australia Reagents & Consumables in Gastric Cancer Diagnostics Market, By Product Type, 2019-2028 (USD Million)
TABLE 398 Australia Kits in Gastric Cancer Diagnostics Market, By Product Type, 2019-2028 (USD Million)
TABLE 399 Australia Reagents in Gastric Cancer Diagnostics Market, By Product Type, 2019-2028 (USD Million)
TABLE 400 Australia Gastric Cancer Diagnostics Market, By Diagnostic Type, 2019-2028 (USD Million)
TABLE 401 Australia Confirmatory tests in Gastric Cancer Diagnostics Market, By Diagnostic Type, 2019-2028 (USD Million)
TABLE 402 Australia Imaging Tests in Gastric Cancer Diagnostics Market, By Diagnostic Type, 2019-2028 (USD Million)
TABLE 403 Australia Biomarker in Gastric Cancer Diagnostics Market, By Diagnostic Type, 2019-2028 (USD Million)
TABLE 404 Australia Gastric Cancer Diagnostics Market, By Age Group, 2019-2028 (USD Million)
TABLE 405 Australia Gastric Cancer Diagnostics Market, By Disease Type, 2019-2028 (USD Million)
TABLE 406 Australia Gastric Cancer Diagnostics Market, By Stage, 2019-2028 (USD Million)
TABLE 407 Australia Stage I in Gastric Cancer Diagnostics Market, By Stage, 2019-2028 (USD Million)
TABLE 408 Australia Stage II in Gastric Cancer Diagnostics Market, By Stage, 2019-2028 (USD Million)
TABLE 409 Australia Stage III in Gastric Cancer Diagnostics Market, By Stage, 2019-2028 (USD Million)
TABLE 410 Australia Gastric Cancer Diagnostics Market, By Gender, 2019-2028 (USD Million)
TABLE 411 Australia Gastric Cancer Diagnostics Market, By Sample Type, 2019-2028 (USD Million)
TABLE 412 Australia Gastric Cancer Diagnostics Market, By End User, 2019-2028 (USD Million)
TABLE 413 Australia Gastric Cancer Diagnostics Market, By Distribution CHannel, 2019-2028 (USD Million)
TABLE 414 Singapore Gastric Cancer Diagnostics Market, By Product Type, 2019-2028 (USD Million)
TABLE 415 Singapore Reagents & Consumables in Gastric Cancer Diagnostics Market, By Product Type, 2019-2028 (USD Million)
TABLE 416 Singapore Kits in Gastric Cancer Diagnostics Market, By Product Type, 2019-2028 (USD Million)
TABLE 417 Singapore Reagents in Gastric Cancer Diagnostics Market, By Product Type, 2019-2028 (USD Million)
TABLE 418 Singapore Gastric Cancer Diagnostics Market, By Diagnostic Type, 2019-2028 (USD Million)
TABLE 419 Singapore Confirmatory tests in Gastric Cancer Diagnostics Market, By Diagnostic Type, 2019-2028 (USD Million)
TABLE 420 Singapore Imaging Tests in Gastric Cancer Diagnostics Market, By Diagnostic Type, 2019-2028 (USD Million)
TABLE 421 Singapore Biomarker in Gastric Cancer Diagnostics Market, By Diagnostic Type, 2019-2028 (USD Million)
TABLE 422 Singapore Gastric Cancer Diagnostics Market, By Age Group, 2019-2028 (USD Million)
TABLE 423 Singapore Gastric Cancer Diagnostics Market, By Disease Type, 2019-2028 (USD Million)
TABLE 424 Singapore Gastric Cancer Diagnostics Market, By Stage, 2019-2028 (USD Million)
TABLE 425 Singapore Stage I in Gastric Cancer Diagnostics Market, By Stage, 2019-2028 (USD Million)
TABLE 426 Singapore Stage II in Gastric Cancer Diagnostics Market, By Stage, 2019-2028 (USD Million)
TABLE 427 Singapore Stage III in Gastric Cancer Diagnostics Market, By Stage, 2019-2028 (USD Million)
TABLE 428 Singapore Gastric Cancer Diagnostics Market, By Gender, 2019-2028 (USD Million)
TABLE 429 Singapore Gastric Cancer Diagnostics Market, By Sample Type, 2019-2028 (USD Million)
TABLE 430 Singapore Gastric Cancer Diagnostics Market, By End User, 2019-2028 (USD Million)
TABLE 431 Singapore Gastric Cancer Diagnostics Market, By Distribution CHannel, 2019-2028 (USD Million)
TABLE 432 india Gastric Cancer Diagnostics Market, By Product Type, 2019-2028 (USD Million)
TABLE 433 India Reagents & Consumables in Gastric Cancer Diagnostics Market, By Product Type, 2019-2028 (USD Million)
TABLE 434 India Kits in Gastric Cancer Diagnostics Market, By Product Type, 2019-2028 (USD Million)
TABLE 435 India Reagents in Gastric Cancer Diagnostics Market, By Product Type, 2019-2028 (USD Million)
TABLE 436 India Gastric Cancer Diagnostics Market, By Diagnostic Type, 2019-2028 (USD Million)
TABLE 437 India Confirmatory tests in Gastric Cancer Diagnostics Market, By Diagnostic Type, 2019-2028 (USD Million)
TABLE 438 India Imaging Tests in Gastric Cancer Diagnostics Market, By Diagnostic Type, 2019-2028 (USD Million)
TABLE 439 India Biomarker in Gastric Cancer Diagnostics Market, By Diagnostic Type, 2019-2028 (USD Million)
TABLE 440 India Gastric Cancer Diagnostics Market, By Age Group, 2019-2028 (USD Million)
TABLE 441 India Gastric Cancer Diagnostics Market, By Disease Type, 2019-2028 (USD Million)
TABLE 442 India Gastric Cancer Diagnostics Market, By Stage, 2019-2028 (USD Million)
TABLE 443 India Stage I in Gastric Cancer Diagnostics Market, By Stage, 2019-2028 (USD Million)
TABLE 444 India Stage II in Gastric Cancer Diagnostics Market, By Stage, 2019-2028 (USD Million)
TABLE 445 India Stage III in Gastric Cancer Diagnostics Market, By Stage, 2019-2028 (USD Million)
TABLE 446 India Gastric Cancer Diagnostics Market, By Gender, 2019-2028 (USD Million)
TABLE 447 India Gastric Cancer Diagnostics Market, By Sample Type, 2019-2028 (USD Million)
TABLE 448 India Gastric Cancer Diagnostics Market, By End User, 2019-2028 (USD Million)
TABLE 449 India Gastric Cancer Diagnostics Market, By Distribution CHannel, 2019-2028 (USD Million)
TABLE 450 THAILAND Gastric Cancer Diagnostics Market, By Product Type, 2019-2028 (USD Million)
TABLE 451 THAILAND Reagents & Consumables in Gastric Cancer Diagnostics Market, By Product Type, 2019-2028 (USD Million)
TABLE 452 THAILAND Kits in Gastric Cancer Diagnostics Market, By Product Type, 2019-2028 (USD Million)
TABLE 453 THAILAND Reagents in Gastric Cancer Diagnostics Market, By Product Type, 2019-2028 (USD Million)
TABLE 454 THAILAND Gastric Cancer Diagnostics Market, By Diagnostic Type, 2019-2028 (USD Million)
TABLE 455 THAILAND Confirmatory tests in Gastric Cancer Diagnostics Market, By Diagnostic Type, 2019-2028 (USD Million)
TABLE 456 THAILAND Imaging Tests in Gastric Cancer Diagnostics Market, By Diagnostic Type, 2019-2028 (USD Million)
TABLE 457 THAILAND Biomarker in Gastric Cancer Diagnostics Market, By Diagnostic Type, 2019-2028 (USD Million)
TABLE 458 THAILAND Gastric Cancer Diagnostics Market, By Age Group, 2019-2028 (USD Million)
TABLE 459 THAILAND Gastric Cancer Diagnostics Market, By Disease Type, 2019-2028 (USD Million)
TABLE 460 THAILAND Gastric Cancer Diagnostics Market, By Stage, 2019-2028 (USD Million)
TABLE 461 THAILAND Stage I in Gastric Cancer Diagnostics Market, By Stage, 2019-2028 (USD Million)
TABLE 462 THAILAND Stage II in Gastric Cancer Diagnostics Market, By Stage, 2019-2028 (USD Million)
TABLE 463 THAILAND Stage III in Gastric Cancer Diagnostics Market, By Stage, 2019-2028 (USD Million)
TABLE 464 THAILAND Gastric Cancer Diagnostics Market, By Gender, 2019-2028 (USD Million)
TABLE 465 THAILAND Gastric Cancer Diagnostics Market, By Sample Type, 2019-2028 (USD Million)
TABLE 466 THAILAND Gastric Cancer Diagnostics Market, By End User, 2019-2028 (USD Million)
TABLE 467 THAILAND Gastric Cancer Diagnostics Market, By Distribution CHannel, 2019-2028 (USD Million)
TABLE 468 Malaysia Gastric Cancer Diagnostics Market, By Product Type, 2019-2028 (USD Million)
TABLE 469 Malaysia Reagents & Consumables in Gastric Cancer Diagnostics Market, By Product Type, 2019-2028 (USD Million)
TABLE 470 Malaysia Kits in Gastric Cancer Diagnostics Market, By Product Type, 2019-2028 (USD Million)
TABLE 471 Malaysia Reagents in Gastric Cancer Diagnostics Market, By Product Type, 2019-2028 (USD Million)
TABLE 472 Malaysia Gastric Cancer Diagnostics Market, By Diagnostic Type, 2019-2028 (USD Million)
TABLE 473 Malaysia Confirmatory tests in Gastric Cancer Diagnostics Market, By Diagnostic Type, 2019-2028 (USD Million)
TABLE 474 Malaysia Imaging Tests in Gastric Cancer Diagnostics Market, By Diagnostic Type, 2019-2028 (USD Million)
TABLE 475 Malaysia Biomarker in Gastric Cancer Diagnostics Market, By Diagnostic Type, 2019-2028 (USD Million)
TABLE 476 Malaysia Gastric Cancer Diagnostics Market, By Age Group, 2019-2028 (USD Million)
TABLE 477 Malaysia Gastric Cancer Diagnostics Market, By Disease Type, 2019-2028 (USD Million)
TABLE 478 Malaysia Gastric Cancer Diagnostics Market, By Stage, 2019-2028 (USD Million)
TABLE 479 Malaysia Stage I in Gastric Cancer Diagnostics Market, By Stage, 2019-2028 (USD Million)
TABLE 480 Malaysia Stage II in Gastric Cancer Diagnostics Market, By Stage, 2019-2028 (USD Million)
TABLE 481 Malaysia Stage III in Gastric Cancer Diagnostics Market, By Stage, 2019-2028 (USD Million)
TABLE 482 Malaysia Gastric Cancer Diagnostics Market, By Gender, 2019-2028 (USD Million)
TABLE 483 Malaysia Gastric Cancer Diagnostics Market, By Sample Type, 2019-2028 (USD Million)
TABLE 484 Malaysia Gastric Cancer Diagnostics Market, By End User, 2019-2028 (USD Million)
TABLE 485 Malaysia Gastric Cancer Diagnostics Market, By Distribution CHannel, 2019-2028 (USD Million)
TABLE 486 INDONESIA Gastric Cancer Diagnostics Market, By Product Type, 2019-2028 (USD Million)
TABLE 487 INDONESIA Reagents & Consumables in Gastric Cancer Diagnostics Market, By Product Type, 2019-2028 (USD Million)
TABLE 488 INDONESIA Kits in Gastric Cancer Diagnostics Market, By Product Type, 2019-2028 (USD Million)
TABLE 489 INDONESIA Reagents in Gastric Cancer Diagnostics Market, By Product Type, 2019-2028 (USD Million)
TABLE 490 INDONESIA Gastric Cancer Diagnostics Market, By Diagnostic Type, 2019-2028 (USD Million)
TABLE 491 INDONESIA Confirmatory tests in Gastric Cancer Diagnostics Market, By Diagnostic Type, 2019-2028 (USD Million)
TABLE 492 INDONESIA Imaging Tests in Gastric Cancer Diagnostics Market, By Diagnostic Type, 2019-2028 (USD Million)
TABLE 493 INDONESIA Biomarker in Gastric Cancer Diagnostics Market, By Diagnostic Type, 2019-2028 (USD Million)
TABLE 494 INDONESIA Gastric Cancer Diagnostics Market, By Age Group, 2019-2028 (USD Million)
TABLE 495 INDONESIA Gastric Cancer Diagnostics Market, By Disease Type, 2019-2028 (USD Million)
TABLE 496 INDONESIA Gastric Cancer Diagnostics Market, By Stage, 2019-2028 (USD Million)
TABLE 497 INDONESIA Stage I in Gastric Cancer Diagnostics Market, By Stage, 2019-2028 (USD Million)
TABLE 498 INDONESIA Stage II in Gastric Cancer Diagnostics Market, By Stage, 2019-2028 (USD Million)
TABLE 499 INDONESIA Stage III in Gastric Cancer Diagnostics Market, By Stage, 2019-2028 (USD Million)
TABLE 500 INDONESIA Gastric Cancer Diagnostics Market, By Gender, 2019-2028 (USD Million)
TABLE 501 INDONESIA Gastric Cancer Diagnostics Market, By Sample Type, 2019-2028 (USD Million)
TABLE 502 INDONESIA Gastric Cancer Diagnostics Market, By End User, 2019-2028 (USD Million)
TABLE 503 INDONESIA Gastric Cancer Diagnostics Market, By Distribution CHannel, 2019-2028 (USD Million)
TABLE 504 PHILIPPINES Gastric Cancer Diagnostics Market, By Product Type, 2019-2028 (USD Million)
TABLE 505 PHILIPPINES Reagents & Consumables in Gastric Cancer Diagnostics Market, By Product Type, 2019-2028 (USD Million)
TABLE 506 PHILIPPINES Kits in Gastric Cancer Diagnostics Market, By Product Type, 2019-2028 (USD Million)
TABLE 507 PHILIPPINES Reagents in Gastric Cancer Diagnostics Market, By Product Type, 2019-2028 (USD Million)
TABLE 508 PHILIPPINES Gastric Cancer Diagnostics Market, By Diagnostic Type, 2019-2028 (USD Million)
TABLE 509 PHILIPPINES Confirmatory tests in Gastric Cancer Diagnostics Market, By Diagnostic Type, 2019-2028 (USD Million)
TABLE 510 PHILIPPINES Imaging Tests in Gastric Cancer Diagnostics Market, By Diagnostic Type, 2019-2028 (USD Million)
TABLE 511 PHILIPPINES Biomarker in Gastric Cancer Diagnostics Market, By Diagnostic Type, 2019-2028 (USD Million)
TABLE 512 PHILIPPINES Gastric Cancer Diagnostics Market, By Age Group, 2019-2028 (USD Million)
TABLE 513 PHILIPPINES Gastric Cancer Diagnostics Market, By Disease Type, 2019-2028 (USD Million)
TABLE 514 PHILIPPINES Gastric Cancer Diagnostics Market, By Stage, 2019-2028 (USD Million)
TABLE 515 PHILIPPINES Stage I in Gastric Cancer Diagnostics Market, By Stage, 2019-2028 (USD Million)
TABLE 516 PHILIPPINES Stage II in Gastric Cancer Diagnostics Market, By Stage, 2019-2028 (USD Million)
TABLE 517 PHILIPPINES Stage III in Gastric Cancer Diagnostics Market, By Stage, 2019-2028 (USD Million)
TABLE 518 PHILIPPINES Gastric Cancer Diagnostics Market, By Gender, 2019-2028 (USD Million)
TABLE 519 PHILIPPINES Gastric Cancer Diagnostics Market, By Sample Type, 2019-2028 (USD Million)
TABLE 520 PHILIPPINES Gastric Cancer Diagnostics Market, By End User, 2019-2028 (USD Million)
TABLE 521 PHILIPPINES Gastric Cancer Diagnostics Market, By Distribution CHannel, 2019-2028 (USD Million)
TABLE 522 Rest of ASIA-PACIFIC Gastric Cancer Diagnostics Market, By Product Type, 2019-2028 (USD Million)
TABLE 523 SOUTH AMERICA Gastric Cancer Diagnostics Market, By COUNTRY 2019-2028 (USD Million)
TABLE 524 South America Gastric Cancer Diagnostics Market, By Product Type, 2019-2028 (USD Million)
TABLE 525 South America Reagents & Consumables in Gastric Cancer Diagnostics Market, By Product Type, 2019-2028 (USD Million)
TABLE 526 South America Kits in Gastric Cancer Diagnostics Market, By Product Type, 2019-2028 (USD Million)
TABLE 527 South America Reagents in Gastric Cancer Diagnostics Market, By Product Type, 2019-2028 (USD Million)
TABLE 528 South America Gastric Cancer Diagnostics Market, By Diagnostic Type, 2019-2028 (USD Million)
TABLE 529 South America Confirmatory tests in Gastric Cancer Diagnostics Market, By Diagnostic Type, 2019-2028 (USD Million)
TABLE 530 South America Imaging Tests in Gastric Cancer Diagnostics Market, By Diagnostic Type, 2019-2028 (USD Million)
TABLE 531 South America Biomarker in Gastric Cancer Diagnostics Market, By Diagnostic Type, 2019-2028 (USD Million)
TABLE 532 South America Gastric Cancer Diagnostics Market, By Age Group, 2019-2028 (USD Million)
TABLE 533 South America Gastric Cancer Diagnostics Market, By Disease Type, 2019-2028 (USD Million)
TABLE 534 South America Gastric Cancer Diagnostics Market, By Stage, 2019-2028 (USD Million)
TABLE 535 South America Stage I in Gastric Cancer Diagnostics Market, By Stage, 2019-2028 (USD Million)
TABLE 536 South America Stage II in Gastric Cancer Diagnostics Market, By Stage, 2019-2028 (USD Million)
TABLE 537 South America Stage III in Gastric Cancer Diagnostics Market, By Stage, 2019-2028 (USD Million)
TABLE 538 South America Gastric Cancer Diagnostics Market, By Gender, 2019-2028 (USD Million)
TABLE 539 South America Gastric Cancer Diagnostics Market, By Sample Type, 2019-2028 (USD Million)
TABLE 540 South America Gastric Cancer Diagnostics Market, By End User, 2019-2028 (USD Million)
TABLE 541 South America Gastric Cancer Diagnostics Market, By Distribution CHannel, 2019-2028 (USD Million)
TABLE 542 Brazil Gastric Cancer Diagnostics Market, By Product Type, 2019-2028 (USD Million)
TABLE 543 Brazil Reagents & Consumables in Gastric Cancer Diagnostics Market, By Product Type, 2019-2028 (USD Million)
TABLE 544 Brazil Kits in Gastric Cancer Diagnostics Market, By Product Type, 2019-2028 (USD Million)
TABLE 545 Brazil Reagents in Gastric Cancer Diagnostics Market, By Product Type, 2019-2028 (USD Million)
TABLE 546 Brazil Gastric Cancer Diagnostics Market, By Diagnostic Type, 2019-2028 (USD Million)
TABLE 547 Brazil Confirmatory tests in Gastric Cancer Diagnostics Market, By Diagnostic Type, 2019-2028 (USD Million)
TABLE 548 Brazil Imaging Tests in Gastric Cancer Diagnostics Market, By Diagnostic Type, 2019-2028 (USD Million)
TABLE 549 Brazil Biomarker in Gastric Cancer Diagnostics Market, By Diagnostic Type, 2019-2028 (USD Million)
TABLE 550 Brazil Gastric Cancer Diagnostics Market, By Age Group, 2019-2028 (USD Million)
TABLE 551 Brazil Gastric Cancer Diagnostics Market, By Disease Type, 2019-2028 (USD Million)
TABLE 552 Brazil Gastric Cancer Diagnostics Market, By Stage, 2019-2028 (USD Million)
TABLE 553 Brazil Stage I in Gastric Cancer Diagnostics Market, By Stage, 2019-2028 (USD Million)
TABLE 554 Brazil Stage II in Gastric Cancer Diagnostics Market, By Stage, 2019-2028 (USD Million)
TABLE 555 Brazil Stage III in Gastric Cancer Diagnostics Market, By Stage, 2019-2028 (USD Million)
TABLE 556 Brazil Gastric Cancer Diagnostics Market, By Gender, 2019-2028 (USD Million)
TABLE 557 Brazil Gastric Cancer Diagnostics Market, By Sample Type, 2019-2028 (USD Million)
TABLE 558 Brazil Gastric Cancer Diagnostics Market, By End User, 2019-2028 (USD Million)
TABLE 559 Brazil Gastric Cancer Diagnostics Market, By Distribution CHannel, 2019-2028 (USD Million)
TABLE 560 Argentina Gastric Cancer Diagnostics Market, By Product Type, 2019-2028 (USD Million)
TABLE 561 Argentina Reagents & Consumables in Gastric Cancer Diagnostics Market, By Product Type, 2019-2028 (USD Million)
TABLE 562 Argentina Kits in Gastric Cancer Diagnostics Market, By Product Type, 2019-2028 (USD Million)
TABLE 563 Argentina Reagents in Gastric Cancer Diagnostics Market, By Product Type, 2019-2028 (USD Million)
TABLE 564 Argentina Gastric Cancer Diagnostics Market, By Diagnostic Type, 2019-2028 (USD Million)
TABLE 565 Argentina Confirmatory tests in Gastric Cancer Diagnostics Market, By Diagnostic Type, 2019-2028 (USD Million)
TABLE 566 Argentina Imaging Tests in Gastric Cancer Diagnostics Market, By Diagnostic Type, 2019-2028 (USD Million)
TABLE 567 Argentina Biomarker in Gastric Cancer Diagnostics Market, By Diagnostic Type, 2019-2028 (USD Million)
TABLE 568 Argentina Gastric Cancer Diagnostics Market, By Age Group, 2019-2028 (USD Million)
TABLE 569 Argentina Gastric Cancer Diagnostics Market, By Disease Type, 2019-2028 (USD Million)
TABLE 570 Argentina Gastric Cancer Diagnostics Market, By Stage, 2019-2028 (USD Million)
TABLE 571 Argentina Stage I in Gastric Cancer Diagnostics Market, By Stage, 2019-2028 (USD Million)
TABLE 572 Argentina Stage II in Gastric Cancer Diagnostics Market, By Stage, 2019-2028 (USD Million)
TABLE 573 Argentina Stage III in Gastric Cancer Diagnostics Market, By Stage, 2019-2028 (USD Million)
TABLE 574 Argentina Gastric Cancer Diagnostics Market, By Gender, 2019-2028 (USD Million)
TABLE 575 Argentina Gastric Cancer Diagnostics Market, By Sample Type, 2019-2028 (USD Million)
TABLE 576 Argentina Gastric Cancer Diagnostics Market, By End User, 2019-2028 (USD Million)
TABLE 577 Argentina Gastric Cancer Diagnostics Market, By Distribution CHannel, 2019-2028 (USD Million)
TABLE 578 Rest of South America Gastric Cancer Diagnostics Market, By Product Type, 2019-2028 (USD Million)
TABLE 579 MIDDLE EAST AND AFRICA Gastric Cancer Diagnostics Market, By COUNTRY, 2019-2028 (USD Million)
TABLE 580 Middle East and Africa Gastric Cancer Diagnostics Market, By Product Type, 2019-2028 (USD Million)
TABLE 581 Middle East and Africa Reagents & Consumables in Gastric Cancer Diagnostics Market, By Product Type, 2019-2028 (USD Million)
TABLE 582 Middle East and Africa Kits in Gastric Cancer Diagnostics Market, By Product Type, 2019-2028 (USD Million)
TABLE 583 Middle East and Africa Reagents in Gastric Cancer Diagnostics Market, By Product Type, 2019-2028 (USD Million)
TABLE 584 Middle East and Africa Gastric Cancer Diagnostics Market, By Diagnostic Type, 2019-2028 (USD Million)
TABLE 585 Middle East and Africa Confirmatory tests in Gastric Cancer Diagnostics Market, By Diagnostic Type, 2019-2028 (USD Million)
TABLE 586 Middle East and Africa Imaging Tests in Gastric Cancer Diagnostics Market, By Diagnostic Type, 2019-2028 (USD Million)
TABLE 587 Middle East and Africa Biomarker in Gastric Cancer Diagnostics Market, By Diagnostic Type, 2019-2028 (USD Million)
TABLE 588 Middle East and Africa Gastric Cancer Diagnostics Market, By Age Group, 2019-2028 (USD Million)
TABLE 589 Middle East and Africa Gastric Cancer Diagnostics Market, By Disease Type, 2019-2028 (USD Million)
TABLE 590 Middle East and Africa Gastric Cancer Diagnostics Market, By Stage, 2019-2028 (USD Million)
TABLE 591 Middle East and Africa Stage I in Gastric Cancer Diagnostics Market, By Stage, 2019-2028 (USD Million)
TABLE 592 Middle East and Africa Stage II in Gastric Cancer Diagnostics Market, By Stage, 2019-2028 (USD Million)
TABLE 593 Middle East and Africa Stage III in Gastric Cancer Diagnostics Market, By Stage, 2019-2028 (USD Million)
TABLE 594 Middle East and Africa Gastric Cancer Diagnostics Market, By Gender, 2019-2028 (USD Million)
TABLE 595 Middle East and Africa Gastric Cancer Diagnostics Market, By Sample Type, 2019-2028 (USD Million)
TABLE 596 Middle East and Africa Gastric Cancer Diagnostics Market, By End User, 2019-2028 (USD Million)
TABLE 597 Middle East and Africa Gastric Cancer Diagnostics Market, By Distribution CHannel, 2019-2028 (USD Million)
TABLE 598 South Africa Gastric Cancer Diagnostics Market, By Product Type, 2019-2028 (USD Million)
TABLE 599 South Africa Reagents & Consumables in Gastric Cancer Diagnostics Market, By Product Type, 2019-2028 (USD Million)
TABLE 600 South Africa Kits in Gastric Cancer Diagnostics Market, By Product Type, 2019-2028 (USD Million)
TABLE 601 South Africa Reagents in Gastric Cancer Diagnostics Market, By Product Type, 2019-2028 (USD Million)
TABLE 602 South Africa Gastric Cancer Diagnostics Market, By Diagnostic Type, 2019-2028 (USD Million)
TABLE 603 South Africa Confirmatory tests in Gastric Cancer Diagnostics Market, By Diagnostic Type, 2019-2028 (USD Million)
TABLE 604 South Africa Imaging Tests in Gastric Cancer Diagnostics Market, By Diagnostic Type, 2019-2028 (USD Million)
TABLE 605 South Africa Biomarker in Gastric Cancer Diagnostics Market, By Diagnostic Type, 2019-2028 (USD Million)
TABLE 606 South Africa Gastric Cancer Diagnostics Market, By Age Group, 2019-2028 (USD Million)
TABLE 607 South Africa Gastric Cancer Diagnostics Market, By Disease Type, 2019-2028 (USD Million)
TABLE 608 South Africa Gastric Cancer Diagnostics Market, By Stage, 2019-2028 (USD Million)
TABLE 609 South Africa Stage I in Gastric Cancer Diagnostics Market, By Stage, 2019-2028 (USD Million)
TABLE 610 South Africa Stage II in Gastric Cancer Diagnostics Market, By Stage, 2019-2028 (USD Million)
TABLE 611 South Africa Stage III in Gastric Cancer Diagnostics Market, By Stage, 2019-2028 (USD Million)
TABLE 612 South Africa Gastric Cancer Diagnostics Market, By Gender, 2019-2028 (USD Million)
TABLE 613 South Africa Gastric Cancer Diagnostics Market, By Sample Type, 2019-2028 (USD Million)
TABLE 614 South Africa Gastric Cancer Diagnostics Market, By End User, 2019-2028 (USD Million)
TABLE 615 South Africa Gastric Cancer Diagnostics Market, By Distribution CHannel, 2019-2028 (USD Million)
TABLE 616 Saudi Arabia Gastric Cancer Diagnostics Market, By Product Type, 2019-2028 (USD Million)
TABLE 617 Saudi Arabia Reagents & Consumables in Gastric Cancer Diagnostics Market, By Product Type, 2019-2028 (USD Million)
TABLE 618 Saudi Arabia Kits in Gastric Cancer Diagnostics Market, By Product Type, 2019-2028 (USD Million)
TABLE 619 Saudi Arabia Reagents in Gastric Cancer Diagnostics Market, By Product Type, 2019-2028 (USD Million)
TABLE 620 Saudi Arabia Gastric Cancer Diagnostics Market, By Diagnostic Type, 2019-2028 (USD Million)
TABLE 621 Saudi Arabia Confirmatory tests in Gastric Cancer Diagnostics Market, By Diagnostic Type, 2019-2028 (USD Million)
TABLE 622 Saudi Arabia Imaging Tests in Gastric Cancer Diagnostics Market, By Diagnostic Type, 2019-2028 (USD Million)
TABLE 623 Saudi Arabia Biomarker in Gastric Cancer Diagnostics Market, By Diagnostic Type, 2019-2028 (USD Million)
TABLE 624 Saudi Arabia Gastric Cancer Diagnostics Market, By Age Group, 2019-2028 (USD Million)
TABLE 625 Saudi Arabia Gastric Cancer Diagnostics Market, By Disease Type, 2019-2028 (USD Million)
TABLE 626 Saudi Arabia Gastric Cancer Diagnostics Market, By Stage, 2019-2028 (USD Million)
TABLE 627 Saudi Arabia Stage I in Gastric Cancer Diagnostics Market, By Stage, 2019-2028 (USD Million)
TABLE 628 Saudi Arabia Stage II in Gastric Cancer Diagnostics Market, By Stage, 2019-2028 (USD Million)
TABLE 629 Saudi Arabia Stage III in Gastric Cancer Diagnostics Market, By Stage, 2019-2028 (USD Million)
TABLE 630 Saudi Arabia Gastric Cancer Diagnostics Market, By Gender, 2019-2028 (USD Million)
TABLE 631 Saudi Arabia Gastric Cancer Diagnostics Market, By Sample Type, 2019-2028 (USD Million)
TABLE 632 Saudi Arabia Gastric Cancer Diagnostics Market, By End User, 2019-2028 (USD Million)
TABLE 633 Saudi Arabia Gastric Cancer Diagnostics Market, By Distribution CHannel, 2019-2028 (USD Million)
TABLE 634 U.A.E. Gastric Cancer Diagnostics Market, By Product Type, 2019-2028 (USD Million)
TABLE 635 U.A.E. Reagents & Consumables in Gastric Cancer Diagnostics Market, By Product Type, 2019-2028 (USD Million)
TABLE 636 U.A.E. Kits in Gastric Cancer Diagnostics Market, By Product Type, 2019-2028 (USD Million)
TABLE 637 U.A.E. Reagents in Gastric Cancer Diagnostics Market, By Product Type, 2019-2028 (USD Million)
TABLE 638 U.A.E. Gastric Cancer Diagnostics Market, By Diagnostic Type, 2019-2028 (USD Million)
TABLE 639 U.A.E. Confirmatory tests in Gastric Cancer Diagnostics Market, By Diagnostic Type, 2019-2028 (USD Million)
TABLE 640 U.A.E. Imaging Tests in Gastric Cancer Diagnostics Market, By Diagnostic Type, 2019-2028 (USD Million)
TABLE 641 U.A.E. Biomarker in Gastric Cancer Diagnostics Market, By Diagnostic Type, 2019-2028 (USD Million)
TABLE 642 U.A.E. Gastric Cancer Diagnostics Market, By Age Group, 2019-2028 (USD Million)
TABLE 643 U.A.E. Gastric Cancer Diagnostics Market, By Disease Type, 2019-2028 (USD Million)
TABLE 644 U.A.E. Gastric Cancer Diagnostics Market, By Stage, 2019-2028 (USD Million)
TABLE 645 U.A.E. Stage I in Gastric Cancer Diagnostics Market, By Stage, 2019-2028 (USD Million)
TABLE 646 U.A.E. Stage II in Gastric Cancer Diagnostics Market, By Stage, 2019-2028 (USD Million)
TABLE 647 U.A.E. Stage III in Gastric Cancer Diagnostics Market, By Stage, 2019-2028 (USD Million)
TABLE 648 U.A.E. Gastric Cancer Diagnostics Market, By Gender, 2019-2028 (USD Million)
TABLE 649 U.A.E. Gastric Cancer Diagnostics Market, By Sample Type, 2019-2028 (USD Million)
TABLE 650 U.A.E. Gastric Cancer Diagnostics Market, By End User, 2019-2028 (USD Million)
TABLE 651 U.A.E. Gastric Cancer Diagnostics Market, By Distribution CHannel, 2019-2028 (USD Million)
TABLE 652 Egypt Gastric Cancer Diagnostics Market, By Product Type, 2019-2028 (USD Million)
TABLE 653 Egypt Reagents & Consumables in Gastric Cancer Diagnostics Market, By Product Type, 2019-2028 (USD Million)
TABLE 654 Egypt Kits in Gastric Cancer Diagnostics Market, By Product Type, 2019-2028 (USD Million)
TABLE 655 Egypt Reagents in Gastric Cancer Diagnostics Market, By Product Type, 2019-2028 (USD Million)
TABLE 656 Egypt Gastric Cancer Diagnostics Market, By Diagnostic Type, 2019-2028 (USD Million)
TABLE 657 Egypt Confirmatory tests in Gastric Cancer Diagnostics Market, By Diagnostic Type, 2019-2028 (USD Million)
TABLE 658 Egypt Imaging Tests in Gastric Cancer Diagnostics Market, By Diagnostic Type, 2019-2028 (USD Million)
TABLE 659 Egypt Biomarker in Gastric Cancer Diagnostics Market, By Diagnostic Type, 2019-2028 (USD Million)
TABLE 660 Egypt Gastric Cancer Diagnostics Market, By Age Group, 2019-2028 (USD Million)
TABLE 661 Egypt Gastric Cancer Diagnostics Market, By Disease Type, 2019-2028 (USD Million)
TABLE 662 Egypt Gastric Cancer Diagnostics Market, By Stage, 2019-2028 (USD Million)
TABLE 663 Egypt Stage I in Gastric Cancer Diagnostics Market, By Stage, 2019-2028 (USD Million)
TABLE 664 Egypt Stage II in Gastric Cancer Diagnostics Market, By Stage, 2019-2028 (USD Million)
TABLE 665 Egypt Stage III in Gastric Cancer Diagnostics Market, By Stage, 2019-2028 (USD Million)
TABLE 666 Egypt Gastric Cancer Diagnostics Market, By Gender, 2019-2028 (USD Million)
TABLE 667 Egypt Gastric Cancer Diagnostics Market, By Sample Type, 2019-2028 (USD Million)
TABLE 668 Egypt Gastric Cancer Diagnostics Market, By End User, 2019-2028 (USD Million)
TABLE 669 Egypt Gastric Cancer Diagnostics Market, By Distribution CHannel, 2019-2028 (USD Million)
TABLE 670 Israel Gastric Cancer Diagnostics Market, By Product Type, 2019-2028 (USD Million)
TABLE 671 Israel Reagents & Consumables in Gastric Cancer Diagnostics Market, By Product Type, 2019-2028 (USD Million)
TABLE 672 Israel Kits in Gastric Cancer Diagnostics Market, By Product Type, 2019-2028 (USD Million)
TABLE 673 Israel Reagents in Gastric Cancer Diagnostics Market, By Product Type, 2019-2028 (USD Million)
TABLE 674 Israel Gastric Cancer Diagnostics Market, By Diagnostic Type, 2019-2028 (USD Million)
TABLE 675 Israel Confirmatory tests in Gastric Cancer Diagnostics Market, By Diagnostic Type, 2019-2028 (USD Million)
TABLE 676 Israel Imaging Tests in Gastric Cancer Diagnostics Market, By Diagnostic Type, 2019-2028 (USD Million)
TABLE 677 Israel Biomarker in Gastric Cancer Diagnostics Market, By Diagnostic Type, 2019-2028 (USD Million)
TABLE 678 Israel Gastric Cancer Diagnostics Market, By Age Group, 2019-2028 (USD Million)
TABLE 679 Israel Gastric Cancer Diagnostics Market, By Disease Type, 2019-2028 (USD Million)
TABLE 680 Israel Gastric Cancer Diagnostics Market, By Stage, 2019-2028 (USD Million)
TABLE 681 Israel Stage I in Gastric Cancer Diagnostics Market, By Stage, 2019-2028 (USD Million)
TABLE 682 Israel Stage II in Gastric Cancer Diagnostics Market, By Stage, 2019-2028 (USD Million)
TABLE 683 Israel Stage III in Gastric Cancer Diagnostics Market, By Stage, 2019-2028 (USD Million)
TABLE 684 Israel Gastric Cancer Diagnostics Market, By Gender, 2019-2028 (USD Million)
TABLE 685 Israel Gastric Cancer Diagnostics Market, By Sample Type, 2019-2028 (USD Million)
TABLE 686 Israel Gastric Cancer Diagnostics Market, By End User, 2019-2028 (USD Million)
TABLE 687 Israel Gastric Cancer Diagnostics Market, By Distribution CHannel, 2019-2028 (USD Million)
TABLE 688 Rest of Middle East & Africa Gastric Cancer Diagnostics Market, By Product Type, 2019-2028 (USD Million)
Abbildungsverzeichnis
FIGURE 1 Global GASTRIC CANCER DIAGNOSTICS MARKET: SEGMENTATION
FIGURE 2 GLOBAL GASTRIC CANCER DIAGNOSTICS MARKET: DATA TRIANGULATION
FIGURE 3 global Gastric cancer diagnostics market: DROC ANALYSIS
FIGURE 4 Global Gastric cancer diagnostics market: Global VS. REGIONAL MARKET ANALYSIS
FIGURE 5 Global Gastric cancer diagnostics market: COMPANY RESEARCH ANALYSIS
FIGURE 6 GLOBAL Gastric cancer diagnostics market: MULTIVARIATE MODELLING
FIGURE 7 GLOBAL Gastric cancer diagnostics market: INTERVIEW DEMOGRAPHICS
FIGURE 8 GLOBAL GASTRIC CANCER DIAGNOSTICS MARKET: DBMR MARKET POSITION GRID
FIGURE 9 GLOBAL GASTRIC CANCER DIAGNOSTICS MARKET: VENDOR SHARE ANALYSIS
FIGURE 10 GLOBAL gastric cancer diagnostics market: MARKET END USER COVERAGE GRID
FIGURE 11 Global Gastric cancer diagnostics market: SEGMENTATION
FIGURE 12 NORTH AMERICA is expected to DOMINATE THE GLOBAL Gastric cancer diagnostics market AND ASIA-PACIFIC IS EXPECTED TO GROW WITH THE HIGHEST CAGR IN THE FORECAST PERIOD OF 2021 TO 2028
FIGURE 13 Increase in incidence of gastrointestinal tumors, lymphoma, and adenocarcinoma is expected to DRIVe THE global Gastric cancer diagnostics market IN THE FORECAST PERIOD OF 2021 to 2028
FIGURE 14 reagents and consumables SEGMENT is expected to account for the largest share of the global GASTRIC CANCER DIAGNOSTICS MARKET in 2021 & 2028
FIGURE 15 ASIA-PACIFIC is the fastest growing market FOR the Gastric cancer diagnostics MANUFACTURERS IN THE FORECAST PERIOD OF 2021 TO 2028
FIGURE 16 DRIVERS, RESTRAINTS, OPPORTUNITIES, AND CHALLENGEs OF global Gastric cancer diagnostics Market
FIGURE 17 global gastric cancer diagnostics market: By product type, 2020
FIGURE 18 global gastric cancer diagnostics market: By product type, 2021-2028 (USD Million)
FIGURE 19 global gastric cancer diagnostics market: By product type, CAGR (2021-2028)
FIGURE 20 global gastric cancer diagnostics market: By product type, LIFELINE CURVE
FIGURE 21 global gastric cancer diagnostics market: By diagnostic type, 2020
FIGURE 22 global gastric cancer diagnostics market: By diagnostic type, 2021-2028 (USD Million)
FIGURE 23 global gastric cancer diagnostics market: By diagnostic type, CAGR (2021-2028)
FIGURE 24 global gastric cancer diagnostics market: By diagnostic type, LIFELINE CURVE
FIGURE 25 global gastric cancer diagnostics market: By age group, 2020
FIGURE 26 global gastric cancer diagnostics market: By age group, 2021-2028 (USD Million)
FIGURE 27 global gastric cancer diagnostics market: By age group, CAGR (2021-2028)
FIGURE 28 global gastric cancer diagnostics market: By age group, LIFELINE CURVE
FIGURE 29 global gastric cancer diagnostics market: By disease type, 2020
FIGURE 30 global gastric cancer diagnostics market: By disease type, 2021-2028 (USD Million)
FIGURE 31 global gastric cancer diagnostics market: By disease type, CAGR (2021-2028)
FIGURE 32 global gastric cancer diagnostics market: By disease type, LIFELINE CURVE
FIGURE 33 global gastric cancer diagnostics market: By stage, 2020
FIGURE 34 global gastric cancer diagnostics market: By stage, 2021-2028 (USD Million)
FIGURE 35 global gastric cancer diagnostics market: By stage, CAGR (2021-2028)
FIGURE 36 global gastric cancer diagnostics market: By stage, LIFELINE CURVE
FIGURE 37 global gastric cancer diagnostics market: By gender, 2020
FIGURE 38 global gastric cancer diagnostics market: By gender, 2021-2028 (USD Million)
FIGURE 39 global gastric cancer diagnostics market: By gender, CAGR (2021-2028)
FIGURE 40 global gastric cancer diagnostics market: By gender, LIFELINE CURVE
FIGURE 41 global gastric cancer diagnostics market: By sample type, 2020
FIGURE 42 global gastric cancer diagnostics market: By sample type, 2021-2028 (USD Million)
FIGURE 43 global gastric cancer diagnostics market: By sample type, CAGR (2021-2028)
FIGURE 44 global gastric cancer diagnostics market: By sample type, LIFELINE CURVE
FIGURE 45 global gastric cancer diagnostics market: By end user, 2020
FIGURE 46 global gastric cancer diagnostics market: By end user, 2021-2028 (USD Million)
FIGURE 47 global gastric cancer diagnostics market: By end user, CAGR (2021-2028)
FIGURE 48 global gastric cancer diagnostics market: By end user, LIFELINE CURVE
FIGURE 49 global gastric cancer diagnostics market: By distribution channel, 2020
FIGURE 50 global gastric cancer diagnostics market: By distribution channel, 2021-2028 (USD Million)
FIGURE 51 global gastric cancer diagnostics market: By distribution channel, CAGR (2021-2028)
FIGURE 52 global gastric cancer diagnostics market: By distribution channel, LIFELINE CURVE
FIGURE 53 GLOBAL gastric cancer diagnostics market: SNAPSHOT (2020)
FIGURE 54 GLOBAL gastric cancer diagnostics market: by region (2020)
FIGURE 55 GLOBAL gastric cancer diagnostics market: by region (2021 & 2028)
FIGURE 56 GLOBAL gastric cancer diagnostics market: by region (2020 & 2028)
FIGURE 57 GLOBAL gastric cancer diagnostics market: by product TYPE (2021-2028)
FIGURE 58 NORTH AMERICA Gastric Cancer Diagnostics MARKET: SNAPSHOT (2020)
FIGURE 59 NORTH AMERICA Gastric Cancer Diagnostics MARKET: BY COUNTRY (2020)
FIGURE 60 NORTH AMERICA Gastric Cancer Diagnostics MARKET: BY COUNTRY (2021 & 2028)
FIGURE 61 NORTH AMERICA Gastric Cancer Diagnostics MARKET: BY COUNTRY (2020 & 2028)
FIGURE 62 NORTH AMERICA Gastric Cancer Diagnostics MARKET: BY PRODUCT TYPE (2021-2028)
FIGURE 63 EUROPE Gastric Cancer Diagnostics MARKET: SNAPSHOT (2020)
FIGURE 64 EUROPE Gastric Cancer Diagnostics MARKET: BY COUNTRY (2020)
FIGURE 65 EUROPE Gastric Cancer Diagnostics MARKET: BY COUNTRY (2021 & 2028)
FIGURE 66 EUROPE Gastric Cancer Diagnostics MARKET: BY COUNTRY (2020 & 2028)
FIGURE 67 EUROPE Gastric Cancer Diagnostics MARKET: BY PRODUCT TYPE (2021-2028)
FIGURE 68 ASIA-PACIFIC Gastric Cancer Diagnostics MARKET: SNAPSHOT (2020)
FIGURE 69 ASIA-PACIFIC Gastric Cancer Diagnostics MARKET: BY COUNTRY (2020)
FIGURE 70 ASIA-PACIFIC Gastric Cancer Diagnostics MARKET: BY COUNTRY (2021 & 2028)
FIGURE 71 ASIA-PACIFIC Gastric Cancer Diagnostics MARKET: BY COUNTRY (2020 & 2028)
FIGURE 72 ASIA-PACIFIC Gastric Cancer Diagnostics MARKET: BY product TYPE (2021-2028)
FIGURE 73 SOUTH AMERICA Gastric Cancer Diagnostics MARKET: SNAPSHOT (2020)
FIGURE 74 SOUTH AMERICA Gastric Cancer Diagnostics MARKET: BY COUNTRY (2020)
FIGURE 75 SOUTH AMERICA Gastric Cancer Diagnostics MARKET: BY COUNTRY (2021 & 2028)
FIGURE 76 SOUTH AMERICA Gastric Cancer Diagnostics MARKET: BY COUNTRY (2020 & 2028)
FIGURE 77 SOUTH AMERICA Gastric Cancer Diagnostics MARKET: BY PRODUCT TYPE (2021-2028)
FIGURE 78 MIDDLE EAST AND AFRICA Gastric Cancer Diagnostics MARKET: SNAPSHOT (2020)
FIGURE 79 MIDDLE EAST AND AFRICA Gastric Cancer Diagnostics MARKET: BY COUNTRY (2020)
FIGURE 80 MIDDLE EAST AND AFRICA Gastric Cancer Diagnostics MARKET: BY COUNTRY (2021 & 2028)
FIGURE 81 MIDDLE EAST AND AFRICA Gastric Cancer Diagnostics MARKET: BY COUNTRY (2020 & 2028)
FIGURE 82 MIDDLE EAST AND AFRICA Gastric Cancer Diagnostics MARKET: BY product TYPE (2021-2028)
FIGURE 83 Global Gastric Cancer diagnostics Market: company share 2020 (%)
FIGURE 84 North America Gastric Cancer diagnostics Market: company share 2020 (%)
FIGURE 85 EUROPE Gastric Cancer diagnostics Market: company share 2020 (%)
FIGURE 86 ASIA-PACIFIC Gastric Cancer diagnostics Market: company share 2020 (%)
Forschungsmethodik
Die Datenerfassung und Basisjahresanalyse werden mithilfe von Datenerfassungsmodulen mit großen Stichprobengrößen durchgeführt. Die Phase umfasst das Erhalten von Marktinformationen oder verwandten Daten aus verschiedenen Quellen und Strategien. Sie umfasst die Prüfung und Planung aller aus der Vergangenheit im Voraus erfassten Daten. Sie umfasst auch die Prüfung von Informationsinkonsistenzen, die in verschiedenen Informationsquellen auftreten. Die Marktdaten werden mithilfe von marktstatistischen und kohärenten Modellen analysiert und geschätzt. Darüber hinaus sind Marktanteilsanalyse und Schlüsseltrendanalyse die wichtigsten Erfolgsfaktoren im Marktbericht. Um mehr zu erfahren, fordern Sie bitte einen Analystenanruf an oder geben Sie Ihre Anfrage ein.
Die wichtigste Forschungsmethodik, die vom DBMR-Forschungsteam verwendet wird, ist die Datentriangulation, die Data Mining, die Analyse der Auswirkungen von Datenvariablen auf den Markt und die primäre (Branchenexperten-)Validierung umfasst. Zu den Datenmodellen gehören ein Lieferantenpositionierungsraster, eine Marktzeitlinienanalyse, ein Marktüberblick und -leitfaden, ein Firmenpositionierungsraster, eine Patentanalyse, eine Preisanalyse, eine Firmenmarktanteilsanalyse, Messstandards, eine globale versus eine regionale und Lieferantenanteilsanalyse. Um mehr über die Forschungsmethodik zu erfahren, senden Sie eine Anfrage an unsere Branchenexperten.
Anpassung möglich
Data Bridge Market Research ist ein führendes Unternehmen in der fortgeschrittenen formativen Forschung. Wir sind stolz darauf, unseren bestehenden und neuen Kunden Daten und Analysen zu bieten, die zu ihren Zielen passen. Der Bericht kann angepasst werden, um Preistrendanalysen von Zielmarken, Marktverständnis für zusätzliche Länder (fordern Sie die Länderliste an), Daten zu klinischen Studienergebnissen, Literaturübersicht, Analysen des Marktes für aufgearbeitete Produkte und Produktbasis einzuschließen. Marktanalysen von Zielkonkurrenten können von technologiebasierten Analysen bis hin zu Marktportfoliostrategien analysiert werden. Wir können so viele Wettbewerber hinzufügen, wie Sie Daten in dem von Ihnen gewünschten Format und Datenstil benötigen. Unser Analystenteam kann Ihnen auch Daten in groben Excel-Rohdateien und Pivot-Tabellen (Fact Book) bereitstellen oder Sie bei der Erstellung von Präsentationen aus den im Bericht verfügbaren Datensätzen unterstützen.

