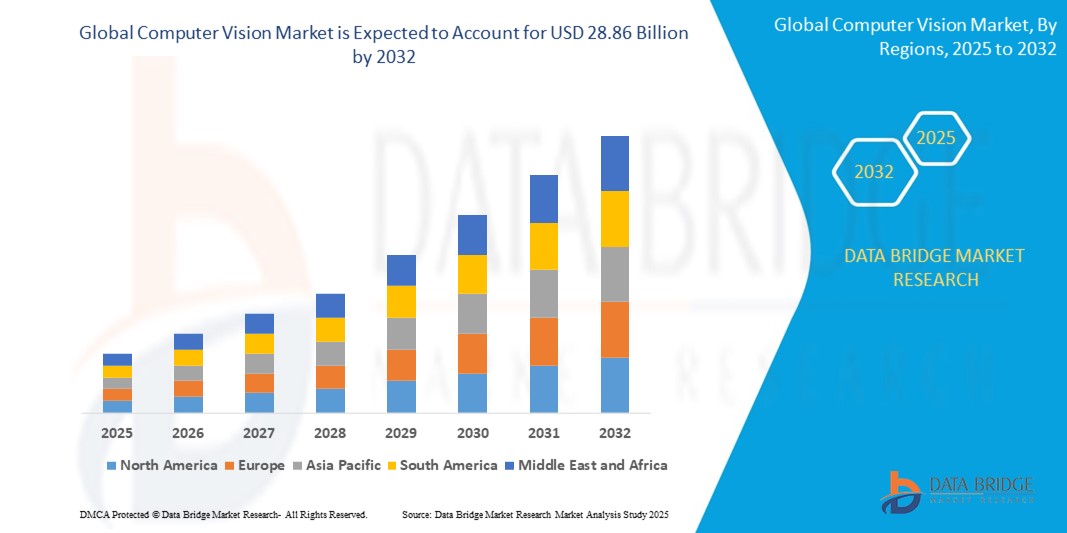
Global Computer Vision Market
Marktgröße in Milliarden USD
CAGR :
%

![]() |
2024 –2031 |
![]() | USD 14.06 Billion |
![]() | USD 26.65 Billion |
![]() |
|
![]() |
|
Globaler Computer Vision-Markt, nach Komponenten (Hardware, Software und Service), Produkt (Computer Vision-Systeme auf Basis intelligenter Kameras und PC-basierte Computer Vision-Systeme), Angebot (Deep Learning und traditionelle Computer Vision), Anwendung (Qualitätssicherung und Inspektion, Positionierung und Führung, Identifikation und vorausschauende Wartung), Vertikal (industriell und nicht industriell) – Branchentrends und Prognose bis 2031.
Computer Vision-Marktanalyse und -größe
Der Computer-Vision-Markt erlebt ein robustes Wachstum, das durch Fortschritte in den Bereichen künstliche Intelligenz (KI) und maschinelles Lernen vorangetrieben wird. Die steigende Nachfrage nach Automatisierung und Effizienz in verschiedenen Branchen wie der Automobilindustrie, dem Gesundheitswesen, dem Einzelhandel und der Landwirtschaft treibt die Einführung von Computer-Vision-Lösungen voran. Diese Lösungen ermöglichen es Maschinen, die visuelle Welt zu interpretieren und zu verstehen, was eine breite Palette von Anwendungen ermöglicht, von der Gesichtserkennung und Objekterkennung bis hin zu autonomen Fahrzeugen und Augmented Reality . Der Markt profitiert auch von der wachsenden Verfügbarkeit von Cloud-Computing-Diensten, die die notwendige Infrastruktur für die Verarbeitung und Analyse großer Mengen visueller Daten bereitstellen.
Der weltweite Markt für Computer Vision wurde im Jahr 2023 auf 14,06 Milliarden US-Dollar geschätzt und soll bis 2031 26,65 Milliarden US-Dollar erreichen, mit einer durchschnittlichen jährlichen Wachstumsrate von 8,32 % im Prognosezeitraum von 2024 bis 2031. Neben Einblicken in Marktszenarien wie Marktwert, Wachstumsrate, Segmentierung, geografische Abdeckung und wichtige Akteure enthalten die von Data Bridge Market Research zusammengestellten Marktberichte auch eingehende Expertenanalysen, geografisch dargestellte Produktion und Kapazität nach Unternehmen, Netzwerklayouts von Distributoren und Partnern, detaillierte und aktuelle Preistrendanalysen und Defizitanalysen von Lieferkette und Nachfrage.
Berichtsumfang und Marktsegmentierung
Berichtsmetrik |
Details |
Prognosezeitraum |
2024 bis 2031 |
Basisjahr |
2023 |
Historische Jahre |
2022 (Anpassbar auf 2016 – 2021) |
Quantitative Einheiten |
Umsatz in Mrd. USD, Volumen in Einheiten, Preise in USD |
Abgedeckte Segmente |
Komponenten (Hardware, Software und Service), Produkt (Computer Vision-Systeme auf Basis intelligenter Kameras und PC-basierte Computer Vision-Systeme), Angebot (Deep Learning und traditionelle Computer Vision), Anwendung (Qualitätssicherung und Inspektion, Positionierung und Führung, Identifikation und vorausschauende Wartung ), Vertikal (industriell und nicht-industriell) |
Abgedeckte Länder |
USA, Kanada, Mexiko, Deutschland, Frankreich, Großbritannien, Niederlande, Schweiz, Belgien, Russland, Italien, Spanien, Türkei, Restliches Europa, China, Japan, Indien, Südkorea, Singapur, Malaysia, Australien, Thailand, Indonesien, Philippinen, Restlicher Asien-Pazifik-Raum, Saudi-Arabien, Vereinigte Arabische Emirate, Südafrika, Ägypten, Israel, Restlicher Naher Osten und Afrika, Brasilien, Argentinien und Restliches Südamerika |
Abgedeckte Marktteilnehmer |
Cognex Corporation (USA), Basler AG (Deutschland), OMRON Corporation (Japan), KEYENCE CORPORATION (Japan), National Instruments Corp (USA), Sony Corporation (Japan), Teledyne Technologies (USA), Allied Vision Technologies GmbH (Deutschland), Texas Instruments Incorporated (USA), Intel Corporation (USA), Baumer (Deutschland), JAI (Dänemark), MediaTek, Inc. (Taiwan), Cadence Design Systems, Inc. (USA), CEVA, Inc. (USA) und Synopsys, Inc. (USA) |
Marktchancen |
|
Marktdefinition
Computer Vision ist ein Bereich der künstlichen Intelligenz (KI), der es Computern ermöglicht, die visuelle Welt zu interpretieren und zu verstehen. Dabei werden Algorithmen und Methoden entwickelt, mit denen Maschinen Informationen aus Bildern oder Videos extrahieren und dabei das menschliche Sehvermögen nachahmen können. Computer Vision-Systeme können visuelle Daten analysieren und interpretieren, beispielsweise Objekte identifizieren, Gesichter erkennen, Bewegungen erfassen und Szenen verstehen.
Marktdynamik für Computer Vision
Treiber
- Steigende Nachfrage nach Automatisierung
Unternehmen erkennen die Vorteile der Automatisierung bei der Rationalisierung von Prozessen, der Verbesserung der Effizienz und der Kostensenkung. Computer Vision spielt bei der Automatisierung eine entscheidende Rolle, da sie Maschinen ermöglicht, visuelle Daten zu interpretieren und zu verstehen, sodass sie Aufgaben ausführen können, die traditionell menschliches Eingreifen erfordern. Branchen wie Fertigung, Logistik und Gesundheitswesen setzen zunehmend Computer Vision-Lösungen ein, um sich wiederholende Aufgaben zu automatisieren, die Produktivität zu steigern und die allgemeine Betriebseffizienz zu verbessern. Da die Nachfrage nach Automatisierung weiter wächst, wird erwartet, dass der Computer Vision-Markt ein erhebliches Wachstum verzeichnen wird.
- Fortschritte in KI und maschinellem Lernen
Technologische Fortschritte in den Bereichen KI und maschinelles Lernen treiben die Fähigkeiten von Computer-Vision-Systemen voran. Diese Fortschritte ermöglichen es Computer-Vision-Systemen, genauere und anspruchsvollere Aufgaben wie Bilderkennung , Objekterkennung und Bildsegmentierung auszuführen. KI- und maschinelle Lernalgorithmen ermöglichen es Computer-Vision-Systemen, aus Daten zu lernen und ihre Leistung im Laufe der Zeit zu verbessern. Dies hat zu erheblichen Fortschritten bei Computer-Vision-Anwendungen wie autonomen Fahrzeugen, Gesichtserkennung und medizinischer Bildanalyse geführt. Da sich Computer Vision im Bereich KI weiterentwickelt, wird erwartet, dass sich die Fähigkeiten von Computer-Vision-Systemen weiter verbessern und das Wachstum des Computer-Vision-Marktes vorantreiben.
Gelegenheiten
- Integration mit Robotik und Automatisierung
Computer Vision ist ein integraler Bestandteil der Robotik und Automatisierung und bietet eine Reihe von Anwendungen von der industriellen Automatisierung bis hin zu autonomen Fahrzeugen. In der Robotik ermöglicht Computer Vision Maschinen, visuelle Daten zu interpretieren und Aufgaben wie Objekterkennung, Navigation und Qualitätskontrolle in der Fertigung zu erleichtern. Diese Integration verbessert die Effizienz, Genauigkeit und Sicherheit in verschiedenen Branchen. Bei autonomen Fahrzeugen ermöglicht Computer Vision den Fahrzeugen, ihre Umgebung wahrzunehmen, Hindernisse zu erkennen und sicher zu navigieren. Die Nachfrage nach Computer Vision-Technologien wird voraussichtlich steigen, da sich Robotik und Automatisierung weiterentwickeln und Innovation und Wachstum auf dem Markt vorantreiben.
- Entwicklung autonomer Fahrzeuge
Die Entwicklung autonomer Fahrzeuge stützt sich in hohem Maße auf Computer-Vision-Technologien. Computer-Vision-Systeme in autonomen Fahrzeugen interpretieren visuelle Daten von Kameras und Sensoren, um ihre Umgebung zu verstehen, Hindernisse zu erkennen und fundierte Entscheidungen zu treffen. Fortschritte bei Computer-Vision-Algorithmen und -Hardware haben die Fähigkeiten autonomer Fahrsysteme deutlich verbessert und ermöglichen es Fahrzeugen, komplexe Umgebungen zu navigieren und sicher zu fahren. Da die Automobilindustrie weiterhin in autonome Fahrzeugtechnologie investiert, wird erwartet, dass die Nachfrage nach fortschrittlichen Computer-Vision-Lösungen steigen wird. Dies bietet Computer-Vision-Unternehmen neue Möglichkeiten, Innovationen zu entwickeln und mit Automobilherstellern zusammenzuarbeiten, um die Zukunft des Transports zu gestalten.
Einschränkungen/Herausforderungen
- Datenschutz- und Sicherheitsbedenken
Der Einsatz von Computer-Vision-Technologien wirft erhebliche Bedenken hinsichtlich Datenschutz und -sicherheit auf. Da diese Systeme häufig das Sammeln und Analysieren sensibler visueller Daten erfordern, besteht das Risiko einer unbefugten Überwachung und potenzieller Datenschutzverletzungen. Der Missbrauch oder die falsche Handhabung dieser Daten kann zu schwerwiegenden Datenschutzverletzungen und rechtlichen Problemen führen. Darüber hinaus können die Komplexität der Computer-Vision-Algorithmen und die enorme Datenmenge, die sie verarbeiten, sie anfällig für Cyberangriffe machen.
- Hohe Implementierungskosten
Die Implementierung von Computer-Vision-Lösungen kann kostspielig sein, insbesondere für kleine und mittlere Unternehmen (KMU). Die hohen Kosten sind in erster Linie auf den Bedarf an spezieller Hardware, Software und Fachpersonal zurückzuführen. Die Beschaffung und Wartung der erforderlichen Hardware wie Kameras, Sensoren und Verarbeitungseinheiten kann teuer sein. Darüber hinaus erfordert die Implementierung von Computer-Vision-Algorithmen und deren Integration in bestehende Systeme Fachwissen, was möglicherweise zusätzliche Schulungen oder die Einstellung von Fachkräften erfordert. Diese Kosten können für KMU eine Eintrittsbarriere darstellen und ihre Fähigkeit einschränken, Computer-Vision-Lösungen einzuführen und mit größeren Unternehmen zu konkurrieren.
Dieser Marktbericht enthält Einzelheiten zu neuen Entwicklungen, Handelsvorschriften, Import-Export-Analysen, Produktionsanalysen, Optimierung der Wertschöpfungskette, Marktanteilen, Auswirkungen inländischer und lokaler Marktteilnehmer, analysiert Chancen in Bezug auf neue Einnahmequellen, Änderungen der Marktvorschriften, strategische Marktwachstumsanalysen, Marktgröße, Kategoriemarktwachstum, Anwendungsnischen und -dominanz, Produktzulassungen, Produkteinführungen, geografische Expansionen und technologische Innovationen auf dem Markt. Um weitere Informationen zum Markt zu erhalten, wenden Sie sich für einen Analystenbericht an Data Bridge Market Research. Unser Team hilft Ihnen dabei, eine fundierte Marktentscheidung zu treffen, um Marktwachstum zu erzielen.
Jüngste Entwicklungen
- Im März 2023 erweiterte Texas Instruments Incorporated seine Computer-Vision-Lösungen durch die Einführung von sechs auf Arm Cortex basierenden Vision-Prozessoren. Diese Prozessoren ermöglichen es Designern, verbesserte Bildverarbeitung und künstliche Intelligenz (KI) in Anwendungen wie Videotürklingeln, maschinelles Sehen und autonome mobile Roboter zu integrieren. Die neuen Prozessoren bieten eine verbesserte Kosteneffizienz und Energieeffizienz und bieten erhebliche Vorteile für verschiedene KI-gesteuerte Anwendungen
- Im Mai 2022 stellte die Intel Corporation, ein US-amerikanisches Unternehmen, das für seine vielfältigen Technologieprodukte und -dienstleistungen wie Cloud Computing, Rechenzentren und IoT-Lösungen bekannt ist, eine Computer-Vision-Software namens „Sonoma Creek“ vor. Diese Software soll Entwicklern dabei helfen, künstliche Intelligenz schnell in ihre Produkte zu integrieren.
Auswirkungen von Rohstoffknappheit und Lieferverzögerungen und aktuelles Marktszenario
Data Bridge Market Research bietet eine umfassende Marktanalyse und liefert Informationen, indem es die Auswirkungen und das aktuelle Marktumfeld von Rohstoffknappheit und Lieferverzögerungen berücksichtigt. Dies bedeutet, dass strategische Möglichkeiten bewertet, wirksame Aktionspläne erstellt und Unternehmen bei wichtigen Entscheidungen unterstützt werden.
Neben dem Standardbericht bieten wir auch detaillierte Analysen des Beschaffungsniveaus anhand prognostizierter Lieferverzögerungen, Händlerzuordnung nach Regionen, Warenanalysen, Produktionsanalysen, Preiszuordnungstrends, Beschaffung, Kategorieleistungsanalysen, Lösungen zum Lieferkettenrisikomanagement, erweitertes Benchmarking und andere Dienste für Beschaffung und strategische Unterstützung.
Erwartete Auswirkungen der Konjunkturabschwächung auf die Preisgestaltung und Verfügbarkeit von Produkten
Wenn die Wirtschaftstätigkeit nachlässt, leiden auch die Branchen darunter. Die prognostizierten Auswirkungen des Konjunkturabschwungs auf die Preisgestaltung und Verfügbarkeit der Produkte werden in den von DBMR bereitgestellten Markteinblickberichten und Informationsdiensten berücksichtigt. Damit sind unsere Kunden ihren Konkurrenten in der Regel immer einen Schritt voraus, können ihre Umsätze und Erträge prognostizieren und ihre Gewinn- und Verlustaufwendungen abschätzen.
Computer Vision Marktumfang
Der Computer Vision-Markt ist nach Komponenten, Produkten, Angeboten, Anwendungen und Branchen segmentiert. Das Wachstum dieser Segmente hilft Ihnen bei der Analyse schwacher Wachstumssegmente in den Branchen und bietet den Benutzern einen wertvollen Marktüberblick und Markteinblicke, die ihnen bei der strategischen Entscheidungsfindung zur Identifizierung der wichtigsten Marktanwendungen helfen.
Komponenten
- Hardware
- Software
- Service
Produkt
- Intelligente kamerabasierte Computer-Vision-Systeme
- PC-basierte Computer Vision Systeme
Angebot
- Tiefes Lernen
- Traditionelle Computervision
Anwendung
- Qualitätssicherung und Inspektion
- Positionierung und Führung
- Identifikation
- Vorausschauende Wartung
Vertikal
- Industrie
- Nicht industriell
Regionale Analyse/Einblicke zum Computer Vision-Markt
Der Markt wird analysiert und es werden Einblicke in die Marktgröße und Trends nach Land, Komponenten, Produkt, Angebot, Anwendung und Branche wie oben angegeben bereitgestellt.
Die im Marktbericht abgedeckten Länder sind die USA, Kanada, Mexiko, Deutschland, Frankreich, Großbritannien, Niederlande, Schweiz, Belgien, Russland, Italien, Spanien, Türkei, übriges Europa, China, Japan, Indien, Südkorea, Singapur, Malaysia, Australien, Thailand, Indonesien, Philippinen, übriger Asien-Pazifik-Raum, Saudi-Arabien, Vereinigte Arabische Emirate, Südafrika, Ägypten, Israel, übriger Naher Osten und Afrika, Brasilien, Argentinien und übriges Südamerika.
Der asiatisch-pazifische Raum wird den Markt voraussichtlich dominieren, da dort wichtige Akteure wie OMRON Corporation und Sony Semiconductor Solutions Corporation vertreten sind, die weiteres Wachstum vorantreiben sollen. Darüber hinaus tragen die erheblichen Investitionen chinesischer Unternehmen und anderer APAC-Länder in Computer-Vision-Technologie zum hohen Marktanteil der Region bei.
Für Nordamerika wird ein deutliches Wachstum erwartet, da die Region mehrere namhafte Unternehmen der Computer-Vision-Branche beherbergt, darunter Microsoft, Google, IBM und Intel, die dort ihren Hauptsitz haben. Diese Unternehmen investieren beträchtlich in Forschung und Entwicklung, um die Computer-Vision-Technologie und ihre Anwendungen zu verbessern. Der regionale Markt Nordamerikas wächst, und diese Unternehmen weiten ihre Aktivitäten sowohl in den USA als auch in Kanada aus.
Der Länderabschnitt des Berichts enthält auch Angaben zu einzelnen marktbeeinflussenden Faktoren und Änderungen der Regulierung auf dem Inlandsmarkt, die sich auf die aktuellen und zukünftigen Trends des Marktes auswirken. Datenpunkte wie Downstream- und Upstream-Wertschöpfungskettenanalysen, technische Trends und Porters Fünf-Kräfte-Analyse sowie Fallstudien sind einige der Anhaltspunkte, die zur Prognose des Marktszenarios für einzelne Länder verwendet werden. Bei der Bereitstellung von Prognoseanalysen der Länderdaten werden auch die Präsenz und Verfügbarkeit globaler Marken und ihre Herausforderungen aufgrund großer oder geringer Konkurrenz durch lokale und inländische Marken sowie die Auswirkungen inländischer Zölle und Handelsrouten berücksichtigt.
Wettbewerbsumfeld und Computer Vision Marktanteilsanalyse
The market competitive landscape provides details by competitor. Details included are company overview, company financials, revenue generated, market potential, investment in research and development, new market initiatives, global presence, production sites and facilities, production capacities, company strengths and weaknesses, product launch, product width and breadth, application dominance. The above data points provided are only related to the companies' focus related to the market.
Some of the major players operating in the market are:
- Cognex Corporation (U.S.)
- Basler AG (Germany)
- OMRON Corporation (Japan)
- KEYENCE CORPORATION (Japan)
- National Instruments Corp (U.S.)
- Sony Corporation (Japan)
- Teledyne Technologies (U.S.)
- Allied Vision Technologies GmbH (Germany)
- Texas Instruments Incorporated (U.S.)
- Intel Corporation (U.S.)
- Baumer (Germany)
- JAI (Denmark)
- MediaTek, Inc. (Taiwan)
- Cadence Design Systems, Inc. (U.S.)
- CEVA, Inc. (U.S.)
- Synopsys, Inc. (U.S.)
SKU-
Erhalten Sie Online-Zugriff auf den Bericht zur weltweit ersten Market Intelligence Cloud
- Interaktives Datenanalyse-Dashboard
- Unternehmensanalyse-Dashboard für Chancen mit hohem Wachstumspotenzial
- Zugriff für Research-Analysten für Anpassungen und Abfragen
- Konkurrenzanalyse mit interaktivem Dashboard
- Aktuelle Nachrichten, Updates und Trendanalyse
- Nutzen Sie die Leistungsfähigkeit der Benchmark-Analyse für eine umfassende Konkurrenzverfolgung
Inhaltsverzeichnis
- introduction
- OBJECTIVES OF THE STUDY
- MARKET DEFINITION
- OVERVIEW OF GLOBAL Computer vision MARKET
- Currency and Pricing
- LIMITATIONS
- MARKETS COVERED
- MARKET SEGMENTATION
- MARKETS COVERED
- geographicAL scope
- years considered for the study
- DBMR TRIPOD DATA VALIDATION MODEL
- primary interviews with key opinion leaders
- DBMR MARKET POSITION GRID
- vendor share analysis
- Multivariate Modeling
- components timeline curve
- MARKET APPLICATION COVERAGE GRID
- secondary sourcEs
- assumptions
- EXECUTIVE SUMMARY
- premium insights
- IMPACT OF COVID-19 ON THE GLOBAL COMPUTER VISION MARKET
- AFTERMATH OF COVID-19 AND GOVERNMENT INITIATIVE TO BOOST THE MARKET
- STRATEGIC DECISIONS FOR MANUFACTURERS AFTER COVID-19 TO GAIN COMPETITIVE MARKET SHARE
- IMPACT ON PRICE
- IMPACT ON DEMAND AND SUPPLY CHAIN
- CONCLUSION
- market overview
- drivers
- Accuracy and reliability offered by computer vision system
- Integration of deep learning with computer vision
- RISE IN ADOPTION OF AI USING COMPUTER VISION
- RISE IN demand for Augmented Reality
- INCREASE IN demand for Identity verification
- RESTRAINTS
- Threats OF cyber-attacks in AI-based computer vision
- Threats from virus and malware in computer vision system
- Difficulty in Object Localization and Detection
- OPPORTUNITIES
- RISE IN need FOR computer vision in automotive and Manufacturing industries
- RISE IN adoption of computer vision across Retails and healthcare sector
- INCREASE interest towards Financial services and Agriculture sector
- CHALLENGES
- complexities involved in designing of computer vision system
- Malfunctioning in equipment of computer vision systems due to harsh in environment
- Lack of potential skilled workers to operate and maintain the system
- global computer vision MARKET, BY component
- overview
- hardware
- cameras
- BY INTERFACE STANDARDS
- USB 3.0
- GIGE
- CAMERA LINK HS
- CAMERA LINK
- USB 2.0
- OTHERS
- BY FRAME RATE
- 25-125 FPS
- LESS THAN 25 FPS
- MORE THAN 125 FPS
- BY FORMAT
- AREA SCAN
- LINE SCAN
- BY SENSOR TYPE
- CCD
- CMOS
- PROCESSORS
- MICROCONTROLLER AND MICROPROCESSORS
- VPUS
- FPGAS
- DSPS
- FRAme grabbers
- optics
- LED Lighting
- Software
- Deep learning
- traditional computer vision
- global Computer vision MARKET, BY application
- overview
- Quality Assurance & Inspection
- Positioning & Guidance
- Predictive Maintenance
- Identification
- global COMPUTER VISION MARKET, BY vertical
- overview
- Industrial
- Electronic and semiconductor
- Consumer ELECTRONICS
- pharmaceuticals
- food and packaging
- automotive
- machinery
- textiles
- metals
- solar panel manufacturing
- printing
- glass
- rubber and plastics
- wood and paper
- Non Industrial
- healthcare
- retail
- consumer electronics
- Autonomous and Semi Autonomous Vehicles
- Intelligent Transportation Systems
- Security and Surveillance
- Sports & Entertainment
- Postal and Logistics
- agriculture
- global Computer vision MARKET, BY product
- overview
- Smart Cameras-Based Computer Vision Systems
- PC-Based Computer Vision Systems
- Global Computer Vision market, by region
- overview
- NORTH AMERICA
- u.s.
- canada
- mexico
- south AMERICA
- Brazil
- Argentina
- Rest of South America
- EUROPE
- U.K.
- Germany
- France
- Italy
- Spain
- Netherlands
- Switzerland
- Belgium
- Russia
- Turkey
- Rest of Europe
- Asia-Pacific
- CHINA
- Japan
- South Korea
- India
- Australia
- Singapore
- Indonesia
- Malaysia
- Thailand
- Philippines
- Rest of Asia-Pacific
- Middle East & Africa
- Saudi Arabia
- U.A.E.
- Israel
- South Africa
- Egypt
- Rest of Middle East and Africa
- GLOBAL Computer Vision market: COMPANY landscape
- company share analysis: GLOBAL
- company share analysis: NORTH AMERICA
- company share analysis: EUROPE
- company share analysis: Asia-pacific
- Swot analysis
- Company profile
- Texas Instruments Incorporated
- COMPANY snapshot
- REVENUE ANALYSIS
- COMPANY SHARE ANALYSIS
- Application PORTFOLIO
- recent DEVELOPMENT
- Cognex Corporation
- COMPANY snapshot
- REVENUE ANALYSIS
- COMPANY SHARE ANALYSIS
- product PORTFOLIO
- recent DEVELOPMENTS
- Teledyne Technologies Incorporated
- COMPANY snapshot
- REVENUE ANALYSIS
- COMPANY SHARE ANALYSIS
- product PORTFOLIO
- recent DEVELOPMENTS
- KEYENCE CORPORATION
- COMPANY snapshot
- REVENUE ANALYSIS
- COMPANY SHARE ANALYSIS
- product PORTFOLIO
- recent DEVELOPMENT
- ametek, inc.
- COMPANY snapshot
- REVENUE ANALYSIS
- COMPANY SHARE ANALYSIS
- product PORTFOLIO
- recent DEVELOPMENT
- Basler AG
- COMPANY snapshot
- REVENUE ANALYSIS
- product PORTFOLIO
- recent DEVELOPMENTS
- Baumer
- COMPANY snapshot
- product PORTFOLIO
- recent DEVELOPMENT
- Cadence Design Systems
- COMPANY snapshot
- REVENUE ANALYSIS
- product PORTFOLIO
- recent DEVELOPMENT
- CEVA, INC.
- COMPANY snapshot
- REVENUE ANALYSIS
- Application & product PORTFOLIO
- recent DEVELOPMENT
- Clarifai, Inc.
- COMPANY snapshot
- product & solution PORTFOLIO
- recent DEVELOPMENTs
- Intel Corporation
- COMPANY snapshot
- REVENUE ANALYSIS
- Product PORTFOLIO
- recent DEVELOPMENT
- ISRA VISION AG
- COMPANY snapshot
- REVENUE ANALYSIS
- Product PORTFOLIO
- recent DEVELOPMENT
- jai a/s
- COMPANY snapshot
- product PORTFOLIO
- recent DEVELOPMENTS
- MVTEC SOFTWARE GMBH
- COMPANY snapshot
- product PORTFOLIO
- recent DEVELOPMENT
- national instruments corp.
- COMPANY snapshot
- REVENUE ANALYSIS
- product PORTFOLIO
- recent DEVELOPMENT
- OMRON Corporation
- COMPANY snapshot
- REVENUE ANALYSIS
- product PORTFOLIO
- recent DEVELOPMENTS
- SICK AG
- COMPANY snapshot
- product PORTFOLIO
- recent DEVELOPMENT
- SONY GROUP CORPORATION
- COMPANY snapshot
- REVENUE ANALYSIS
- product PORTFOLIO
- recent DEVELOPMENTS
- Synopsys, Inc
- COMPANY snapshot
- REVENUE ANALYSIS
- product PORTFOLIO
- recent DEVELOPMENTS
- Tordivel AS
- COMPANY snapshot
- product & solution PORTFOLIO
- recent DEVELOPMENTs
- questionnaire
- related reports
Tabellenverzeichnis
TABLE 1 Global computer vision Market, By component, 2019-2028 (USD Million)
TABLE 2 Global hardware in Computer vision Market, By Region, 2019-2028 (USD MILLION)
TABLE 3 Global hardware in computer vision Market, By component, 2019-2028 (USD Million)
TABLE 4 Global cameras in computer vision Market, By interface standards, 2019-2028 (USD Million)
TABLE 5 Global cameras in computer vision Market, By Frame rate, 2019-2028 (USD Million)
TABLE 6 Global cameras in computer vision Market, By Format, 2019-2028 (USD Million)
TABLE 7 Global cameras in computer vision Market, By Sensor type, 2019-2028 (USD Million)
TABLE 8 Global processors in computer vision Market, By component, 2019-2028 (USD Million)
TABLE 9 Global Software in Computer vision Market, By Region, 2019-2028 (USD MILLION)
TABLE 10 Global Software in computer vision Market, By component, 2019-2028 (USD Million)
TABLE 11 Global Computer vision Market, By application,2019-2028 (USD Million)
TABLE 12 Global Quality ASSURANCE & Inspection in Computer vision market, By region,2019-2028 (USD Million)
TABLE 13 Global Positioning & Guidance in Computer vision market, By region, 2019-2028 (USD Million)
TABLE 14 Global Predictive Maintenance in Computer vision market, By region, 2019-2028 (USD Million)
TABLE 15 Global Identification in Computer vision market, By region, 2019-2028 (USD Million)
TABLE 16 Global Computer vision Market, By Vertical, 2019-2028 (USD Million)
TABLE 17 Global Industrial in Computer vision Market, By REGION, 2019-2028 (USD MILLION)
TABLE 18 Global industrial in Computer vision Market, By Vertical, 2019-2028 (USD Million)
TABLE 19 Global Non Industrial in Computer vision Market, By REGION, 2019-2028 (USD MILLION)
TABLE 20 Global non industrial in Computer vision Market, By Vertical, 2019-2028 (USD Million)
TABLE 21 Global Computer vision Market, By product, 2019-2028 (USD Million)
TABLE 22 Global Smart Cameras-Based Computer Vision Systems in Computer vision market, By region, 2019-2028 (USD Million)
TABLE 23 Global PC-Based Computer Vision Systems in Computer vision market, By region,2019-2028 (USD Million)
TABLE 24 Global computer vision market, By rEGION, 2019-2028 (USD Million)
TABLE 25 North America Computer Vision Market, By Country, 2019-2028 (USD Million)
TABLE 26 North America Computer Vision Market, By Component, 2019-2028 (USD Million)
TABLE 27 North America Software in Computer Vision Market, By Component, 2019-2028 (USD Million)
TABLE 28 North America Hardware in Computer Vision Market, By Component, 2019-2028 (USD Million)
TABLE 29 North America Cameras in Computer Vision Market, By Interface Standards, 2019-2028 (USD Million)
TABLE 30 North America Cameras in Computer Vision Market, By Frame Rate, 2019-2028 (USD Million)
TABLE 31 North America Cameras in Computer Vision Market, By Format, 2019-2028 (USD Million)
TABLE 32 North America Cameras in Computer Vision Market, By Sensor Type, 2019-2028 (USD Million)
TABLE 33 North America Processors in Computer Vision Market, By Component, 2019-2028 (USD Million)
TABLE 34 North America Computer Vision Market, By Application, 2019-2028 (USD Million)
TABLE 35 North America Computer Vision Market, By Vertical, 2019-2028 (USD Million)
TABLE 36 North America Industrial in Computer Vision Market, By Vertical, 2019-2028 (USD Million)
TABLE 37 North America Non Industrial in Computer Vision Market, By Vertical, 2019-2028 (USD Million)
TABLE 38 North America Computer Vision Market, By Product, 2019-2028 (USD Million)
TABLE 39 u.s. Computer Vision Market, By Component, 2019-2028 (USD Million)
TABLE 40 u.s. Software in Computer Vision Market, By Component, 2019-2028 (USD Million)
TABLE 41 u.s. Hardware in Computer Vision Market, By Component, 2019-2028 (USD Million)
TABLE 42 u.s. Cameras in Computer Vision Market, By Interface Standards, 2019-2028 (USD Million)
TABLE 43 u.s. Cameras in Computer Vision Market, By Frame Rate, 2019-2028 (USD Million)
TABLE 44 u.s. Cameras in Computer Vision Market, By Format, 2019-2028 (USD Million)
TABLE 45 u.s. Cameras in Computer Vision Market, By Sensor Type, 2019-2028 (USD Million)
TABLE 46 u.s. Processors in Computer Vision Market, By Component, 2019-2028 (USD Million)
TABLE 47 u.s. Computer Vision Market, By Application, 2019-2028 (USD Million)
TABLE 48 u.s. Computer Vision Market, By Vertical, 2019-2028 (USD Million)
TABLE 49 u.s. Industrial in Computer Vision Market, By Vertical, 2019-2028 (USD Million)
TABLE 50 u.s. Non Industrial in Computer Vision Market, By Vertical, 2019-2028 (USD Million)
TABLE 51 u.s. Computer Vision Market, By Product, 2019-2028 (USD Million)
TABLE 52 Canada Computer Vision Market, By Component, 2019-2028 (USD Million)
TABLE 53 Canada Software in Computer Vision Market, By Component, 2019-2028 (USD Million)
TABLE 54 Canada Hardware in Computer Vision Market, By Component, 2019-2028 (USD Million)
TABLE 55 Canada Cameras in Computer Vision Market, By Interface Standards, 2019-2028 (USD Million)
TABLE 56 Canada Cameras in Computer Vision Market, By Frame Rate, 2019-2028 (USD Million)
TABLE 57 Canada Cameras in Computer Vision Market, By Format, 2019-2028 (USD Million)
TABLE 58 Canada Cameras in Computer Vision Market, By Sensor Type, 2019-2028 (USD Million)
TABLE 59 Canada Processors in Computer Vision Market, By Component, 2019-2028 (USD Million)
TABLE 60 Canada Computer Vision Market, By Application, 2019-2028 (USD Million)
TABLE 61 Canada Computer Vision Market, By Vertical, 2019-2028 (USD Million)
TABLE 62 Canada Industrial in Computer Vision Market, By Vertical, 2019-2028 (USD Million)
TABLE 63 Canada Non Industrial in Computer Vision Market, By Vertical, 2019-2028 (USD Million)
TABLE 64 Canada Computer Vision Market, By Product, 2019-2028 (USD Million)
TABLE 65 Mexico Computer Vision Market, By Component, 2019-2028 (USD Million)
TABLE 66 Mexico Software in Computer Vision Market, By Component, 2019-2028 (USD Million)
TABLE 67 Mexico Hardware in Computer Vision Market, By Component, 2019-2028 (USD Million)
TABLE 68 Mexico Cameras in Computer Vision Market, By Interface Standards, 2019-2028 (USD Million)
TABLE 69 Mexico Cameras in Computer Vision Market, By Frame Rate, 2019-2028 (USD Million)
TABLE 70 Mexico Cameras in Computer Vision Market, By Format, 2019-2028 (USD Million)
TABLE 71 Mexico Cameras in Computer Vision Market, By Sensor Type, 2019-2028 (USD Million)
TABLE 72 Mexico Processors in Computer Vision Market, By Component, 2019-2028 (USD Million)
TABLE 73 Mexico Computer Vision Market, By Application, 2019-2028 (USD Million)
TABLE 74 Mexico Computer Vision Market, By Vertical, 2019-2028 (USD Million)
TABLE 75 Mexico Industrial in Computer Vision Market, By Vertical, 2019-2028 (USD Million)
TABLE 76 Mexico Non Industrial in Computer Vision Market, By Vertical, 2019-2028 (USD Million)
TABLE 77 Mexico Computer Vision Market, By Product, 2019-2028 (USD Million)
TABLE 78 South America Computer Vision Market, By Country, 2019-2028 (USD Million)
TABLE 79 South America Computer Vision Market, By Component, 2019-2028 (USD Million)
TABLE 80 South America Software in Computer Vision Market, By Component, 2019-2028 (USD Million)
TABLE 81 South America Hardware in Computer Vision Market, By Component, 2019-2028 (USD Million)
TABLE 82 South America Cameras in Computer Vision Market, By Interface Standards, 2019-2028 (USD Million)
TABLE 83 South America Cameras in Computer Vision Market, By Frame Rate, 2019-2028 (USD Million)
TABLE 84 South America Cameras in Computer Vision Market, By Format, 2019-2028 (USD Million)
TABLE 85 South America Cameras in Computer Vision Market, By Sensor Type, 2019-2028 (USD Million)
TABLE 86 South America Processors in Computer Vision Market, By Component, 2019-2028 (USD Million)
TABLE 87 South America Computer Vision Market, By Application, 2019-2028 (USD Million)
TABLE 88 South America Computer Vision Market, By Vertical, 2019-2028 (USD Million)
TABLE 89 South America Industrial in Computer Vision Market, By Vertical, 2019-2028 (USD Million)
TABLE 90 South America Non Industrial in Computer Vision Market, By Vertical, 2019-2028 (USD Million)
TABLE 91 South America Computer Vision Market, By Product, 2019-2028 (USD Million)
TABLE 92 Brazil Computer Vision Market, By Component, 2019-2028 (USD Million)
TABLE 93 Brazil Software in Computer Vision Market, By Component, 2019-2028 (USD Million)
TABLE 94 Brazil Hardware in Computer Vision Market, By Component, 2019-2028 (USD Million)
TABLE 95 Brazil Cameras in Computer Vision Market, By Interface Standards, 2019-2028 (USD Million)
TABLE 96 Brazil Cameras in Computer Vision Market, By Frame Rate, 2019-2028 (USD Million)
TABLE 97 Brazil Cameras in Computer Vision Market, By Format, 2019-2028 (USD Million)
TABLE 98 Brazil Cameras in Computer Vision Market, By Sensor Type, 2019-2028 (USD Million)
TABLE 99 Brazil Processors in Computer Vision Market, By Component, 2019-2028 (USD Million)
TABLE 100 Brazil Computer Vision Market, By Application, 2019-2028 (USD Million)
TABLE 101 Brazil Computer Vision Market, By Vertical, 2019-2028 (USD Million)
TABLE 102 Brazil Industrial in Computer Vision Market, By Vertical, 2019-2028 (USD Million)
TABLE 103 Brazil Non Industrial in Computer Vision Market, By Vertical, 2019-2028 (USD Million)
TABLE 104 Brazil Computer Vision Market, By Product, 2019-2028 (USD Million)
TABLE 105 Argentina Computer Vision Market, By Component, 2019-2028 (USD Million)
TABLE 106 Argentina Software in Computer Vision Market, By Component, 2019-2028 (USD Million)
TABLE 107 Argentina Hardware in Computer Vision Market, By Component, 2019-2028 (USD Million)
TABLE 108 Argentina Cameras in Computer Vision Market, By Interface Standards, 2019-2028 (USD Million)
TABLE 109 Argentina Cameras in Computer Vision Market, By Frame Rate, 2019-2028 (USD Million)
TABLE 110 Argentina Cameras in Computer Vision Market, By Format, 2019-2028 (USD Million)
TABLE 111 Argentina Cameras in Computer Vision Market, By Sensor Type, 2019-2028 (USD Million)
TABLE 112 Argentina Processors in Computer Vision Market, By Component, 2019-2028 (USD Million)
TABLE 113 Argentina Computer Vision Market, By Application, 2019-2028 (USD Million)
TABLE 114 Argentina Computer Vision Market, By Vertical, 2019-2028 (USD Million)
TABLE 115 Argentina Industrial in Computer Vision Market, By Vertical, 2019-2028 (USD Million)
TABLE 116 Argentina Non Industrial in Computer Vision Market, By Vertical, 2019-2028 (USD Million)
TABLE 117 Argentina Computer Vision Market, By Product, 2019-2028 (USD Million)
TABLE 118 Rest of South America Computer Vision Market, By Component, 2019-2028 (USD Million)
TABLE 119 Europe Computer Vision Market, By Country, 2019-2028 (USD Million)
TABLE 120 Europe Computer Vision Market, By Component, 2019-2028 (USD Million)
TABLE 121 Europe Software in Computer Vision Market, By Component, 2019-2028 (USD Million)
TABLE 122 Europe Hardware in Computer Vision Market, By Component, 2019-2028 (USD Million)
TABLE 123 Europe Cameras in Computer Vision Market, By Interface Standards, 2019-2028 (USD Million)
TABLE 124 Europe Cameras in Computer Vision Market, By Frame Rate, 2019-2028 (USD Million)
TABLE 125 Europe Cameras in Computer Vision Market, By Format, 2019-2028 (USD Million)
TABLE 126 Europe Cameras in Computer Vision Market, By Sensor Type, 2019-2028 (USD Million)
TABLE 127 Europe Processors in Computer Vision Market, By Component, 2019-2028 (USD Million)
TABLE 128 Europe Computer Vision Market, By Application, 2019-2028 (USD Million)
TABLE 129 Europe Computer Vision Market, By Vertical, 2019-2028 (USD Million)
TABLE 130 Europe Industrial in Computer Vision Market, By Vertical, 2019-2028 (USD Million)
TABLE 131 Europe Non Industrial in Computer Vision Market, By Vertical, 2019-2028 (USD Million)
TABLE 132 Europe Computer Vision Market, By Product, 2019-2028 (USD Million)
TABLE 133 U.K. Computer Vision Market, By Component, 2019-2028 (USD Million)
TABLE 134 U.K. Software in Computer Vision Market, By Component, 2019-2028 (USD Million)
TABLE 135 U.K. Hardware in Computer Vision Market, By Component, 2019-2028 (USD Million)
TABLE 136 U.K. Cameras in Computer Vision Market, By Interface Standards, 2019-2028 (USD Million)
TABLE 137 U.K. Cameras in Computer Vision Market, By Frame Rate, 2019-2028 (USD Million)
TABLE 138 U.K. Cameras in Computer Vision Market, By Format, 2019-2028 (USD Million)
TABLE 139 U.K. Cameras in Computer Vision Market, By Sensor Type, 2019-2028 (USD Million)
TABLE 140 U.K. Processors in Computer Vision Market, By Component, 2019-2028 (USD Million)
TABLE 141 U.K. Computer Vision Market, By Application, 2019-2028 (USD Million)
TABLE 142 U.K. Computer Vision Market, By Vertical, 2019-2028 (USD Million)
TABLE 143 U.K. Industrial in Computer Vision Market, By Vertical, 2019-2028 (USD Million)
TABLE 144 U.K. Non Industrial in Computer Vision Market, By Vertical, 2019-2028 (USD Million)
TABLE 145 U.K. Computer Vision Market, By Product, 2019-2028 (USD Million)
TABLE 146 Germany Computer Vision Market, By Component, 2019-2028 (USD Million)
TABLE 147 Germany Software in Computer Vision Market, By Component, 2019-2028 (USD Million)
TABLE 148 Germany Hardware in Computer Vision Market, By Component, 2019-2028 (USD Million)
TABLE 149 Germany Cameras in Computer Vision Market, By Interface Standards, 2019-2028 (USD Million)
TABLE 150 Germany Cameras in Computer Vision Market, By Frame Rate, 2019-2028 (USD Million)
TABLE 151 Germany Cameras in Computer Vision Market, By Format, 2019-2028 (USD Million)
TABLE 152 Germany Cameras in Computer Vision Market, By Sensor Type, 2019-2028 (USD Million)
TABLE 153 Germany Processors in Computer Vision Market, By Component, 2019-2028 (USD Million)
TABLE 154 Germany Computer Vision Market, By Application, 2019-2028 (USD Million)
TABLE 155 Germany Computer Vision Market, By Vertical, 2019-2028 (USD Million)
TABLE 156 Germany Industrial in Computer Vision Market, By Vertical, 2019-2028 (USD Million)
TABLE 157 Germany Non Industrial in Computer Vision Market, By Vertical, 2019-2028 (USD Million)
TABLE 158 Germany Computer Vision Market, By Product, 2019-2028 (USD Million)
TABLE 159 France Computer Vision Market, By Component, 2019-2028 (USD Million)
TABLE 160 France Software in Computer Vision Market, By Component, 2019-2028 (USD Million)
TABLE 161 France Hardware in Computer Vision Market, By Component, 2019-2028 (USD Million)
TABLE 162 France Cameras in Computer Vision Market, By Interface Standards, 2019-2028 (USD Million)
TABLE 163 France Cameras in Computer Vision Market, By Frame Rate, 2019-2028 (USD Million)
TABLE 164 France Cameras in Computer Vision Market, By Format, 2019-2028 (USD Million)
TABLE 165 France Cameras in Computer Vision Market, By Sensor Type, 2019-2028 (USD Million)
TABLE 166 France Processors in Computer Vision Market, By Component, 2019-2028 (USD Million)
TABLE 167 France Computer Vision Market, By Application, 2019-2028 (USD Million)
TABLE 168 France Computer Vision Market, By Vertical, 2019-2028 (USD Million)
TABLE 169 France Industrial in Computer Vision Market, By Vertical, 2019-2028 (USD Million)
TABLE 170 France Non Industrial in Computer Vision Market, By Vertical, 2019-2028 (USD Million)
TABLE 171 France Computer Vision Market, By Product, 2019-2028 (USD Million)
TABLE 172 Italy Computer Vision Market, By Component, 2019-2028 (USD Million)
TABLE 173 Italy Software in Computer Vision Market, By Component, 2019-2028 (USD Million)
TABLE 174 Italy Hardware in Computer Vision Market, By Component, 2019-2028 (USD Million)
TABLE 175 Italy Cameras in Computer Vision Market, By Interface Standards, 2019-2028 (USD Million)
TABLE 176 Italy Cameras in Computer Vision Market, By Frame Rate, 2019-2028 (USD Million)
TABLE 177 Italy Cameras in Computer Vision Market, By Format, 2019-2028 (USD Million)
TABLE 178 Italy Cameras in Computer Vision Market, By Sensor Type, 2019-2028 (USD Million)
TABLE 179 Italy Processors in Computer Vision Market, By Component, 2019-2028 (USD Million)
TABLE 180 Italy Computer Vision Market, By Application, 2019-2028 (USD Million)
TABLE 181 Italy Computer Vision Market, By Vertical, 2019-2028 (USD Million)
TABLE 182 Italy Industrial in Computer Vision Market, By Vertical, 2019-2028 (USD Million)
TABLE 183 Italy Non Industrial in Computer Vision Market, By Vertical, 2019-2028 (USD Million)
TABLE 184 Italy Computer Vision Market, By Product, 2019-2028 (USD Million)
TABLE 185 Spain Computer Vision Market, By Component, 2019-2028 (USD Million)
TABLE 186 Spain Software in Computer Vision Market, By Component, 2019-2028 (USD Million)
TABLE 187 Spain Hardware in Computer Vision Market, By Component, 2019-2028 (USD Million)
TABLE 188 Spain Cameras in Computer Vision Market, By Interface Standards, 2019-2028 (USD Million)
TABLE 189 Spain Cameras in Computer Vision Market, By Frame Rate, 2019-2028 (USD Million)
TABLE 190 Spain Cameras in Computer Vision Market, By Format, 2019-2028 (USD Million)
TABLE 191 Spain Cameras in Computer Vision Market, By Sensor Type, 2019-2028 (USD Million)
TABLE 192 Spain Processors in Computer Vision Market, By Component, 2019-2028 (USD Million)
TABLE 193 Spain Computer Vision Market, By Application, 2019-2028 (USD Million)
TABLE 194 Spain Computer Vision Market, By Vertical, 2019-2028 (USD Million)
TABLE 195 Spain Industrial in Computer Vision Market, By Vertical, 2019-2028 (USD Million)
TABLE 196 Spain Non Industrial in Computer Vision Market, By Vertical, 2019-2028 (USD Million)
TABLE 197 Spain Computer Vision Market, By Product, 2019-2028 (USD Million)
TABLE 198 Netherlands Computer Vision Market, By Component, 2019-2028 (USD Million)
TABLE 199 Netherlands Software in Computer Vision Market, By Component, 2019-2028 (USD Million)
TABLE 200 Netherlands Hardware in Computer Vision Market, By Component, 2019-2028 (USD Million)
TABLE 201 Netherlands Cameras in Computer Vision Market, By Interface Standards, 2019-2028 (USD Million)
TABLE 202 Netherlands Cameras in Computer Vision Market, By Frame Rate, 2019-2028 (USD Million)
TABLE 203 Netherlands Cameras in Computer Vision Market, By Format, 2019-2028 (USD Million)
TABLE 204 Netherlands Cameras in Computer Vision Market, By Sensor Type, 2019-2028 (USD Million)
TABLE 205 Netherlands Processors in Computer Vision Market, By Component, 2019-2028 (USD Million)
TABLE 206 Netherlands Computer Vision Market, By Application, 2019-2028 (USD Million)
TABLE 207 Netherlands Computer Vision Market, By Vertical, 2019-2028 (USD Million)
TABLE 208 Netherlands Industrial in Computer Vision Market, By Vertical, 2019-2028 (USD Million)
TABLE 209 Netherlands Non Industrial in Computer Vision Market, By Vertical, 2019-2028 (USD Million)
TABLE 210 Netherlands Computer Vision Market, By Product, 2019-2028 (USD Million)
TABLE 211 Switzerland Computer Vision Market, By Component, 2019-2028 (USD Million)
TABLE 212 Switzerland Software in Computer Vision Market, By Component, 2019-2028 (USD Million)
TABLE 213 Switzerland Hardware in Computer Vision Market, By Component, 2019-2028 (USD Million)
TABLE 214 Switzerland Cameras in Computer Vision Market, By Interface Standards, 2019-2028 (USD Million)
TABLE 215 Switzerland Cameras in Computer Vision Market, By Frame Rate, 2019-2028 (USD Million)
TABLE 216 Switzerland Cameras in Computer Vision Market, By Format, 2019-2028 (USD Million)
TABLE 217 Switzerland Cameras in Computer Vision Market, By Sensor Type, 2019-2028 (USD Million)
TABLE 218 Switzerland Processors in Computer Vision Market, By Component, 2019-2028 (USD Million)
TABLE 219 Switzerland Computer Vision Market, By Application, 2019-2028 (USD Million)
TABLE 220 Switzerland Computer Vision Market, By Vertical, 2019-2028 (USD Million)
TABLE 221 Switzerland Industrial in Computer Vision Market, By Vertical, 2019-2028 (USD Million)
TABLE 222 Switzerland Non Industrial in Computer Vision Market, By Vertical, 2019-2028 (USD Million)
TABLE 223 Switzerland Computer Vision Market, By Product, 2019-2028 (USD Million)
TABLE 224 Belgium Computer Vision Market, By Component, 2019-2028 (USD Million)
TABLE 225 Belgium Software in Computer Vision Market, By Component, 2019-2028 (USD Million)
TABLE 226 Belgium Hardware in Computer Vision Market, By Component, 2019-2028 (USD Million)
TABLE 227 Belgium Cameras in Computer Vision Market, By Interface Standards, 2019-2028 (USD Million)
TABLE 228 Belgium Cameras in Computer Vision Market, By Frame Rate, 2019-2028 (USD Million)
TABLE 229 Belgium Cameras in Computer Vision Market, By Format, 2019-2028 (USD Million)
TABLE 230 Belgium Cameras in Computer Vision Market, By Sensor Type, 2019-2028 (USD Million)
TABLE 231 Belgium Processors in Computer Vision Market, By Component, 2019-2028 (USD Million)
TABLE 232 Belgium Computer Vision Market, By Application, 2019-2028 (USD Million)
TABLE 233 Belgium Computer Vision Market, By Vertical, 2019-2028 (USD Million)
TABLE 234 Belgium Industrial in Computer Vision Market, By Vertical, 2019-2028 (USD Million)
TABLE 235 Belgium Non Industrial in Computer Vision Market, By Vertical, 2019-2028 (USD Million)
TABLE 236 Belgium Computer Vision Market, By Product, 2019-2028 (USD Million)
TABLE 237 Russia Computer Vision Market, By Component, 2019-2028 (USD Million)
TABLE 238 Russia Software in Computer Vision Market, By Component, 2019-2028 (USD Million)
TABLE 239 Russia Hardware in Computer Vision Market, By Component, 2019-2028 (USD Million)
TABLE 240 Russia Cameras in Computer Vision Market, By Interface Standards, 2019-2028 (USD Million)
TABLE 241 Russia Cameras in Computer Vision Market, By Frame Rate, 2019-2028 (USD Million)
TABLE 242 Russia Cameras in Computer Vision Market, By Format, 2019-2028 (USD Million)
TABLE 243 Russia Cameras in Computer Vision Market, By Sensor Type, 2019-2028 (USD Million)
TABLE 244 Russia Processors in Computer Vision Market, By Component, 2019-2028 (USD Million)
TABLE 245 Russia Computer Vision Market, By Application, 2019-2028 (USD Million)
TABLE 246 Russia Computer Vision Market, By Vertical, 2019-2028 (USD Million)
TABLE 247 Russia Industrial in Computer Vision Market, By Vertical, 2019-2028 (USD Million)
TABLE 248 Russia Non Industrial in Computer Vision Market, By Vertical, 2019-2028 (USD Million)
TABLE 249 Russia Computer Vision Market, By Product, 2019-2028 (USD Million)
TABLE 250 Turkey Computer Vision Market, By Component, 2019-2028 (USD Million)
TABLE 251 Turkey Software in Computer Vision Market, By Component, 2019-2028 (USD Million)
TABLE 252 Turkey Hardware in Computer Vision Market, By Component, 2019-2028 (USD Million)
TABLE 253 Turkey Cameras in Computer Vision Market, By Interface Standards, 2019-2028 (USD Million)
TABLE 254 Turkey Cameras in Computer Vision Market, By Frame Rate, 2019-2028 (USD Million)
TABLE 255 Turkey Cameras in Computer Vision Market, By Format, 2019-2028 (USD Million)
TABLE 256 Turkey Cameras in Computer Vision Market, By Sensor Type, 2019-2028 (USD Million)
TABLE 257 Turkey Processors in Computer Vision Market, By Component, 2019-2028 (USD Million)
TABLE 258 Turkey Computer Vision Market, By Application, 2019-2028 (USD Million)
TABLE 259 Turkey Computer Vision Market, By Vertical, 2019-2028 (USD Million)
TABLE 260 Turkey Industrial in Computer Vision Market, By Vertical, 2019-2028 (USD Million)
TABLE 261 Turkey Non Industrial in Computer Vision Market, By Vertical, 2019-2028 (USD Million)
TABLE 262 Turkey Computer Vision Market, By Product, 2019-2028 (USD Million)
TABLE 263 Rest of Europe Computer Vision Market, By Component, 2019-2028 (USD Million)
TABLE 264 Asia-Pacific Computer Vision Market, By Country, 2019-2028 (USD Million)
TABLE 265 Asia-Pacific Computer Vision Market, By Component, 2019-2028 (USD Million)
TABLE 266 Asia-Pacific Software in Computer Vision Market, By Component, 2019-2028 (USD Million)
TABLE 267 Asia-Pacific Hardware in Computer Vision Market, By Component, 2019-2028 (USD Million)
TABLE 268 Asia-Pacific Cameras in Computer Vision Market, By Interface Standards, 2019-2028 (USD Million)
TABLE 269 Asia-Pacific Cameras in Computer Vision Market, By Frame Rate, 2019-2028 (USD Million)
TABLE 270 Asia-Pacific Cameras in Computer Vision Market, By Format, 2019-2028 (USD Million)
TABLE 271 Asia-Pacific Cameras in Computer Vision Market, By Sensor Type, 2019-2028 (USD Million)
TABLE 272 Asia-Pacific Processors in Computer Vision Market, By Component, 2019-2028 (USD Million)
TABLE 273 Asia-Pacific Computer Vision Market, By Application, 2019-2028 (USD Million)
TABLE 274 Asia-Pacific Computer Vision Market, By Vertical, 2019-2028 (USD Million)
TABLE 275 Asia-Pacific Industrial in Computer Vision Market, By Vertical, 2019-2028 (USD Million)
TABLE 276 Asia-Pacific Non Industrial in Computer Vision Market, By Vertical, 2019-2028 (USD Million)
TABLE 277 Asia-Pacific Computer Vision Market, By Product, 2019-2028 (USD Million)
TABLE 278 China Computer Vision Market, By Component, 2019-2028 (USD Million)
TABLE 279 China Software in Computer Vision Market, By Component, 2019-2028 (USD Million)
TABLE 280 China Hardware in Computer Vision Market, By Component, 2019-2028 (USD Million)
TABLE 281 China Cameras in Computer Vision Market, By Interface Standards, 2019-2028 (USD Million)
TABLE 282 China Cameras in Computer Vision Market, By Frame Rate, 2019-2028 (USD Million)
TABLE 283 China Cameras in Computer Vision Market, By Format, 2019-2028 (USD Million)
TABLE 284 China Cameras in Computer Vision Market, By Sensor Type, 2019-2028 (USD Million)
TABLE 285 China Processors in Computer Vision Market, By Component, 2019-2028 (USD Million)
TABLE 286 China Computer Vision Market, By Application, 2019-2028 (USD Million)
TABLE 287 China Computer Vision Market, By Vertical, 2019-2028 (USD Million)
TABLE 288 China Industrial in Computer Vision Market, By Vertical, 2019-2028 (USD Million)
TABLE 289 China Non Industrial in Computer Vision Market, By Vertical, 2019-2028 (USD Million)
TABLE 290 China Computer Vision Market, By Product, 2019-2028 (USD Million)
TABLE 291 Japan Computer Vision Market, By Component, 2019-2028 (USD Million)
TABLE 292 Japan Software in Computer Vision Market, By Component, 2019-2028 (USD Million)
TABLE 293 Japan Hardware in Computer Vision Market, By Component, 2019-2028 (USD Million)
TABLE 294 Japan Cameras in Computer Vision Market, By Interface Standards, 2019-2028 (USD Million)
TABLE 295 Japan Cameras in Computer Vision Market, By Frame Rate, 2019-2028 (USD Million)
TABLE 296 Japan Cameras in Computer Vision Market, By Format, 2019-2028 (USD Million)
TABLE 297 Japan Cameras in Computer Vision Market, By Sensor Type, 2019-2028 (USD Million)
TABLE 298 Japan Processors in Computer Vision Market, By Component, 2019-2028 (USD Million)
TABLE 299 Japan Computer Vision Market, By Application, 2019-2028 (USD Million)
TABLE 300 Japan Computer Vision Market, By Vertical, 2019-2028 (USD Million)
TABLE 301 Japan Industrial in Computer Vision Market, By Vertical, 2019-2028 (USD Million)
TABLE 302 Japan Non Industrial in Computer Vision Market, By Vertical, 2019-2028 (USD Million)
TABLE 303 Japan Computer Vision Market, By Product, 2019-2028 (USD Million)
TABLE 304 South Korea Computer Vision Market, By Component, 2019-2028 (USD Million)
TABLE 305 South Korea Software in Computer Vision Market, By Component, 2019-2028 (USD Million)
TABLE 306 South Korea Hardware in Computer Vision Market, By Component, 2019-2028 (USD Million)
TABLE 307 South Korea Cameras in Computer Vision Market, By Interface Standards, 2019-2028 (USD Million)
TABLE 308 South Korea Cameras in Computer Vision Market, By Frame Rate, 2019-2028 (USD Million)
TABLE 309 South Korea Cameras in Computer Vision Market, By Format, 2019-2028 (USD Million)
TABLE 310 South Korea Cameras in Computer Vision Market, By Sensor Type, 2019-2028 (USD Million)
TABLE 311 South Korea Processors in Computer Vision Market, By Component, 2019-2028 (USD Million)
TABLE 312 South Korea Computer Vision Market, By Application, 2019-2028 (USD Million)
TABLE 313 South Korea Computer Vision Market, By Vertical, 2019-2028 (USD Million)
TABLE 314 South Korea Industrial in Computer Vision Market, By Vertical, 2019-2028 (USD Million)
TABLE 315 South Korea Non Industrial in Computer Vision Market, By Vertical, 2019-2028 (USD Million)
TABLE 316 South Korea Computer Vision Market, By Product, 2019-2028 (USD Million)
TABLE 317 India Computer Vision Market, By Component, 2019-2028 (USD Million)
TABLE 318 India Software in Computer Vision Market, By Component, 2019-2028 (USD Million)
TABLE 319 India Hardware in Computer Vision Market, By Component, 2019-2028 (USD Million)
TABLE 320 India Cameras in Computer Vision Market, By Interface Standards, 2019-2028 (USD Million)
TABLE 321 India Cameras in Computer Vision Market, By Frame Rate, 2019-2028 (USD Million)
TABLE 322 India Cameras in Computer Vision Market, By Format, 2019-2028 (USD Million)
TABLE 323 India Cameras in Computer Vision Market, By Sensor Type, 2019-2028 (USD Million)
TABLE 324 India Processors in Computer Vision Market, By Component, 2019-2028 (USD Million)
TABLE 325 India Computer Vision Market, By Application, 2019-2028 (USD Million)
TABLE 326 India Computer Vision Market, By Vertical, 2019-2028 (USD Million)
TABLE 327 India Industrial in Computer Vision Market, By Vertical, 2019-2028 (USD Million)
TABLE 328 India Non Industrial in Computer Vision Market, By Vertical, 2019-2028 (USD Million)
TABLE 329 India Computer Vision Market, By Product, 2019-2028 (USD Million)
TABLE 330 Australia Computer Vision Market, By Component, 2019-2028 (USD Million)
TABLE 331 Australia Software in Computer Vision Market, By Component, 2019-2028 (USD Million)
TABLE 332 Australia Hardware in Computer Vision Market, By Component, 2019-2028 (USD Million)
TABLE 333 Australia Cameras in Computer Vision Market, By Interface Standards, 2019-2028 (USD Million)
TABLE 334 Australia Cameras in Computer Vision Market, By Frame Rate, 2019-2028 (USD Million)
TABLE 335 Australia Cameras in Computer Vision Market, By Format, 2019-2028 (USD Million)
TABLE 336 Australia Cameras in Computer Vision Market, By Sensor Type, 2019-2028 (USD Million)
TABLE 337 Australia Processors in Computer Vision Market, By Component, 2019-2028 (USD Million)
TABLE 338 Australia Computer Vision Market, By Application, 2019-2028 (USD Million)
TABLE 339 Australia Computer Vision Market, By Vertical, 2019-2028 (USD Million)
TABLE 340 Australia Industrial in Computer Vision Market, By Vertical, 2019-2028 (USD Million)
TABLE 341 Australia Non Industrial in Computer Vision Market, By Vertical, 2019-2028 (USD Million)
TABLE 342 Australia Computer Vision Market, By Product, 2019-2028 (USD Million)
TABLE 343 Singapore Computer Vision Market, By Component, 2019-2028 (USD Million)
TABLE 344 Singapore Software in Computer Vision Market, By Component, 2019-2028 (USD Million)
TABLE 345 Singapore Hardware in Computer Vision Market, By Component, 2019-2028 (USD Million)
TABLE 346 Singapore Cameras in Computer Vision Market, By Interface Standards, 2019-2028 (USD Million)
TABLE 347 Singapore Cameras in Computer Vision Market, By Frame Rate, 2019-2028 (USD Million)
TABLE 348 Singapore Cameras in Computer Vision Market, By Format, 2019-2028 (USD Million)
TABLE 349 Singapore Cameras in Computer Vision Market, By Sensor Type, 2019-2028 (USD Million)
TABLE 350 Singapore Processors in Computer Vision Market, By Component, 2019-2028 (USD Million)
TABLE 351 Singapore Computer Vision Market, By Application, 2019-2028 (USD Million)
TABLE 352 Singapore Computer Vision Market, By Vertical, 2019-2028 (USD Million)
TABLE 353 Singapore Industrial in Computer Vision Market, By Vertical, 2019-2028 (USD Million)
TABLE 354 Singapore Non Industrial in Computer Vision Market, By Vertical, 2019-2028 (USD Million)
TABLE 355 Singapore Computer Vision Market, By Product, 2019-2028 (USD Million)
TABLE 356 Indonesia Computer Vision Market, By Component, 2019-2028 (USD Million)
TABLE 357 Indonesia Software in Computer Vision Market, By Component, 2019-2028 (USD Million)
TABLE 358 Indonesia Hardware in Computer Vision Market, By Component, 2019-2028 (USD Million)
TABLE 359 Indonesia Cameras in Computer Vision Market, By Interface Standards, 2019-2028 (USD Million)
TABLE 360 Indonesia Cameras in Computer Vision Market, By Frame Rate, 2019-2028 (USD Million)
TABLE 361 Indonesia Cameras in Computer Vision Market, By Format, 2019-2028 (USD Million)
TABLE 362 Indonesia Cameras in Computer Vision Market, By Sensor Type, 2019-2028 (USD Million)
TABLE 363 Indonesia Processors in Computer Vision Market, By Component, 2019-2028 (USD Million)
TABLE 364 Indonesia Computer Vision Market, By Application, 2019-2028 (USD Million)
TABLE 365 Indonesia Computer Vision Market, By Vertical, 2019-2028 (USD Million)
TABLE 366 Indonesia Industrial in Computer Vision Market, By Vertical, 2019-2028 (USD Million)
TABLE 367 Indonesia Non Industrial in Computer Vision Market, By Vertical, 2019-2028 (USD Million)
TABLE 368 Indonesia Computer Vision Market, By Product, 2019-2028 (USD Million)
TABLE 369 Malaysia Computer Vision Market, By Component, 2019-2028 (USD Million)
TABLE 370 Malaysia Software in Computer Vision Market, By Component, 2019-2028 (USD Million)
TABLE 371 Malaysia Hardware in Computer Vision Market, By Component, 2019-2028 (USD Million)
TABLE 372 Malaysia Cameras in Computer Vision Market, By Interface Standards, 2019-2028 (USD Million)
TABLE 373 Malaysia Cameras in Computer Vision Market, By Frame Rate, 2019-2028 (USD Million)
TABLE 374 Malaysia Cameras in Computer Vision Market, By Format, 2019-2028 (USD Million)
TABLE 375 Malaysia Cameras in Computer Vision Market, By Sensor Type, 2019-2028 (USD Million)
TABLE 376 Malaysia Processors in Computer Vision Market, By Component, 2019-2028 (USD Million)
TABLE 377 Malaysia Computer Vision Market, By Application, 2019-2028 (USD Million)
TABLE 378 Malaysia Computer Vision Market, By Vertical, 2019-2028 (USD Million)
TABLE 379 Malaysia Industrial in Computer Vision Market, By Vertical, 2019-2028 (USD Million)
TABLE 380 Malaysia Non Industrial in Computer Vision Market, By Vertical, 2019-2028 (USD Million)
TABLE 381 Malaysia Computer Vision Market, By Product, 2019-2028 (USD Million)
TABLE 382 Thailand Computer Vision Market, By Component, 2019-2028 (USD Million)
TABLE 383 Thailand Software in Computer Vision Market, By Component, 2019-2028 (USD Million)
TABLE 384 Thailand Hardware in Computer Vision Market, By Component, 2019-2028 (USD Million)
TABLE 385 Thailand Cameras in Computer Vision Market, By Interface Standards, 2019-2028 (USD Million)
TABLE 386 Thailand Cameras in Computer Vision Market, By Frame Rate, 2019-2028 (USD Million)
TABLE 387 Thailand Cameras in Computer Vision Market, By Format, 2019-2028 (USD Million)
TABLE 388 Thailand Cameras in Computer Vision Market, By Sensor Type, 2019-2028 (USD Million)
TABLE 389 Thailand Processors in Computer Vision Market, By Component, 2019-2028 (USD Million)
TABLE 390 Thailand Computer Vision Market, By Application, 2019-2028 (USD Million)
TABLE 391 Thailand Computer Vision Market, By Vertical, 2019-2028 (USD Million)
TABLE 392 Thailand Industrial in Computer Vision Market, By Vertical, 2019-2028 (USD Million)
TABLE 393 Thailand Non Industrial in Computer Vision Market, By Vertical, 2019-2028 (USD Million)
TABLE 394 Thailand Computer Vision Market, By Product, 2019-2028 (USD Million)
TABLE 395 Philippines Computer Vision Market, By Component, 2019-2028 (USD Million)
TABLE 396 Philippines Software in Computer Vision Market, By Component, 2019-2028 (USD Million)
TABLE 397 Philippines Hardware in Computer Vision Market, By Component, 2019-2028 (USD Million)
TABLE 398 Philippines Cameras in Computer Vision Market, By Interface Standards, 2019-2028 (USD Million)
TABLE 399 Philippines Cameras in Computer Vision Market, By Frame Rate, 2019-2028 (USD Million)
TABLE 400 Philippines Cameras in Computer Vision Market, By Format, 2019-2028 (USD Million)
TABLE 401 Philippines Cameras in Computer Vision Market, By Sensor Type, 2019-2028 (USD Million)
TABLE 402 Philippines Processors in Computer Vision Market, By Component, 2019-2028 (USD Million)
TABLE 403 Philippines Computer Vision Market, By Application, 2019-2028 (USD Million)
TABLE 404 Philippines Computer Vision Market, By Vertical, 2019-2028 (USD Million)
TABLE 405 Philippines Industrial in Computer Vision Market, By Vertical, 2019-2028 (USD Million)
TABLE 406 Philippines Non Industrial in Computer Vision Market, By Vertical, 2019-2028 (USD Million)
TABLE 407 Philippines Computer Vision Market, By Product, 2019-2028 (USD Million)
TABLE 408 Rest of Asia-Pacific Computer Vision Market, By Component, 2019-2028 (USD Million)
TABLE 409 Middle East & Africa Computer Vision Market, By Country, 2019-2028 (USD Million)
TABLE 410 Middle East & Africa Computer Vision Market, By Component, 2019-2028 (USD Million)
TABLE 411 Middle East & Africa Software in Computer Vision Market, By Component, 2019-2028 (USD Million)
TABLE 412 Middle East & Africa Hardware in Computer Vision Market, By Component, 2019-2028 (USD Million)
TABLE 413 Middle East & Africa Cameras in Computer Vision Market, By Interface Standards, 2019-2028 (USD Million)
TABLE 414 Middle East & Africa Cameras in Computer Vision Market, By Frame Rate, 2019-2028 (USD Million)
TABLE 415 Middle East & Africa Cameras in Computer Vision Market, By Format, 2019-2028 (USD Million)
TABLE 416 Middle East & Africa Cameras in Computer Vision Market, By Sensor Type, 2019-2028 (USD Million)
TABLE 417 Middle East & Africa Processors in Computer Vision Market, By Component, 2019-2028 (USD Million)
TABLE 418 Middle East & Africa Computer Vision Market, By Application, 2019-2028 (USD Million)
TABLE 419 Middle East & Africa Computer Vision Market, By Vertical, 2019-2028 (USD Million)
TABLE 420 Middle East & Africa Industrial in Computer Vision Market, By Vertical, 2019-2028 (USD Million)
TABLE 421 Middle East & Africa Non Industrial in Computer Vision Market, By Vertical, 2019-2028 (USD Million)
TABLE 422 Middle East & Africa Computer Vision Market, By Product, 2019-2028 (USD Million)
TABLE 423 Saudi Arabia Computer Vision Market, By Component, 2019-2028 (USD Million)
TABLE 424 Saudi Arabia Software in Computer Vision Market, By Component, 2019-2028 (USD Million)
TABLE 425 Saudi Arabia Hardware in Computer Vision Market, By Component, 2019-2028 (USD Million)
TABLE 426 Saudi Arabia Cameras in Computer Vision Market, By Interface Standards, 2019-2028 (USD Million)
TABLE 427 Saudi Arabia Cameras in Computer Vision Market, By Frame Rate, 2019-2028 (USD Million)
TABLE 428 Saudi Arabia Cameras in Computer Vision Market, By Format, 2019-2028 (USD Million)
TABLE 429 Saudi Arabia Cameras in Computer Vision Market, By Sensor Type, 2019-2028 (USD Million)
TABLE 430 Saudi Arabia Processors in Computer Vision Market, By Component, 2019-2028 (USD Million)
TABLE 431 Saudi Arabia Computer Vision Market, By Application, 2019-2028 (USD Million)
TABLE 432 Saudi Arabia Computer Vision Market, By Vertical, 2019-2028 (USD Million)
TABLE 433 Saudi Arabia Industrial in Computer Vision Market, By Vertical, 2019-2028 (USD Million)
TABLE 434 Saudi Arabia Non Industrial in Computer Vision Market, By Vertical, 2019-2028 (USD Million)
TABLE 435 Saudi Arabia Computer Vision Market, By Product, 2019-2028 (USD Million)
TABLE 436 U.A.E. Computer Vision Market, By Component, 2019-2028 (USD Million)
TABLE 437 U.A.E. Software in Computer Vision Market, By Component, 2019-2028 (USD Million)
TABLE 438 U.A.E. Hardware in Computer Vision Market, By Component, 2019-2028 (USD Million)
TABLE 439 U.A.E. Cameras in Computer Vision Market, By Interface Standards, 2019-2028 (USD Million)
TABLE 440 U.A.E. Cameras in Computer Vision Market, By Frame Rate, 2019-2028 (USD Million)
TABLE 441 U.A.E. Cameras in Computer Vision Market, By Format, 2019-2028 (USD Million)
TABLE 442 U.A.E. Cameras in Computer Vision Market, By Sensor Type, 2019-2028 (USD Million)
TABLE 443 U.A.E. Processors in Computer Vision Market, By Component, 2019-2028 (USD Million)
TABLE 444 U.A.E. Computer Vision Market, By Application, 2019-2028 (USD Million)
TABLE 445 U.A.E. Computer Vision Market, By Vertical, 2019-2028 (USD Million)
TABLE 446 U.A.E. Industrial in Computer Vision Market, By Vertical, 2019-2028 (USD Million)
TABLE 447 U.A.E. Non Industrial in Computer Vision Market, By Vertical, 2019-2028 (USD Million)
TABLE 448 U.A.E. Computer Vision Market, By Product, 2019-2028 (USD Million)
TABLE 449 Israel Computer Vision Market, By Component, 2019-2028 (USD Million)
TABLE 450 Israel Software in Computer Vision Market, By Component, 2019-2028 (USD Million)
TABLE 451 Israel Hardware in Computer Vision Market, By Component, 2019-2028 (USD Million)
TABLE 452 Israel Cameras in Computer Vision Market, By Interface Standards, 2019-2028 (USD Million)
TABLE 453 Israel Cameras in Computer Vision Market, By Frame Rate, 2019-2028 (USD Million)
TABLE 454 Israel Cameras in Computer Vision Market, By Format, 2019-2028 (USD Million)
TABLE 455 Israel Cameras in Computer Vision Market, By Sensor Type, 2019-2028 (USD Million)
TABLE 456 Israel Processors in Computer Vision Market, By Component, 2019-2028 (USD Million)
TABLE 457 Israel Computer Vision Market, By Application, 2019-2028 (USD Million)
TABLE 458 Israel Computer Vision Market, By Vertical, 2019-2028 (USD Million)
TABLE 459 Israel Industrial in Computer Vision Market, By Vertical, 2019-2028 (USD Million)
TABLE 460 Israel Non Industrial in Computer Vision Market, By Vertical, 2019-2028 (USD Million)
TABLE 461 Israel Computer Vision Market, By Product, 2019-2028 (USD Million)
TABLE 462 South Africa Computer Vision Market, By Component, 2019-2028 (USD Million)
TABLE 463 South Africa Software in Computer Vision Market, By Component, 2019-2028 (USD Million)
TABLE 464 South Africa Hardware in Computer Vision Market, By Component, 2019-2028 (USD Million)
TABLE 465 South Africa Cameras in Computer Vision Market, By Interface Standards, 2019-2028 (USD Million)
TABLE 466 South Africa Cameras in Computer Vision Market, By Frame Rate, 2019-2028 (USD Million)
TABLE 467 South Africa Cameras in Computer Vision Market, By Format, 2019-2028 (USD Million)
TABLE 468 South Africa Cameras in Computer Vision Market, By Sensor Type, 2019-2028 (USD Million)
TABLE 469 South Africa Processors in Computer Vision Market, By Component, 2019-2028 (USD Million)
TABLE 470 South Africa Computer Vision Market, By Application, 2019-2028 (USD Million)
TABLE 471 South Africa Computer Vision Market, By Vertical, 2019-2028 (USD Million)
TABLE 472 South Africa Industrial in Computer Vision Market, By Vertical, 2019-2028 (USD Million)
TABLE 473 South Africa Non Industrial in Computer Vision Market, By Vertical, 2019-2028 (USD Million)
TABLE 474 South Africa Computer Vision Market, By Product, 2019-2028 (USD Million)
TABLE 475 Egypt Computer Vision Market, By Component, 2019-2028 (USD Million)
TABLE 476 Egypt Software in Computer Vision Market, By Component, 2019-2028 (USD Million)
TABLE 477 Egypt Hardware in Computer Vision Market, By Component, 2019-2028 (USD Million)
TABLE 478 Egypt Cameras in Computer Vision Market, By Interface Standards, 2019-2028 (USD Million)
TABLE 479 Egypt Cameras in Computer Vision Market, By Frame Rate, 2019-2028 (USD Million)
TABLE 480 Egypt Cameras in Computer Vision Market, By Format, 2019-2028 (USD Million)
TABLE 481 Egypt Cameras in Computer Vision Market, By Sensor Type, 2019-2028 (USD Million)
TABLE 482 Egypt Processors in Computer Vision Market, By Component, 2019-2028 (USD Million)
TABLE 483 Egypt Computer Vision Market, By Application, 2019-2028 (USD Million)
TABLE 484 Egypt Computer Vision Market, By Vertical, 2019-2028 (USD Million)
TABLE 485 Egypt Industrial in Computer Vision Market, By Vertical, 2019-2028 (USD Million)
TABLE 486 Egypt Non Industrial in Computer Vision Market, By Vertical, 2019-2028 (USD Million)
TABLE 487 Egypt Computer Vision Market, By Product, 2019-2028 (USD Million)
TABLE 488 Rest of Middle East and Africa Computer Vision Market, By Component, 2019-2028 (USD Million)
Abbildungsverzeichnis
FIGURE 1 GLOBAL COMPUTER VISION MARKET: segmentation
FIGURE 2 Global computer vision market: data triangulation
FIGURE 3 Global computer vision market: DROC ANALYSIS
FIGURE 4 Global computer vision market: GLOBAL VS REGIONAL MARKET ANALYSIS
FIGURE 5 Global COMPUTER VISION market: COMPANY RESEARCH ANALYSIS
FIGURE 6 Global COMPUTER VISION market: INTERVIEW DEMOGRAPHICS
FIGURE 7 Global COMPUTER VISION market: DBMR MARKET POSITION GRID
FIGURE 8 Global computer vision market: vendor share analysis
FIGURE 9 GLOBAL computer vision Market: MARKET APPLICATION COVERAGE GRID
FIGURE 10 Global computer vision market: SEGMENTATION
FIGURE 11 Rising adoption of AI using computer vision is EXPECTED TO DRIVE GLOBAL computer vision MARKET IN THE FORECAST PERIOD OF 2021 TO 2028
FIGURE 12 hardware segment is expected to account for the largest share of Global computer vision market in 2021 & 2028
FIGURE 13 North America is expected to DOMINATE THE global computer vision mARKET and growing with the highest cagr IN the forecast period of 2021 to 2028
FIGURE 14 north america is the fastest growing market for computer vision manufacturers in the forecast period of 2021 to 2028
FIGURE 15 DRIVERS, RESTRAINTS, OPPORTUNITIES, AND CHALLENGES OF global computer vision Market
FIGURE 16 Global computer vision MARKET, BY Component, 2020
FIGURE 17 Global Computer vision MARKET, BY Application, 2020
FIGURE 18 Global Computer vision MARKET, BY Vertical, 2020
FIGURE 19 Global Computer vision MARKET: BY product, 2020
FIGURE 20 Global Computer Vision market: SNAPSHOT (2020)
FIGURE 21 Global Computer Vision market: by region (2020)
FIGURE 22 Global Computer Vision market: by Region (2021 & 2028)
FIGURE 23 Global Computer Vision market: by region (2020 & 2028)
FIGURE 24 Global Computer Vision market: by component (2021-2028)
FIGURE 25 NORTH AMERICA computer vision MARKET: SNAPSHOT (2020)
FIGURE 26 NORTH AMERICA computer vision MARKET: by Country (2020)
FIGURE 27 NORTH AMERICA computer vision MARKET: by Country (2021 & 2028)
FIGURE 28 NORTH AMERICA computer vision MARKET: by Country (2020 & 2028)
FIGURE 29 NORTH AMERICA computer vision MARKET: BY COMPONENT (2021-2028)
FIGURE 30 South AMERICA computer vision MARKET: SNAPSHOT (2020)
FIGURE 31 South AMERICA computer vision MARKET: by Country (2020)
FIGURE 32 South AMERICA computer vision MARKET: by Country (2021 & 2028)
FIGURE 33 South AMERICA computer vision MARKET: by Country (2020 & 2028)
FIGURE 34 South AMERICA computer vision MARKET: BY COMPONENT(2021-2028)
FIGURE 35 Europe computer vision MARKET: SNAPSHOT (2020)
FIGURE 36 Europe computer vision MARKET: by Country (2020)
FIGURE 37 Europe computer vision MARKET: by Country (2021 & 2028)
FIGURE 38 Europe computer vision MARKET: by Country (2020 & 2028)
FIGURE 39 EUROPE COMPUTER vision MARKET: BY COMPONENT (2021-2028)
FIGURE 40 Asia-Pacific computer vision MARKET: SNAPSHOT (2020)
FIGURE 41 Asia-Pacific computer vision MARKET: by Country (2020)
FIGURE 42 Asia-Pacific computer vision MARKET: by Country (2021 & 2028)
FIGURE 43 Asia-Pacific computer vision MARKET: by Country (2020 & 2028)
FIGURE 44 Asia-Pacific COMPUTER vision MARKET: BY COMPONENT (2021-2028)
FIGURE 45 Middle East & Africa computer vision MARKET: SNAPSHOT (2020)
FIGURE 46 Middle East & Africa computer vision MARKET: by Country (2020)
FIGURE 47 Middle East & Africa computer vision MARKET: by Country (2021 & 2028)
FIGURE 48 Middle East & Africa computer vision MARKET: by Country (2020 & 2028)
FIGURE 49 Middle East & Africa COMPUTER vision MARKET: BY COMPONENT(2021-2028)
FIGURE 50 global Computer Vision Market: company share 2020 (%)
FIGURE 51 NORTH AMERICA Computer Vision Market: company share 2020 (%)
FIGURE 52 Europe Computer Vision Market: company share 2020 (%)
FIGURE 53 Asia-Pacific Computer Vision Market: company share 2020 (%)

Forschungsmethodik
Die Datenerfassung und Basisjahresanalyse werden mithilfe von Datenerfassungsmodulen mit großen Stichprobengrößen durchgeführt. Die Phase umfasst das Erhalten von Marktinformationen oder verwandten Daten aus verschiedenen Quellen und Strategien. Sie umfasst die Prüfung und Planung aller aus der Vergangenheit im Voraus erfassten Daten. Sie umfasst auch die Prüfung von Informationsinkonsistenzen, die in verschiedenen Informationsquellen auftreten. Die Marktdaten werden mithilfe von marktstatistischen und kohärenten Modellen analysiert und geschätzt. Darüber hinaus sind Marktanteilsanalyse und Schlüsseltrendanalyse die wichtigsten Erfolgsfaktoren im Marktbericht. Um mehr zu erfahren, fordern Sie bitte einen Analystenanruf an oder geben Sie Ihre Anfrage ein.
Die wichtigste Forschungsmethodik, die vom DBMR-Forschungsteam verwendet wird, ist die Datentriangulation, die Data Mining, die Analyse der Auswirkungen von Datenvariablen auf den Markt und die primäre (Branchenexperten-)Validierung umfasst. Zu den Datenmodellen gehören ein Lieferantenpositionierungsraster, eine Marktzeitlinienanalyse, ein Marktüberblick und -leitfaden, ein Firmenpositionierungsraster, eine Patentanalyse, eine Preisanalyse, eine Firmenmarktanteilsanalyse, Messstandards, eine globale versus eine regionale und Lieferantenanteilsanalyse. Um mehr über die Forschungsmethodik zu erfahren, senden Sie eine Anfrage an unsere Branchenexperten.
Anpassung möglich
Data Bridge Market Research ist ein führendes Unternehmen in der fortgeschrittenen formativen Forschung. Wir sind stolz darauf, unseren bestehenden und neuen Kunden Daten und Analysen zu bieten, die zu ihren Zielen passen. Der Bericht kann angepasst werden, um Preistrendanalysen von Zielmarken, Marktverständnis für zusätzliche Länder (fordern Sie die Länderliste an), Daten zu klinischen Studienergebnissen, Literaturübersicht, Analysen des Marktes für aufgearbeitete Produkte und Produktbasis einzuschließen. Marktanalysen von Zielkonkurrenten können von technologiebasierten Analysen bis hin zu Marktportfoliostrategien analysiert werden. Wir können so viele Wettbewerber hinzufügen, wie Sie Daten in dem von Ihnen gewünschten Format und Datenstil benötigen. Unser Analystenteam kann Ihnen auch Daten in groben Excel-Rohdateien und Pivot-Tabellen (Fact Book) bereitstellen oder Sie bei der Erstellung von Präsentationen aus den im Bericht verfügbaren Datensätzen unterstützen.