美国皮革家具市场,按类别(全粒面、头层粒面、真皮、双面布、粘合和合成)、表面处理(苯胺、半苯胺、刷色、去粒面、模切、压花、手工、金属、纳帕、磨砂、油性、漆皮、绒面、蜡质和其他)、产品(沙发、椅子、豆袋、转角沙发、躺椅、凳子、脚凳、坐垫、桌子、脚凳和其他)、分销渠道(电子商务、B2B、第三方分销商和其他)、应用(住宅和商业)划分 - 行业趋势和预测到 2029 年
市场分析和规模
皮革是最耐用的材质,用于大多数家具装饰。皮革家具被广泛用于为空间带来美感。它被视为奢侈品,展示人们的品位和标准。皮革家具比棉质或织物家具更坚固,可以使用多年。皮革家具可以用抹布和除尘快速清洁,这增加了其在市场上的需求。


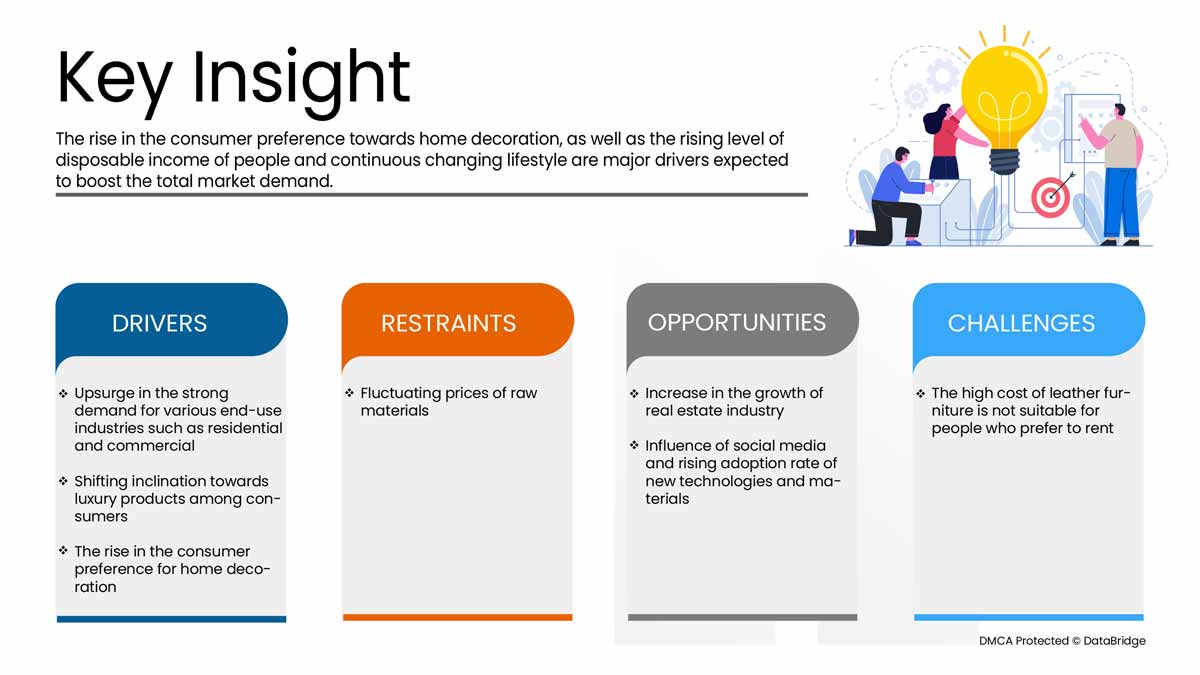
消费者对家居装饰的偏好上升、人们可支配收入的增加以及生活方式的不断变化预计将推动美国皮革家具市场的需求。然而,原材料价格的波动可能会进一步制约市场的增长。
房地产行业增长加速、社交媒体影响力以及新技术和新材料采用率上升等几个助推因素预计将为美国皮革家具市场创造机会。然而,皮革家具的高成本并不适合喜欢租房的人,并且很可能在预测期内对市场的增长构成挑战。
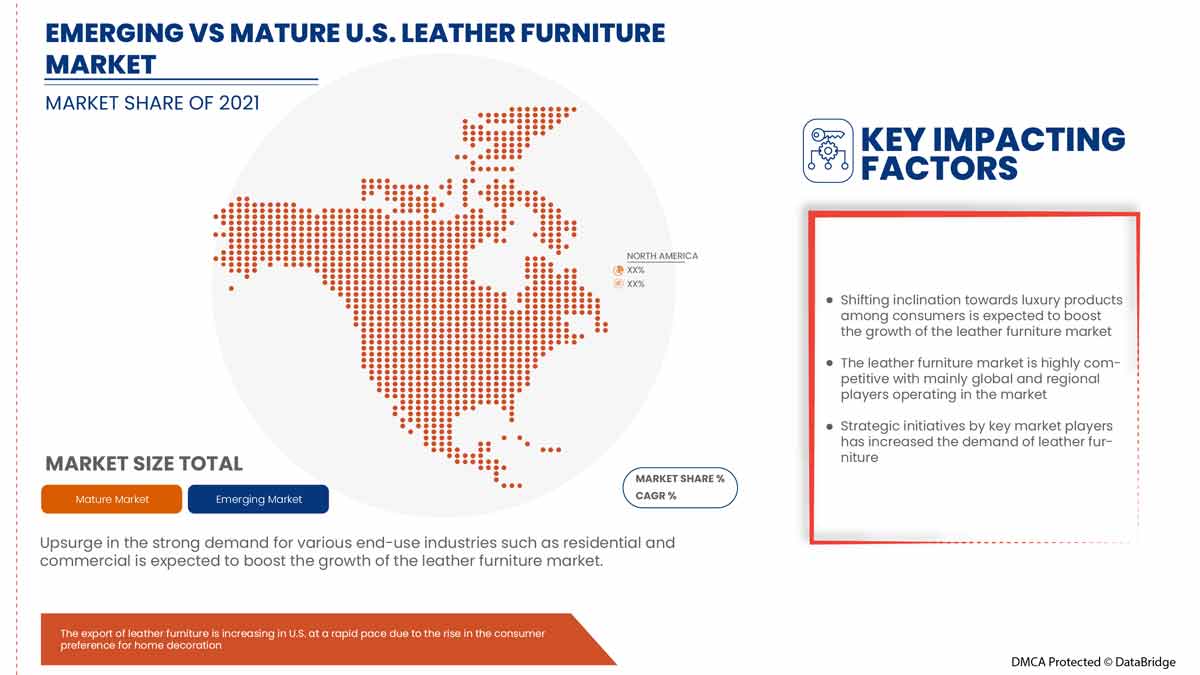
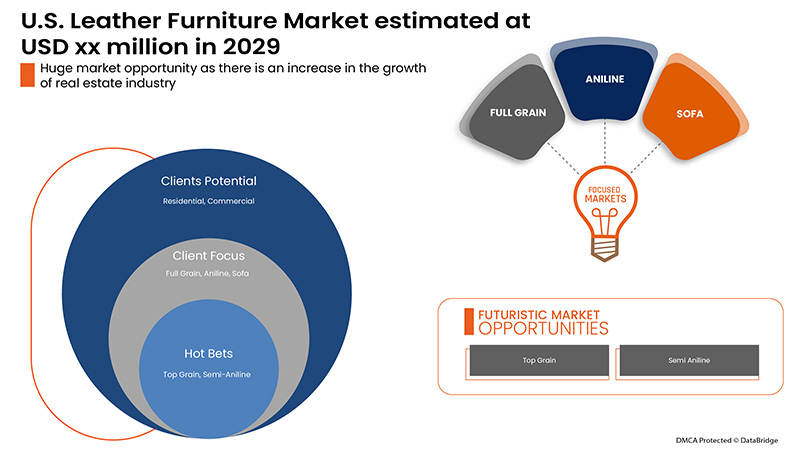
Data Bridge Market Research 分析称,预计到 2029 年,美国皮革家具市场规模将达到 133.8368 亿美元,预测期内复合年增长率为 7.3%。由于房地产行业的崛起,“住宅”是相应市场中最突出的应用领域。Data Bridge Market Research 团队策划的市场报告包括深入的专家分析、进出口分析、定价分析、生产消费分析和气候链情景。
|
报告指标 |
细节 |
|
预测期 |
2022 至 2029 年 |
|
基准年 |
2021 |
|
历史岁月 |
2020(可定制至 2019 - 2014) |
|
定量单位 |
收入(百万美元)、销量(单位)、定价(美元) |
|
涵盖的领域 |
按类别(全粒面、头层粒面、真皮、双面胶、粘合和合成)、表面处理(苯胺、半苯胺、刷色、磨砂、模切、压花、手工、金属、纳帕、磨砂、油性、漆皮、绒面、蜡质和其他)、产品(沙发、椅子、豆袋、转角沙发、躺椅、凳子、脚凳、坐垫、桌子、脚凳和其他)、分销渠道(电子商务、B2B、第三方分销商和其他)、应用(住宅和商业) |
|
覆盖国家 |
我们 |
|
涵盖的市场参与者 |
Norwalk、Rowe Furniture、NELLA VETRINA、DOMICILE FURNITURE 等 |
市场定义
皮革家具是一种合成家具,包括椅子、沙发、豆袋、躺椅、桌子、坐垫和凳子等。由于消费者越来越喜欢用合适的家具装饰家居,皮革家具的需求量很大。皮革家具被视为豪华家具。豪华家具由可移动部件组成,展示了特定时代最精湛的工艺和设计。高品质皮革家具可以保持其形状和外观多年。
监管框架
- 根据联邦贸易委员会 16 CFR 第 24 部分,皮革指南针对有关某些皮革和仿皮产品的成分和特性的虚假陈述,并规定应对看似皮革但实际上不是皮革的材料披露非皮革含量。
美国皮革家具市场的市场动态包括:

驱动因素/机遇
- 消费者对家居装饰的偏好上升
人们认为家居装饰可以提升他们的价值观、抱负和品味。为家庭或办公室带来美感,使其在个人、精神和审美上令人愉悦。改善家庭、办公室和其他区域的美感包括翻新;添加镜子、家具等可以为空间或区域增添生机,舒缓眼睛和心灵。它有助于改变坏心情,给人一种平静和放松的感觉,这被认为是实际健康的关键原因之一,也是美学目的的附加物。因此,人们对家居装饰和家居用品的认识不断提高,预计将在未来几年推动市场发展。
- 人民可支配收入水平不断提高,生活方式不断改变
消费者可支配收入的增加和城市化导致大城市的生活成本高昂。因此,共享生活空间的概念应运而生,增加了对节省空间的理念(如皮革家具)的需求。因此,由于消费者可支配收入的增加和城市化,生活水平的提高预计将扩大美国皮革家具市场。
- 消费者对奢侈品的倾向转变
人们在为自己的家购买奢侈品或家具时非常谨慎。他们倾向于追求质量和舒适度,而不考虑他们的储蓄和收入。由于购买豪华家具的诸多好处,人们的购买决策得到了改善。人们非常重视客厅、厨房、卧室甚至后院家具的颜色、形状、面料和装饰。高端豪华家具为家居增添了永恒的魅力。在专业建议的帮助下,人们可以获得有关适合其空间的家具的更好建议。
- 住宅和商业等各种终端行业的需求强劲增长
住宅和商业行业战略性地使用皮革家具来提供更好的装饰。在大多数情况下,皮革家具或移动皮革家具被伪装成小型会议室中的时尚橱柜,可以在需要时将其拉下,从而增加用于多种用途的空间。住宅和商业等各种终端用途行业的建筑活动增加将为家具行业带来增长机会。这些行业中皮革家具安装量的增加预计将推动市场的发展。
限制/挑战
- 原材料价格波动
企业很难正确判断原材料成本大幅波动的风险。如果他们只是微不足道地、延迟或过于保守地转移成本增加,或者原材料成本增加和销售价格下降同时发生,那么盈利能力下降是不可避免的。原材料成本大幅波动和价格管理不力会严重危及企业的成功。此外,全球贸易增加、城市化、运输需求和市场趋势波动进一步给家具制造所需的中间商成本带来压力。因此,生产原材料成本的变化可能会成为市场制约因素。
- 皮革家具价格高,不适合租房的人
有些人喜欢在搬家时搬运皮革家具,但这个过程很繁琐,可能需要一队工人,花费不菲。此外,定制皮革家具是根据公寓的可用空间制作的。并非每间公寓都有相同的空间和高度,这可能会使搬运皮革家具变得更加困难。因此,大多数租房居住的人不喜欢购买皮革家具,因为如果不支付额外的搬运、拆卸和安装费用,就很难搬运皮革家具。因此,皮革家具不适合租房居住的人。考虑到高昂的生活成本,大多数人更喜欢住在租房或合租公寓中,以分摊费用。因此,这对市场来说是一个挑战。
COVID-19 对美国皮革家具市场影响甚微
2020-2021 年, COVID-19影响了各个制造业,导致工作场所关闭、供应链中断和运输限制。然而,由于疫苗和必需品的进出口导致对皮革家具的需求增加,因此他们的美国皮革家具业务和供应链并未受到重大影响。消费者日益增长的需求促进了美国皮革家具市场的增长。
近期发展
- 2021 年 9 月,诺沃克在即将上市的拉斯维加斯市场上推出了六款高度耐用且时尚的皮革内饰系列。这将有助于该公司提升其品牌价值并吸引拉斯维加斯的客户。
美国皮革家具市场范围
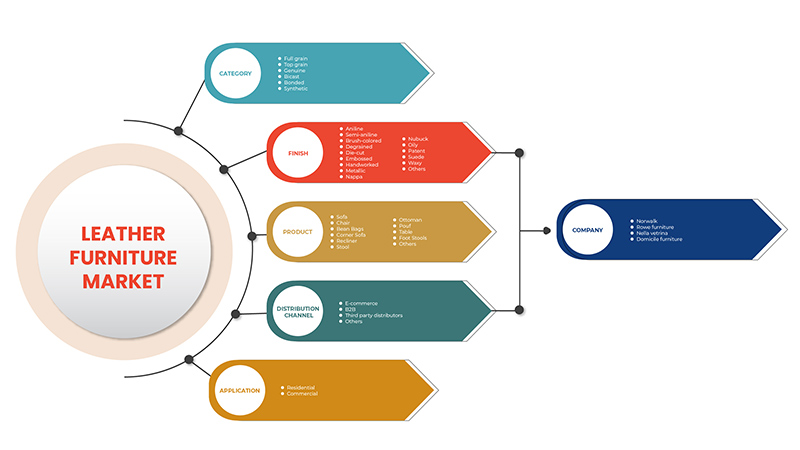
美国皮革家具市场根据类别、表面处理、产品、分销渠道和应用进行细分。这些细分市场之间的增长情况将帮助您分析行业中增长缓慢的细分市场,并为用户提供有价值的市场概览和市场洞察,帮助他们做出战略决策,确定核心市场应用。
类别
- 全粒面
- 顶级粒面
- 真的
- 双播
- 保税
- 合成的
根据类别,美国皮革家具市场分为全粒面皮革、头层粒面皮革、真皮、双面皮革、粘合皮革和合成皮革。
结束
- 苯胺
- 半苯胺
- 刷色
- 脱粒
- 模切
- 浮雕
- 手工制作
- 金属
- 纳帕
- 磨砂皮革
- 油性
- 专利
- 绒面革
- 蜡质
- 其他的
根据表面处理方式,美国皮革家具市场分为苯胺皮、半苯胺皮、拉丝色皮、去粒皮、模切皮、压花皮、手工皮、金属皮、纳帕皮、磨砂皮、油性皮、漆皮、绒面皮、蜡质皮和其他。
产品
- 沙发
- 椅子
- 豆袋
- 转角沙发
- 躺椅
- 凳子
- 奥斯曼
- 坐垫凳
- 桌子
- 脚凳
- 其他的
根据产品,美国皮革家具市场分为沙发、椅子、豆袋、转角沙发、躺椅、凳子、脚凳、坐垫、桌子、脚凳等。
分销渠道
- 电子商务
- B2B
- 第三方分销商
- 其他的
根据分销渠道,美国皮革家具市场分为电子商务、B2B、第三方分销商和其他。
应用
- 住宅
- 商业的

根据应用,美国皮革家具市场分为住宅市场和商业市场。
竞争格局和美国皮革家具市场份额分析
美国皮革家具市场的竞争格局提供了竞争对手的详细信息。详细信息包括公司概况、公司财务状况、产生的收入、市场潜力、研发投资、新市场计划、美国业务、生产基地和设施、生产能力、公司优势和劣势、产品发布、产品宽度和广度、应用主导地位。以上提供的数据点仅与专注于美国皮革家具市场的公司有关。
美国皮革家具市场的一些主要参与者包括 Norwalk、Rowe Furniture、NELLA VETRINA、DOMICILE FURNITURE 等。
SKU-
Get online access to the report on the World's First Market Intelligence Cloud
- Interactive Data Analysis Dashboard
- Company Analysis Dashboard for high growth potential opportunities
- Research Analyst Access for customization & queries
- Competitor Analysis with Interactive dashboard
- Latest News, Updates & Trend analysis
- Harness the Power of Benchmark Analysis for Comprehensive Competitor Tracking
目录
1 INTRODUCTION
1.1 OBJECTIVES OF THE STUDY
1.2 MARKET DEFINITION
1.3 OVERVIEW OF U.S. LEATHER FURNITURE MARKET
1.4 LIMITATION
1.5 MARKETS COVERED
2 MARKET SEGMENTATION
2.1 MARKETS COVERED
2.2 GEOGRAPHICAL SCOPE
2.3 YEARS CONSIDERED FOR THE STUDY
2.4 CURRENCY AND PRICING
2.5 DBMR TRIPOD DATA VALIDATION MODEL
2.6 DISTRIBUTION CHANNEL LINE CURVE
2.7 MULTIVARIATE MODELING
2.8 PRIMARY INTERVIEWS WITH KEY OPINION LEADERS
2.9 DBMR MARKET POSITION GRID
2.1 MARKET CONSUMER CATEGORY COVERAGE GRID
2.11 DBMR MARKET CHALLENGE MATRIX
2.12 DBMR VENDOR SHARE ANALYSIS
2.13 IMPORT-EXPORT DATA
2.14 SECONDARY SOURCES
2.15 ASSUMPTIONS
3 EXECUTIVE SUMMARY
4 PREMIUM INSIGHTS
4.1 BRAND COMPARATIVE ANALYSIS
4.2 FACTORS INFLUENCING BUYING DECISION
4.3 PESTLE ANALYSIS
4.4 PORTER’S FIVE FORCES:
4.5 PRODUCT ADOPTION CRITERIA
4.5.1 OVERVIEW
4.5.1.1 PRODUCT AWARENESS
4.5.1.2 PRODUCT INTEREST
4.5.1.3 PRODUCT EVALUATION
4.5.1.4 PRODUCT TRIAL
4.5.1.5 PRODUCT ADOPTION
4.5.1.6 CONCLUSION
4.6 CONSUMERS BUYING BEHAVIOUR
4.6.1 OVERVIEW
4.6.1.1 COMPLEX BUYING BEHAVIOR
4.6.1.2 DISSONANCE-REDUCING BUYING BEHAVIOR
4.6.1.3 HABITUAL BUYING BEHAVIOR
4.6.1.4 VARIETY SEEKING BEHAVIOR
4.6.1.5 CONCLUSION
5 LEATHER FURNITURE MARKET
5.1 U.S.
6 MARKET OVERVIEW
6.1 DRIVERS
6.1.1 THE RISE IN THE CONSUMER PREFERENCE FOR HOME DECORATION
6.1.2 THE RISE IN LEVEL OF DISPOSABLE INCOME OF PEOPLE AND CONTINUOUS CHANGING LIFESTYLE
6.1.3 SHIFT IN INCLINATION TOWARD LUXURY PRODUCTS AMONG CONSUMERS
6.1.4 UPSURGE IN THE STRONG DEMAND FOR VARIOUS END-USE INDUSTRIES SUCH AS RESIDENTIAL AND COMMERCIAL
6.2 RESTRAINT
6.2.1 FLUCTUATION IN THE PRICES OF RAW MATERIALS
6.3 OPPORTUNITIES
6.3.1 INCREASE IN THE GROWTH OF THE REAL ESTATE INDUSTRY
6.3.2 INFLUENCE OF SOCIAL MEDIA AND RISING ADOPTION RATE OF NEW TECHNOLOGIES AND MATERIALS
6.4 CHALLENGE
6.4.1 HIGH COST OF LEATHER FURNITURE IS NOT SUITABLE FOR PEOPLE WHO PREFER TO RENT
7 U.S. LEATHER FURNITURE MARKET, BY CATEGORY
7.1 OVERVIEW
7.2 FULL GRAIN
7.3 TOP GRAIN
7.4 GENUINE
7.5 BICAST
7.6 BONDED
7.7 SYNTHETIC
8 U.S. LEATHER FURNITURE MARKET, BY FINISH
8.1 OVERVIEW
8.2 ANILINE
8.3 SEMI-ANILINE
8.4 BRUSH-COLORED
8.5 DEGRAINED
8.6 DIE-CUT
8.7 EMBOSSED
8.8 HANDWORKED
8.9 METALLIC
8.1 NAPPA
8.11 NUBUCK
8.12 OILY
8.13 PATENT
8.14 SUEDE
8.15 WAXY
8.16 OTHERS
9 U.S. LEATHER FURNITURE MARKET, BY PRODUCT
9.1 OVERVIEW
9.2 SOFA
9.3 CHAIR
9.4 BEAN BAGS
9.5 CORNER SOFA
9.6 RECLINER
9.7 STOOL
9.8 OTTOMAN
9.9 POUF
9.1 TABLE
9.11 FOOT STOOL
9.12 OTHERS
10 U.S. LEATHER FURNITURE MARKET, BY APPLICATION
10.1 OVERVIEW
10.2 RESIDENTIAL
10.3 COMMERCIAL
10.3.1 COMMERCIAL, BY APPLICATION
10.3.1.1 HOTELS
10.3.1.2 RESORTS
10.3.1.3 UNIVERSITY
10.3.1.4 HOSPITAL
10.3.1.5 PUBLIC OFFICES
10.3.1.6 RESTAURANTS
10.3.1.7 PRIVATE OFFICES
10.3.1.8 SHOPPING MALLS
10.3.1.9 OTHERS
11 U.S. LEATHER FURNITURE MARKET, BY DISTRIBUTION CHANNEL
11.1 OVERVIEW
11.2 B2B
11.3 THIRD PARTY DISTRIBUTORS
11.4 E-COMMERCE
11.5 OTHERS
12 EUROPE LEATHER FURNITURE MARKET, COMPANY LANDSCAPE
12.1 COMPANY SHARE ANALYSIS: U.S.
12.1.1 NEW PRODUCT DEVELOPMENT
13 SWOT ANALYSIS
14 COMPANY PROFILES
14.1 LA-Z-BOY INCORPORATED
14.1.1 COMPANY SNAPSHOT
14.1.2 REVENUE ANALYSIS
14.1.3 PRODUCT PORTFOLIO
14.1.4 RECENT UPDATE
14.2 B&B ITALIA SPA
14.2.1 COMPANY SNAPSHOT
14.2.2 PRODUCT PORTFOLIO
14.2.3 RECENT DEVELOPMENTS
14.3 INTER IKEA SYSTEMS B.V.
14.3.1 COMPANY SNAPSHOT
14.3.2 REVENUE ANALYSIS
14.3.3 PRODUCT PORTFOLIO
14.3.4 RECENT DEVELOPMENT
14.4 NATUZZI S.P.A.
14.4.1 COMPANY SNAPSHOT
14.4.2 REVENUE ANALYSIS
14.4.3 PRODUCT PORTFOLIO
14.4.4 RECENT UPDATE
14.5 DOMICILE FURNITURE
14.5.1 COMPANY SNAPSHOT
14.5.2 PRODUCT PORTFOLIO
14.5.3 RECENT DEVELOPMENTS
14.6 DURESTA
14.6.1 COMPANY SNAPSHOT
14.6.2 PRODUCT PORTFOLIO
14.6.3 RECENT DEVELOPMENTS
14.7 NELLA VETRINA
14.7.1 COMPANY SNAPSHOT
14.7.2 PRODUCT PORTFOLIO
14.7.3 RECENT DEVELOPMENTS
14.8 NORWALK
14.8.1 COMPANY SNAPSHOT
14.8.2 PRODUCT PORTFOLIO
14.8.3 RECENT DEVELOPMENT
14.9 PALLISER FURNITURE
14.9.1 COMPANY SNAPSHOT
14.9.2 PRODUCT PORTFOLIO
14.9.3 RECENT DEVELOPMENTS
14.1 ROWE FURNITURE
14.10.1 COMPANY SNAPSHOT
14.10.2 PRODUCT PORTFOLIO
14.10.3 RECENT DEVELOPMENTS
15 QUESTIONNAIRE
16 RELATED REPORTS
表格列表
TABLE 1 IMPORT DATA OF LEATHER OF PATENT LEATHER AND PATENT LAMINATED LEATHER; METALLISED LEATHER (EXCLUDING LACQUERED OR METALLISED RECONSTITUTED LEATHER); HS CODE - 411420 (USD THOU.S.ND)
TABLE 2 EXPORT DATA OF LEATHER OF PATENT LEATHER AND PATENT LAMINATED LEATHER; METALLISED LEATHER (EXCLUDING LACQUERED OR METALLISED RECONSTITUTED LEATHER) – 411420 (USD THOU.S.ND)
TABLE 3 U.S. LEATHER FURNITURE MARKET, BY CATEGORY, 2020-2029 (USD MILLION)
TABLE 4 U.S. LEATHER FURNITURE MARKET, BY CATEGORY, 2020-2029 (MILLION UNITS)
TABLE 5 U.S. LEATHER FURNITURE MARKET, BY FINISH, 2020-2029 (USD MILLION)
TABLE 6 U.S. LEATHER FURNITURE MARKET, BY PRODUCT, 2020-2029 (USD MILLION)
TABLE 7 U.S. LEATHER FURNITURE MARKET, BY APPLICATION, 2020-2029 (USD MILLION)
TABLE 8 U.S. COMMERCIAL IN LEATHER FURNITURE MARKET, BY APPLICATION, 2020-2029 (USD MILLION)
TABLE 9 U.S. LEATHER FURNITURE MARKET, BY DISTRIBUTION CHANNEL, 2020-2029 (USD MILLION)
图片列表
FIGURE 1 U.S. LEATHER FURNITURE MARKET: SEGMENTATION
FIGURE 2 U.S. LEATHER FURNITURE MARKET: DATA TRIANGULATION
FIGURE 3 U.S. LEATHER FURNITURE MARKET: DROC ANALYSIS
FIGURE 4 U.S. LEATHER FURNITURE MARKET: REGIONAL VS COUNTRY MARKET ANALYSIS
FIGURE 5 U.S. LEATHER FURNITURE MARKET: COMPANY RESEARCH ANALYSIS
FIGURE 6 U.S. LEATHER FURNITURE MARKET: DISTRIBUTION CHANNEL LIFE LINE CURVE
FIGURE 7 U.S. LEATHER FURNITURE MARKET: MULTIVARIATE MODELLING
FIGURE 8 U.S. LEATHER FURNITURE MARKET: INTERVIEW DEMOGRAPHICS
FIGURE 9 U.S. LEATHER FURNITURE MARKET: DBMR MARKET POSITION GRID
FIGURE 10 U.S. LEATHER FURNITURE MARKET: CONSUMER CATEGORY COVERAGE GRID
FIGURE 11 U.S. LEATHER FURNITURE MARKET: CHALLENGE MATRIX
FIGURE 12 U.S. LEATHER FURNITURE MARKET: VENDOR SHARE ANALYSIS
FIGURE 13 U.S. LEATHER FURNITURE MARKET: SEGMENTATION
FIGURE 14 THE RISING LEVEL OF DISPOSABLE INCOME OF PEOPLE AND CONTINUOUS CHANGING LIFESTYLE IS EXPECTED TO DRIVE THE U.S. LEATHER FURNITURE MARKET IN THE FORECAST PERIOD OF 2022 TO 2029
FIGURE 15 FULL GRAIN SEGMENT IS EXPECTED TO ACCOUNT FOR THE LARGEST SHARE OF THE U.S. LEATHER FURNITURE MARKET IN 2022 & 2029
FIGURE 16 U.S. LEATHER FURNITURE MARKET: PRODUCT ADOPTION SCENARIO
FIGURE 17 U.S. LEATHER FURNITURE MARKET: TYPES OF CONSUMER BUYING BEHAVIOUR
FIGURE 18 DRIVERS, RESTRAINTS, OPPORTUNITIES, AND CHALLENGES OF U.S. LEATHER FURNITURE MARKET
FIGURE 19 URBANIZATION IN DIFFERENT REGIONS
FIGURE 20 RENTER OCCUPIED HOUSING UNITS IN U.S. IN QUARTER FOUR OF 2015 TO 2021
FIGURE 21 U.S. LEATHER FURNITURE MARKET, BY CATEGORY, 2021
FIGURE 22 U.S. LEATHER FURNITURE MARKET, BY FINISH, 2021
FIGURE 23 U.S. LEATHER FURNITURE MARKET, BY PRODUCT, 2021
FIGURE 24 U.S. LEATHER FURNITURE MARKET, BY APPLICATION, 2021
FIGURE 25 U.S. LEATHER FURNITURE MARKET, BY DISTRIBUTION CHANNEL, 2021
FIGURE 26 USA LEATHER FURNITURE MARKET: COMPANY SHARE 2021 (%)

研究方法
数据收集和基准年分析是使用具有大样本量的数据收集模块完成的。该阶段包括通过各种来源和策略获取市场信息或相关数据。它包括提前检查和规划从过去获得的所有数据。它同样包括检查不同信息源中出现的信息不一致。使用市场统计和连贯模型分析和估计市场数据。此外,市场份额分析和关键趋势分析是市场报告中的主要成功因素。要了解更多信息,请请求分析师致电或下拉您的询问。
DBMR 研究团队使用的关键研究方法是数据三角测量,其中包括数据挖掘、数据变量对市场影响的分析和主要(行业专家)验证。数据模型包括供应商定位网格、市场时间线分析、市场概览和指南、公司定位网格、专利分析、定价分析、公司市场份额分析、测量标准、全球与区域和供应商份额分析。要了解有关研究方法的更多信息,请向我们的行业专家咨询。
可定制
Data Bridge Market Research 是高级形成性研究领域的领导者。我们为向现有和新客户提供符合其目标的数据和分析而感到自豪。报告可定制,包括目标品牌的价格趋势分析、了解其他国家的市场(索取国家列表)、临床试验结果数据、文献综述、翻新市场和产品基础分析。目标竞争对手的市场分析可以从基于技术的分析到市场组合策略进行分析。我们可以按照您所需的格式和数据样式添加您需要的任意数量的竞争对手数据。我们的分析师团队还可以为您提供原始 Excel 文件数据透视表(事实手册)中的数据,或者可以帮助您根据报告中的数据集创建演示文稿。


