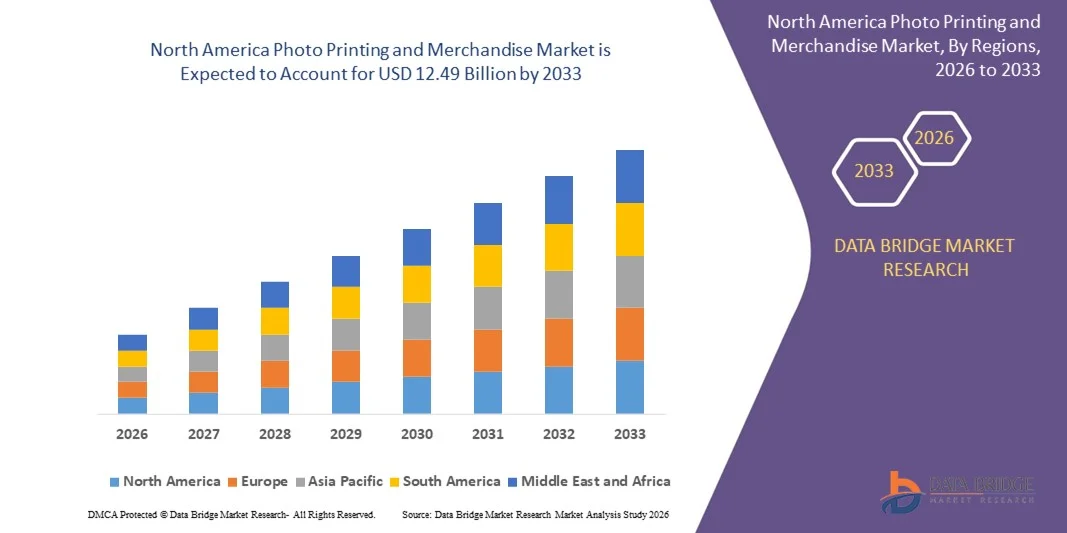
>北美照片印刷和商品市场,按产品(日历、卡片、马克杯、相册、照片礼品、印刷品、T 恤、墙面艺术等)、印刷类型模型(数码印刷和胶片与胶印)、设备(台式机和移动设备)、分销渠道(即时信息亭、网上商店、零售店等)、国家(美国、加拿大和墨西哥)划分的行业趋势和预测到 2028 年。
市场分析和见解:北美照片打印和商品市场
北美照片打印和商品市场预计将在 2021 年至 2028 年的预测期内实现市场增长。Data Bridge Market Research 分析称,在 2021 年至 2028 年的预测期内,该市场将以 7.3% 的复合年增长率增长,预计到 2028 年将达到 87.859 亿美元。推动照片打印和商品市场增长的主要因素是移动设备对高分辨率图片的使用增加以及电子商务的激增。
照片打印和商品包括提供贺卡、个性化照片打印和商品等的零售商。这些零售商提供设计、采购、打印、分销、大型实体店网络等服务。该市场组织为想要通过个性化照片并分享来纪念生活中的几个场合和时刻的客户和用户提供服务。
移动设备对高分辨率图片的使用日益增加,以及对 3D 打印和图像的需求不断增长,是市场增长的主要因素。此外,照片拍摄技术的不断发展也推动了市场的增长。然而,自助打印亭的安装和维护成本高昂,是市场增长的主要制约因素。人工智能与数字印刷技术的结合为市场创造了新的机会。然而,纸质日历被数字计划器取代,是市场增长的主要挑战。
这份北美照片打印和商品市场报告提供了市场份额、新发展和产品线分析、国内和本地市场参与者的影响的详细信息,分析了新兴收入领域、市场法规变化、产品审批、战略决策、产品发布、地域扩张和市场技术创新方面的机会。要了解分析和市场情况,请联系我们获取分析师简报,我们的团队将帮助您创建收入影响解决方案,以实现您的预期目标。
北美照片打印和商品市场范围和市场规模
The North America photo printing and merchandise market is segmented on the basis of product, printing type model, device, and distribution channel. The growth among segments helps you analyse niche pockets of growth and strategies to approach the market and determine your core application areas and the difference in your target markets.
- On the basis of product, the North America photo printing and merchandise market has been segmented into photo books, t-shirts, cards, photo gifts, mugs, prints, wall arts calendars, others. In 2021, the photo books segment is expected to dominate in the market, as the customer can avail the benefits of personalization and add their personal touch to the photo book. The customers are opting for the photo books as it has collection of photos from different events and festivals.
- On the basis of printing type model, the North America photo printing and merchandise market has been segmented into film & offset printing & digital printing. In 2021, film & offset printing is expected to dominate in the market, as they are used for printing the photos which needed a high quality and also the printing is done is bulk so the cost incurred for printing is very low.
- On the basis of device, the North America photo printing and merchandise market has been segmented into desktop & mobile. In 2021, desktop category is expected to dominate in the market as they require low setup cost and low speed turn around. Desktop printing is easy for printing with different colours.
- On the basis of distribution channel, the North America photo printing and merchandise market has been segmented into instant kiosk, online stores, retails stores & others. In 2021, retail stores are expected to dominate in the market as it builds customer rapport which helps seller and buyer in terms of transaction. Retail stores also had longer reach to the customers which also helps in buying decision of the customers.
North America Photo Printing and Merchandise Market Country Level Analysis
The North America photo printing and merchandise market is analysed and market size information is provided by the country, product, printing type model, device and distribution channel as referenced above.
The countries covered in North America photo printing and merchandise market report is the U.S., Canada and Mexico.
The U.S. accounts for maximum share in the North America photo printing and merchandise market owing to factors such as presence of large number of companies manufacturing photo printing and merchandises printing for the customers.
The country section of the North America photo printing and merchandise market report also provides individual market impacting factors and changes in regulation in the market domestically that impacts the current and future trends of the market. Data points such as new sales, replacement sales, country demographics, regulatory acts and import-export analysis are some of the major pointers used to forecast the market scenario for individual countries. Also, presence and availability of global brands and their challenges faced due to large or scarce competition from local and domestic brands, impact of sales channels are considered while providing forecast analysis of the country data.
Increasing Adoption of Contract Manufacturing
The North America photo printing and merchandise market also provides you with detailed market analysis for every country growth in installed base of different kind of products for North America photo printing and merchandise market, impact of technology using life line curves and changes in requirement of abrasives products, regulatory scenarios and their impact on the photo printing and merchandise market. The data is available for historic period 2010 to 2019.
Competitive Landscape and North America Photo Printing and Merchandise Market Share Analysis
The North America photo printing and merchandise market competitive landscape provides details by competitor. Details included are company overview, company financials, revenue generated, market potential, investment in research and development, new market initiatives, global presence, production sites and facilities, company strengths and weaknesses, product launch, clinical trials pipelines, brand analysis, product approvals, patents, product width and breadth, application dominance, technology lifeline curve. The above data points provided are only related to the companies’ focus related to North America photo printing and merchandise market.
Some of the major players operating in the report are Bay Photo Lab, Printique LLC, WhiteWall, HALLMARK LICENSING, LLC, Kodak Alaris Inc., AGC, LLC., Cimpress, District Photo, Inc., Photobox, JONDO Ltd, MILLER'S PROFESSIONAL IMAGING, RitzPix, Nations Photolab, Walmart, Shutterfly Inc., and Walgreen Co. (A Subsidiary of Walgreens Boots Alliance, Inc.) among others. DBMR analysts understand competitive strengths and provide competitive analysis for each competitor separately.
For instance,
- In November 2020, Bay Photo Lab launched a new Textured Metal Surface feature. This product had features such as non-reflective surfaces, organic look and durability. This enhanced the company’s product portfolio and increased the offerings to the customers in the market.
合作、合资和其他战略提高了公司的市场份额,扩大了覆盖范围和存在感。通过扩大产品范围,公司还能够改善其在北美照片打印和商品市场上的供应。
SKU-
Get online access to the report on the World's First Market Intelligence Cloud
- Interactive Data Analysis Dashboard
- Company Analysis Dashboard for high growth potential opportunities
- Research Analyst Access for customization & queries
- Competitor Analysis with Interactive dashboard
- Latest News, Updates & Trend analysis
- Harness the Power of Benchmark Analysis for Comprehensive Competitor Tracking
目录
1 INTRODUCTION
1.1 OBJECTIVES OF THE STUDY
1.2 MARKET DEFINITION
1.3 OVERVIEW OF NORTH AMERICA PHOTO PRINTING AND MERCHANDISE MARKET
1.4 CURRENCY AND PRICING
1.5 LIMITATIONS
1.6 MARKETS COVERED
2 MARKET SEGMENTATION
2.1 MARKETS COVERED
2.2 GEOGRAPHICAL SCOPE
2.3 YEARS CONSIDERED FOR THE STUDY
2.4 DBMR TRIPOD DATA VALIDATION MODEL
2.5 PRIMARY INTERVIEWS WITH KEY OPINION LEADERS
2.6 DBMR MARKET POSITION GRID
2.7 VENDOR SHARE ANALYSIS
2.8 MULTIVARIATE MODELING
2.9 PRODUCT TIMELINE CURVE
2.1 SECONDARY SOURCES
2.11 ASSUMPTIONS
3 EXECUTIVE SUMMARY
4 PREMIUM INSIGHTS
4.1 USE CASE ANALYSIS
4.2 PORTER’S FIVE FORCES ANALYSIS
5 MARKET OVERVIEW
5.1 DRIVERS
5.1.1 INCREASING USAGE OF MOBILE DEVICES FOR HIGH-RESOLUTION PICTURES
5.1.2 GROWING DEMANDS FOR 3D PRINTS AND IMAGES
5.1.3 GROWING ADOPTION OF LENTICULAR PRINTING FOR HIGH-DEFINITION PRINTS
5.1.4 ADVANCEMENTS IN PHOTO CAPTURING TECHNOLOGY
5.1.5 HIGH DEMAND FOR PRINTED T-SHIRTS
5.2 RESTRAINTS
5.2.1 HIGH COSTS ASSOCIATED WITH THE INSTALLATION AND MAINTENANCE OF SELF-PRINTING KIOSKS
5.2.2 ACCELERATED GROWTH OF DIGITAL ADVERTISEMENTS AND E-BOOKS
5.3 OPPORTUNITIES
5.3.1 SURGING GROWTH IN E-COMMERCE
5.3.2 INCREASING CONSUMER EXPENDITURE CAPACITIES
5.3.3 INTEGRATION OF ARTIFICIAL INTELLIGENCE WITH DIGITAL PRINTING TECHNOLOGY
5.3.4 GROWING DEMAND FOR WALL ARTS
5.3.5 INCREASING PREFERENCE FOR PERSONALIZED AND CORPORATE GIFTING
5.4 CHALLENGE
5.4.1 PAPER CALENDARS BEING REPLACED BY DIGITAL PLANNERS
6 IMPACT OF COVID-19 ON THE NORTH AMERICA PHOTO PRINTING AND MERCHANDISE MARKET
6.1 ANALYSIS ON IMPACT OF COVID-19 ON THE MARKET
6.2 AFTERMATH OF COVID-19 AND GOVERNMENT INITIATIVE TO BOOST THE MARKET
6.3 STRATEGIC DECISIONS FOR MANUFACTURERS AFTER COVID-19 TO GAIN COMPETITIVE MARKET SHARE
6.4 IMPACT ON DEMAND
6.5 IMPACT ON SUPPLY CHAIN
6.6 IMPACT ON PRICE
6.7 CONCLUSION
7 NORTH AMERICA PHOTO PRINTING AND MERCHANDISE MARKET, BY PRODUCT
7.1 OVERVIEW
7.2 PHOTO BOOKS
7.3 T-SHIRTS
7.4 CARDS
7.5 MUGS
7.6 PHOTO GIFTS
7.7 PRINTS
7.8 WALL ARTS
7.9 CALENDARS
7.1 OTHERS
8 NORTH AMERICA PHOTO PRINTING AND MERCHANDISE MARKET, BY PRINTING TYPE MODEL
8.1 OVERVIEW
8.2 FILM & OFFSET PRINTING
8.3 DIGITAL PRINTING
9 NORTH AMERICA PHOTO PRINTING AND MERCHANDISE MARKET, BY DEVICE
9.1 OVERVIEW
9.2 DESKTOP
9.3 MOBILE
10 NORTH AMERICA PHOTO PRINTING AND MERCHANDISE MARKET, BY DISTRIBUTION CHANNEL
10.1 OVERVIEW
10.2 RETAIL STORES
10.2.1 PHOTO BOOKS
10.2.2 T-SHIRTS
10.2.3 CARDS
10.2.4 MUGS
10.2.5 PHOTO GIFTS
10.2.6 PRINTS
10.2.7 WALL ARTS
10.2.8 CALENDARS
10.2.9 OTHERS
10.3 ONLINE STORES
10.3.1 PHOTO BOOKS
10.3.2 T-SHIRTS
10.3.3 CARDS
10.3.4 MUGS
10.3.5 PHOTO GIFTS
10.3.6 PRINTS
10.3.7 WALL ARTS
10.3.8 CALENDARS
10.3.9 OTHERS
10.4 INSTANT KIOSK
10.4.1 PRINTS
10.4.2 PHOTO BOOKS
10.4.3 PHOTO GIFTS
10.4.4 CARDS
10.4.5 WALL ARTS
10.4.6 CALENDARS
10.4.7 T-SHIRTS
10.4.8 MUGS
10.4.9 OTHERS
10.5 OTHERS
10.5.1 PHOTO BOOKS
10.5.2 T-SHIRTS
10.5.3 CARDS
10.5.4 MUGS
10.5.5 PHOTO GIFTS
10.5.6 PRINTS
10.5.7 WALL ARTS
10.5.8 CALENDARS
10.5.9 OTHERS
11 NORTH AMERICA PHOTO PRINTING AND MERCHANDISE MARKET, BY REGION
11.1 NORTH AMERICA
11.1.1 U.S.
11.1.2 CANADA
11.1.3 MEXICO
12 NORTH AMERICA PHOTO PRINTING AND MERCHANDISE MARKET: COMPANY LANDSCAPE
12.1 COMPANY SHARE ANALYSIS: NORTH AMERICA
13 SWOT ANALYSIS
14 COMPANY PROFILE
14.1 WALMART
14.1.1 COMPANY SNAPSHOT
14.1.2 REVENUE ANALYSIS
14.1.3 COMPANY SHARE ANALYSIS
14.1.4 PRODUCT PORTFOLIO
14.1.5 RECENT DEVELOPMENT
14.2 HALLMARK LICENSING, LLC
14.2.1 COMPANY SNAPSHOT
14.2.2 COMPANY SHARE ANALYSIS
14.2.3 PRODUCT PORTFOLIO
14.2.4 RECENT DEVELOPMENT
14.3 CIMPRESS
14.3.1 COMPANY SNAPSHOT
14.3.2 REVENUE ANALYSIS
14.3.3 COMPANY SHARE ANALYSIS
14.3.4 PRODUCT PORTFOLIO
14.3.5 RECENT DEVELOPMENTS
14.4 SHUTTERFLY, INC.
14.4.1 COMPANY SNAPSHOT
14.4.2 COMPANY SHARE ANALYSIS
14.4.3 PRODUCT PORTFOLIO
14.4.4 RECENT DEVELOPMENTS
14.5 AGC,LLC
14.5.1 COMPANY SNAPSHOT
14.5.2 COMPANY SHARE ANALYSIS
14.5.3 PRODUCT PORTFOLIO
14.5.4 RECENT DEVELOPMENTS
14.6 BAY PHOTO LAB
14.6.1 COMPANY SNAPSHOT
14.6.2 PRODUCT PORTFOLIO
14.6.3 RECENT DEVELOPMENT
14.7 CARDFACTORY
14.7.1 COMPANY SNAPSHOT
14.7.2 REVENUE ANALYSIS
14.7.3 PRODUCT PORTFOLIO
14.7.4 RECENT DEVELOPMENT
14.8 DIGITALAB
14.8.1 COMPANY SNAPSHOT
14.8.2 PRODUCT PORTFOLIO
14.8.3 RECENT DEVELOPMENT
14.9 DISTRICT PHOTO, INC.
14.9.1 COMPANY SNAPSHOT
14.9.2 PRODUCT PORTFOLIO
14.9.3 RECENT DEVELOPMENTS
14.1 JONDO, LTD.
14.10.1 COMPANY SNAPSHOT
14.10.2 PRODUCT PORTFOLIO
14.10.3 RECENT DEVELOPMENTS
14.11 KODAK ALARIS INC.
14.11.1 COMPANY SNAPSHOT
14.11.2 PRODUCT PORTFOLIO
14.11.3 RECENT DEVELOPMENT
14.12 MILLER'S PROFESSIONAL IMAGING
14.12.1 COMPANY SNAPSHOT
14.12.2 PRODUCT PORTFOLIO
14.12.3 RECENT DEVELOPMENTS
14.13 NATIONS PHOTO LAB
14.13.1 COMPANY SNAPSHOT
14.13.2 PRODUCT PORTFOLIO
14.13.3 RECENT DEVELOPMENT
14.14 PHOTOBOX
14.14.1 PRODUCT PORTFOLIO
14.14.2 RECENT DEVELOPMENTS
14.15 PRINTIQUE LLC
14.15.1 COMPANY SNAPSHOT
14.15.2 PRODUCT PORTFOLIO
14.15.3 RECENT DEVELOPMENTS
14.16 RITZPIX
14.16.1 COMPANY SNAPSHOT
14.16.2 PRODUCT PORTFOLIO
14.17 SMARTPHOTO GROUP
14.17.1 COMPANY SNAPSHOT
14.17.2 REVENUE ANALYSIS
14.17.3 PRODUCT PORTFOLIO
14.17.4 RECENT DEVELOPMENTS
14.18 WALGREEN CO. (A SUBSIDIARY OF WALGREENS BOOTS ALLIANCE, INC.)
14.18.1 COMPANY SNAPSHOT
14.18.2 REVENUE ANALYSIS
14.18.3 PRODUCT PORTFOLIO
14.18.4 RECENT DEVELOPMENT
14.19 WHITEWALL
14.19.1 COMPANY SNAPSHOT
14.19.2 PRODUCT PORTFOLIO
14.19.3 RECENT DEVELOPMENTS
14.2 OTHER PROMINENT PLAYERS
15 QUESTIONNAIRE
16 RELATED REPORTS
表格列表
TABLE 1 NORTH AMERICA PHOTO PRINTING AND MERCHANDISE MARKET, BY PRODUCT, 2019-2028 (USD MILLION)
TABLE 2 NORTH AMERICA PHOTO BOOKS IN PHOTO PRINTING AND MERCHANDISE MARKET, BY REGION, 2021-2028 (USD MILLION)
TABLE 3 NORTH AMERICA T-SHIRTS IN PHOTO PRINTING AND MERCHANDISE MARKET, BY REGION, 2019-2028 (USD MILLION)
TABLE 4 NORTH AMERICA CARDS IN PHOTO PRINTING AND MERCHANDISE MARKET, BY REGION, 2019-2028 (USD MILLION)
TABLE 5 NORTH AMERICA MUGS IN PHOTO PRINTING AND MERCHANDISE MARKET, BY REGION, 2021-2028 (USD MILLION)
TABLE 6 NORTH AMERICA PHOTO GIFTS IN PHOTO PRINTING AND MERCHANDISE MARKET, BY REGION, 2019-2028 (USD MILLION)
TABLE 7 NORTH AMERICA PRINTS IN PHOTO PRINTING AND MERCHANDISE MARKET, BY REGION, 2019-2028 (USD MILLION)
TABLE 8 NORTH AMERICA WALL ARTS IN PHOTO PRINTING AND MERCHANDISE MARKET, BY REGION, 2021-2028 (USD MILLION)
TABLE 9 NORTH AMERICA CALENDARS IN PHOTO PRINTING AND MERCHANDISE MARKET, BY REGION, 2019-2028 (USD MILLION)
TABLE 10 NORTH AMERICA OTHERS IN PHOTO PRINTING AND MERCHANDISE MARKET, BY REGION, 2019-2028 (USD MILLION)
TABLE 11 NORTH AMERICA PHOTO PRINTING AND MERCHANDISE MARKET, BY PRINTING TYPE MODEL, 2019-2028 (USD MILLION)
TABLE 12 NORTH AMERICA FILM & OFFSET PRINTING IN PHOTO PRINTING AND MERCHANDISE MARKET, BY REGION, 2019-2028 (USD MILLION)
TABLE 13 NORTH AMERICA DIGITAL PRINTING IN PHOTO PRINTING AND MERCHANDISE MARKET, BY REGION, 2019-2028 (USD MILLION)
TABLE 14 NORTH AMERICA PHOTO PRINTING AND MERCHANDISE MARKET, BY DEVICE, 2019-2028 (USD MILLION)
TABLE 15 NORTH AMERICA DESKTOP IN PHOTO PRINTING AND MERCHANDISE MARKET, BY REGION, 2019-2028 (USD MILLION)
TABLE 16 NORTH AMERICA MOBILE IN PHOTO PRINTING AND MERCHANDISE MARKET, BY REGION, 2019-2028 (USD MILLION)
TABLE 17 NORTH AMERICA PHOTO PRINTING AND MERCHANDISE MARKET, BY DISTRIBUTION CHANNEL, 2019-2028 (USD MILLION)
TABLE 18 NORTH AMERICA RETAIL STORES IN PHOTO PRINTING AND MERCHANDISE MARKET, BY REGION, 2019-2028 (USD MILLION)
TABLE 19 NORTH AMERICA RETAIL STORES IN PHOTO PRINTING AND MERCHANDISE MARKET, BY PRODUCT, 2019-2028 (USD MILLION)
TABLE 20 NORTH AMERICA ONLINE STORES IN PHOTO PRINTING AND MERCHANDISE MARKET, BY REGION, 2019-2028 (USD MILLION)
TABLE 21 NORTH AMERICA ONLINE STORES IN PHOTO PRINTING AND MERCHANDISE MARKET, BY PRODUCT, 2019-2028 (USD MILLION)
TABLE 22 NORTH AMERICA INSTANT KIOSK IN PHOTO PRINTING AND MERCHANDISE MARKET, BY REGION, 2019-2028 (USD MILLION)
TABLE 23 NORTH AMERICA INSTANT KIOSK IN PHOTO PRINTING AND MERCHANDISE MARKET, BY PRODUCT, 2019-2028 (USD MILLION)
TABLE 24 NORTH AMERICA OTHERS IN PHOTO PRINTING AND MERCHANDISE MARKET, BY REGION, 2019-2028 (USD MILLION)
TABLE 25 NORTH AMERICA OTHERS IN PHOTO PRINTING AND MERCHANDISE MARKET, BY PRODUCT, 2019-2028 (USD MILLION)
TABLE 26 NORTH AMERICA PHOTO PRINTING AND MERCHANDISE MARKET, BY COUNTRY, 2019-2028 (USD MILLION)
TABLE 27 NORTH AMERICA PHOTO PRINTING AND MERCHANDISE MARKET, BY PRODUCT, 2019-2028 (USD MILLION)
TABLE 28 NORTH AMERICA PHOTO PRINTING AND MERCHANDISE MARKET, BY PRINTING TYPE MODEL, 2019-2028 (USD MILLION)
TABLE 29 NORTH AMERICA PHOTO PRINTING AND MERCHANDISE MARKET, BY DEVICE, 2019-2028 (USD MILLION)
TABLE 30 NORTH AMERICA PHOTO PRINTING AND MERCHANDISE MARKET, BY DISTRIBUTION CHANNEL, 2019-2028 (USD MILLION)
TABLE 31 NORTH AMERICA RETAIL STORES IN PHOTO PRINTING AND MERCHANDISE MARKET, BY PRODUCT, 2019-2028 (USD MILLION)
TABLE 32 NORTH AMERICA ONLINE STORES IN PHOTO PRINTING AND MERCHANDISE MARKET, BY PRODUCT, 2019-2028 (USD MILLION)
TABLE 33 NORTH AMERICA INSTANT KIOSK IN PHOTO PRINTING AND MERCHANDISE MARKET, BY PRODUCT, 2019-2028 (USD MILLION)
TABLE 34 NORTH AMERICA OTHERS IN PHOTO PRINTING AND MERCHANDISE MARKET, BY PRODUCT, 2019-2028 (USD MILLION)
TABLE 35 U.S. PHOTO PRINTING AND MERCHANDISE MARKET, BY PRODUCT, 2019-2028 (USD MILLION)
TABLE 36 U.S. PHOTO PRINTING AND MERCHANDISE MARKET, BY PRINTING TYPE MODEL, 2019-2028 (USD MILLION)
TABLE 37 U.S. PHOTO PRINTING AND MERCHANDISE MARKET, BY DEVICE, 2019-2028 (USD MILLION)
TABLE 38 U.S. PHOTO PRINTING AND MERCHANDISE MARKET, BY DISTRIBUTION CHANNEL, 2019-2028 (USD MILLION)
TABLE 39 U.S. RETAIL STORES IN PHOTO PRINTING AND MERCHANDISE MARKET, BY PRODUCT, 2019-2028 (USD MILLION)
TABLE 40 U.S. ONLINE STORES IN PHOTO PRINTING AND MERCHANDISE MARKET, BY PRODUCT, 2019-2028 (USD MILLION)
TABLE 41 U.S. INSTANT KIOSK IN PHOTO PRINTING AND MERCHANDISE MARKET, BY PRODUCT, 2019-2028 (USD MILLION)
TABLE 42 U.S. OTHERS IN PHOTO PRINTING AND MERCHANDISE MARKET, BY PRODUCT, 2019-2028 (USD MILLION)
TABLE 43 CANADA PHOTO PRINTING AND MERCHANDISE MARKET, BY PRODUCT, 2019-2028 (USD MILLION)
TABLE 44 CANADA PHOTO PRINTING AND MERCHANDISE MARKET, BY PRINTING TYPE MODEL, 2019-2028 (USD MILLION)
TABLE 45 CANADA PHOTO PRINTING AND MERCHANDISE MARKET, BY DEVICE, 2019-2028 (USD MILLION)
TABLE 46 CANADA PHOTO PRINTING AND MERCHANDISE MARKET, BY DISTRIBUTION CHANNEL, 2019-2028 (USD MILLION)
TABLE 47 CANADA RETAIL STORES IN PHOTO PRINTING AND MERCHANDISE MARKET, BY PRODUCT, 2019-2028 (USD MILLION)
TABLE 48 CANADA ONLINE STORES IN PHOTO PRINTING AND MERCHANDISE MARKET, BY PRODUCT, 2019-2028 (USD MILLION)
TABLE 49 CANADA INSTANT KIOSK IN PHOTO PRINTING AND MERCHANDISE MARKET, BY PRODUCT, 2019-2028 (USD MILLION)
TABLE 50 CANADA OTHERS IN PHOTO PRINTING AND MERCHANDISE MARKET, BY PRODUCT, 2019-2028 (USD MILLION)
TABLE 51 MEXICO PHOTO PRINTING AND MERCHANDISE MARKET, BY PRODUCT, 2019-2028 (USD MILLION)
TABLE 52 MEXICO PHOTO PRINTING AND MERCHANDISE MARKET, BY PRINTING TYPE MODEL, 2019-2028 (USD MILLION)
TABLE 53 MEXICO PHOTO PRINTING AND MERCHANDISE MARKET, BY DEVICE, 2019-2028 (USD MILLION)
TABLE 54 MEXICO PHOTO PRINTING AND MERCHANDISE MARKET, BY DISTRIBUTION CHANNEL, 2019-2028 (USD MILLION)
TABLE 55 MEXICO RETAIL STORES IN PHOTO PRINTING AND MERCHANDISE MARKET, BY PRODUCT, 2019-2028 (USD MILLION)
TABLE 56 MEXICO ONLINE STORES IN PHOTO PRINTING AND MERCHANDISE MARKET, BY PRODUCT, 2019-2028 (USD MILLION)
TABLE 57 MEXICO INSTANT KIOSK IN PHOTO PRINTING AND MERCHANDISE MARKET, BY PRODUCT, 2019-2028 (USD MILLION)
TABLE 58 MEXICO OTHERS IN PHOTO PRINTING AND MERCHANDISE MARKET, BY PRODUCT, 2019-2028 (USD MILLION)
图片列表
FIGURE 1 NORTH AMERICA PHOTO PRINTING AND MERCHANDISE MARKET: SEGMENTATION
FIGURE 2 NORTH AMERICA PHOTO PRINTING AND MERCHANDISE MARKET: DATA TRIANGULATION
FIGURE 3 NORTH AMERICA PHOTO PRINTING AND MERCHANDISE MARKET: DROC ANALYSIS
FIGURE 4 NORTH AMERICA PHOTO PRINTING AND MERCHANDISE MARKET: NORTH AMERICA VS REGIONAL MARKET ANALYSIS
FIGURE 5 NORTH AMERICA PHOTO PRINTING AND MERCHANDISE MARKET: COMPANY RESEARCH ANALYSIS
FIGURE 6 NORTH AMERICA PHOTO PRINTING AND MERCHANDISE MARKET: INTERVIEW DEMOGRAPHICS
FIGURE 7 NORTH AMERICA PHOTO PRINTING AND MERCHANDISE MARKET: DBMR MARKET POSITION GRID
FIGURE 8 NORTH AMERICA PHOTO PRINTING AND MERCHANDISE MARKET: VENDOR SHARE ANALYSIS
FIGURE 9 NORTH AMERICA PHOTO PRINTING AND MERCHANDISE MARKET: SEGMENTATION
FIGURE 10 ADVANCEMNETS IN PHOTO CAPTURING TECHNOLOGY IS EXPECTED TO DRIVE THE NORTH AMERICA PHOTO PRINTING AND MERCHANDISE MARKET IN THE FORECAST PERIOD OF 2021 TO 2028
FIGURE 11 PHOTO BOOKS SEGMENT IS EXPECTED TO ACCOUNT FOR THE LARGEST SHARE OF THE NORTH AMERICA PHOTO PRINTING AND MERCHANDISE MARKET IN 2021 & 2028
FIGURE 12 DRIVERS, RESTRAINTS, OPPORTUNITIES AND CHALLENGE OF NORTH AMERICA PHOTO PRINTING AND MERCHANDISE MARKET
FIGURE 13 NORTH AMERICA PHOTO PRINTING AND MERCHANDISE MARKET: BY PRODUCT, 2020
FIGURE 14 NORTH AMERICA PHOTO PRINTING AND MERCHANDISE MARKET: BY PRINTING TYPE MODEL, 2020
FIGURE 15 NORTH AMERICA PHOTO PRINTING AND MERCHANDISE MARKET: BY DEVICE, 2020
FIGURE 16 NORTH AMERICA PHOTO PRINTING AND MERCHANDISE MARKET: BY DISTRIBUTION CHANNEL, 2020
FIGURE 17 NORTH AMERICA PHOTO PRINTING AND MERCHANDISE MARKET: SNAPSHOT (2020)
FIGURE 18 NORTH AMERICA PHOTO PRINTING AND MERCHANDISE MARKET: BY COUNTRY (2020)
FIGURE 19 NORTH AMERICA PHOTO PRINTING AND MERCHANDISE MARKET: BY COUNTRY (2021 & 2028)
FIGURE 20 NORTH AMERICA PHOTO PRINTING AND MERCHANDISE MARKET: BY COUNTRY (2020 & 2028)
FIGURE 21 NORTH AMERICA PHOTO PRINTING AND MERCHANDISE MARKET: BY PRODUCT (2021-2028)
FIGURE 22 NORTH AMERICA PHOTO PRINTING AND MERCHANDISE MARKET: COMPANY SHARE 2020 (%)
研究方法
Data collection and base year analysis are done using data collection modules with large sample sizes. The stage includes obtaining market information or related data through various sources and strategies. It includes examining and planning all the data acquired from the past in advance. It likewise envelops the examination of information inconsistencies seen across different information sources. The market data is analysed and estimated using market statistical and coherent models. Also, market share analysis and key trend analysis are the major success factors in the market report. To know more, please request an analyst call or drop down your inquiry.
The key research methodology used by DBMR research team is data triangulation which involves data mining, analysis of the impact of data variables on the market and primary (industry expert) validation. Data models include Vendor Positioning Grid, Market Time Line Analysis, Market Overview and Guide, Company Positioning Grid, Patent Analysis, Pricing Analysis, Company Market Share Analysis, Standards of Measurement, Global versus Regional and Vendor Share Analysis. To know more about the research methodology, drop in an inquiry to speak to our industry experts.
可定制
Data Bridge Market Research is a leader in advanced formative research. We take pride in servicing our existing and new customers with data and analysis that match and suits their goal. The report can be customized to include price trend analysis of target brands understanding the market for additional countries (ask for the list of countries), clinical trial results data, literature review, refurbished market and product base analysis. Market analysis of target competitors can be analyzed from technology-based analysis to market portfolio strategies. We can add as many competitors that you require data about in the format and data style you are looking for. Our team of analysts can also provide you data in crude raw excel files pivot tables (Fact book) or can assist you in creating presentations from the data sets available in the report.