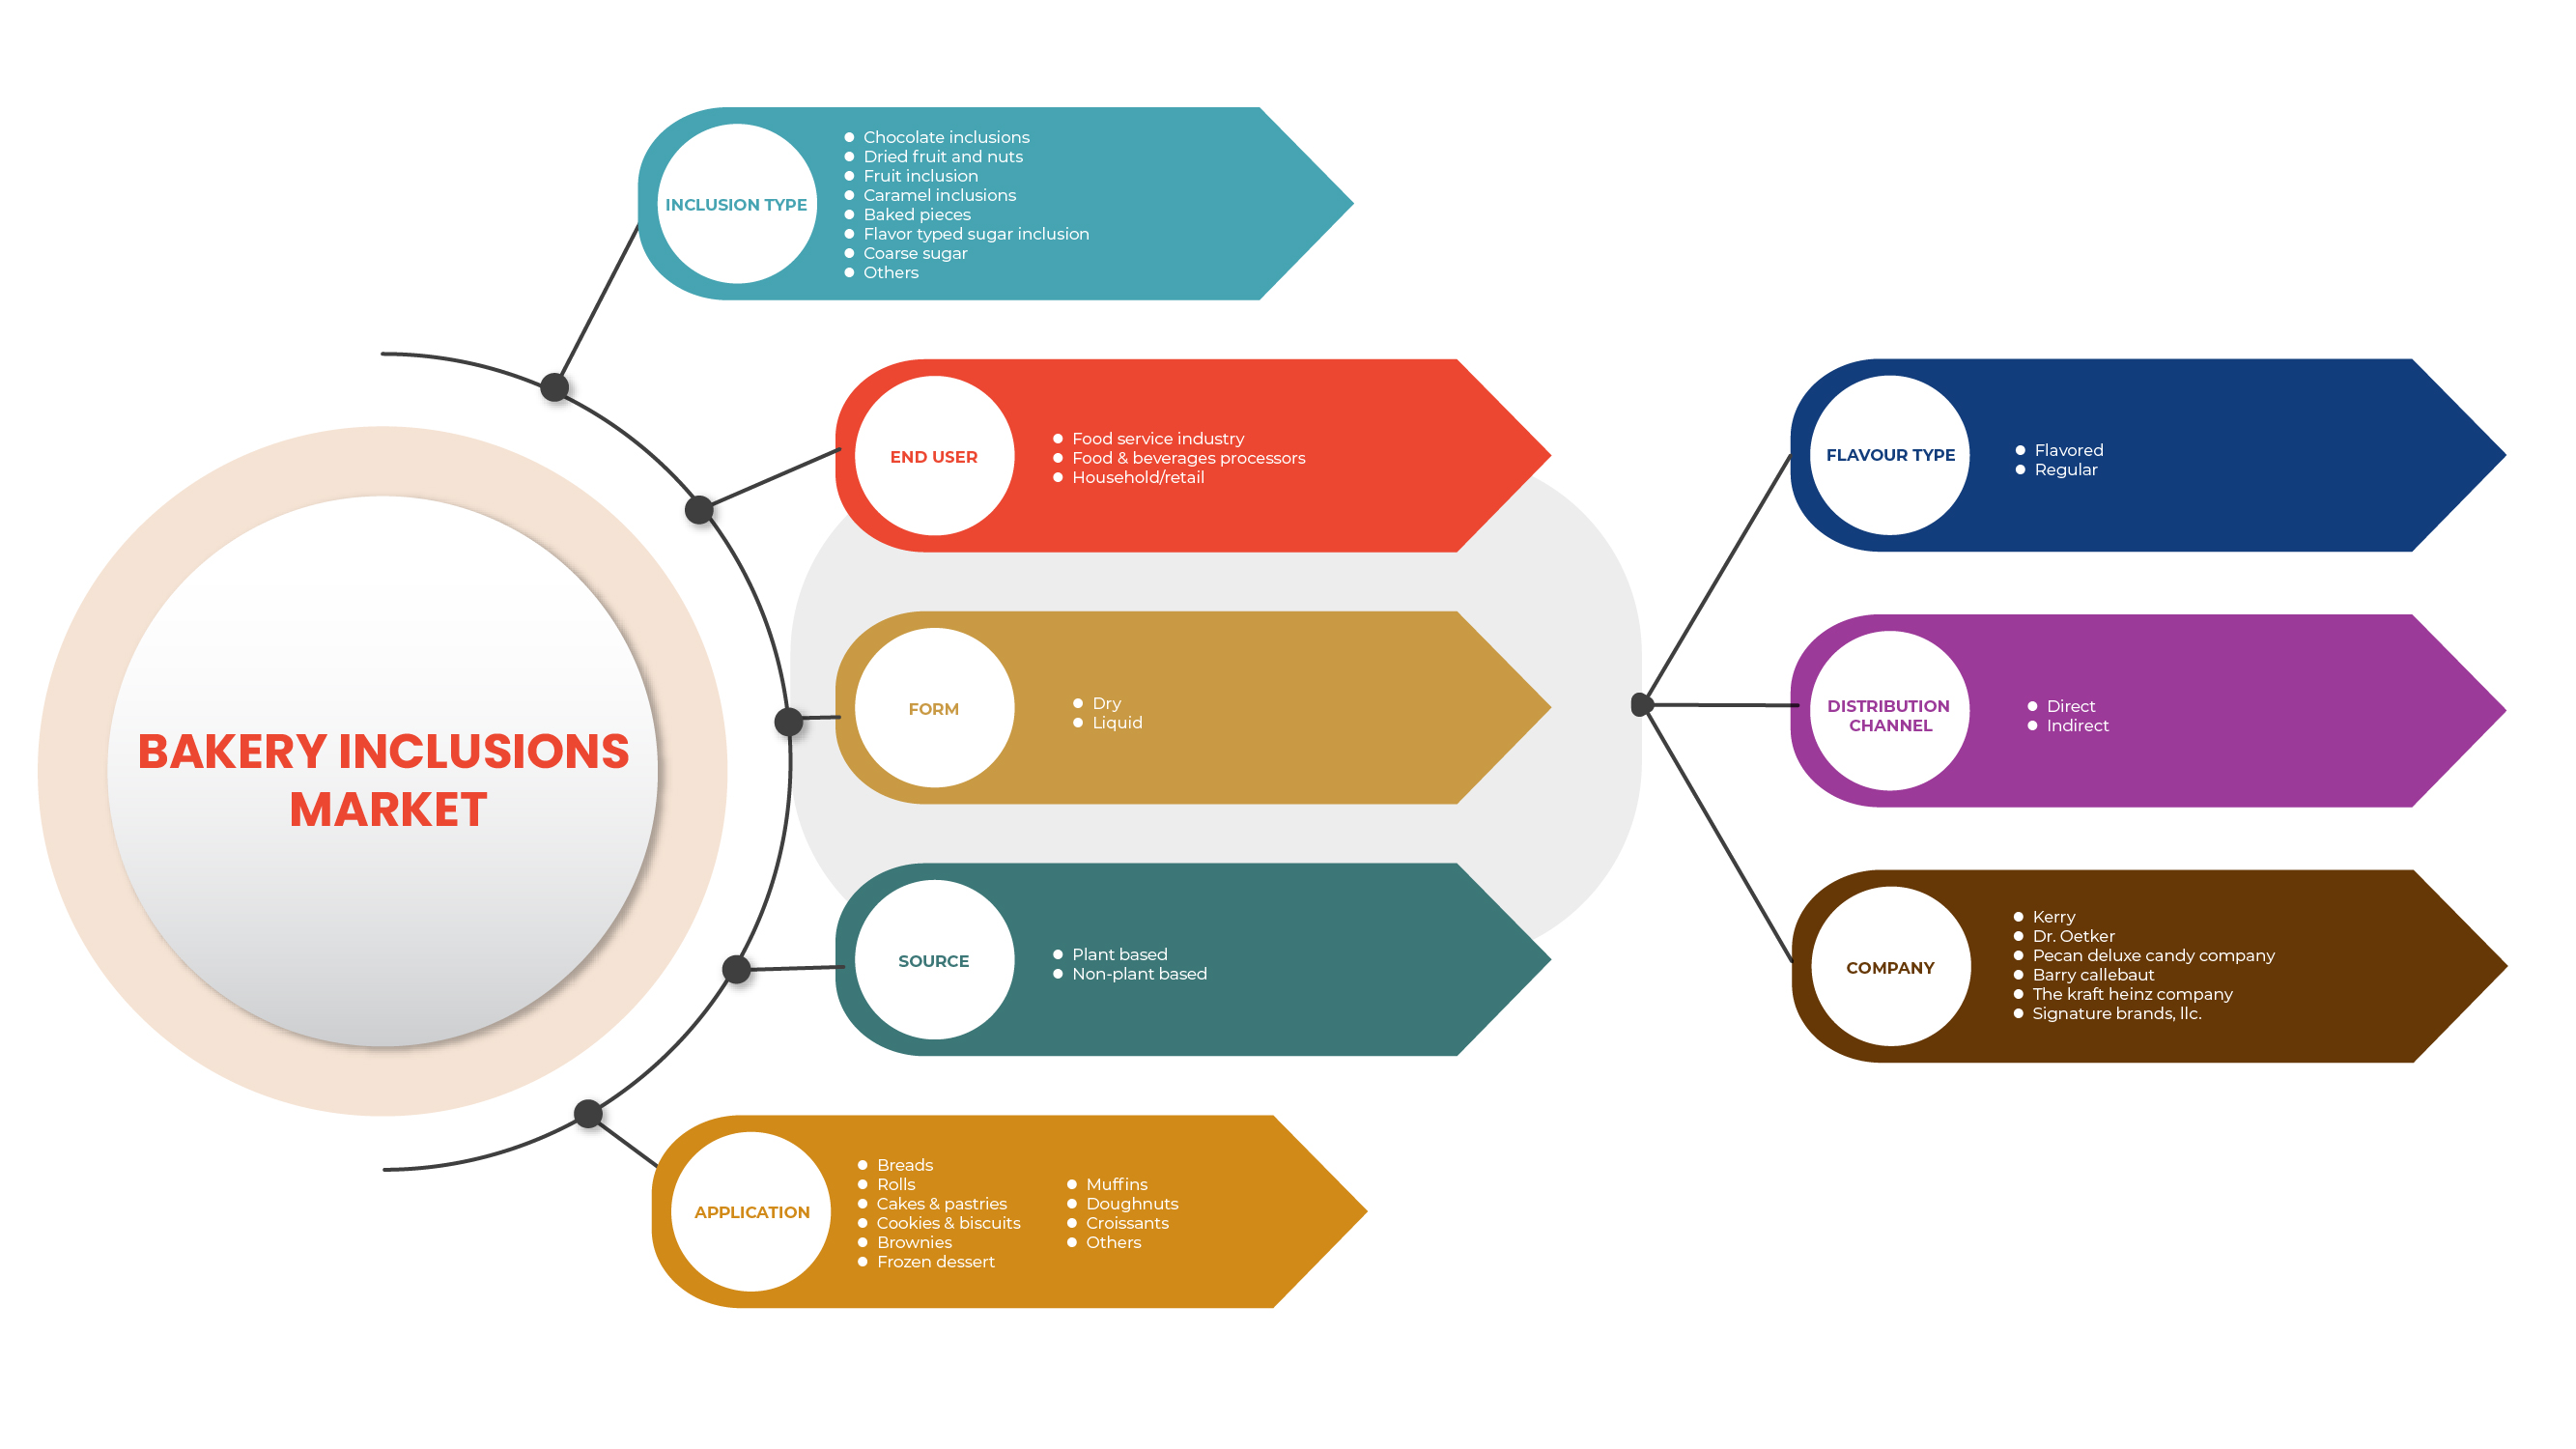
北美烘焙配料市场,按配料类型(巧克力配料、焦糖配料、干果和坚果、粗糖、烘焙片、水果配料、调味糖配料等)、最终用户(食品和饮料加工商、食品服务业和家庭/零售)、形式(干性和液体性)、来源(植物性和非植物性)、应用(面包、松饼、甜甜圈、羊角面包、面包卷、蛋糕和糕点、曲奇和饼干等)、口味(口味和普通)、分销渠道(直接和间接)划分 - 行业趋势和预测到 2029 年。
市场分析和见解
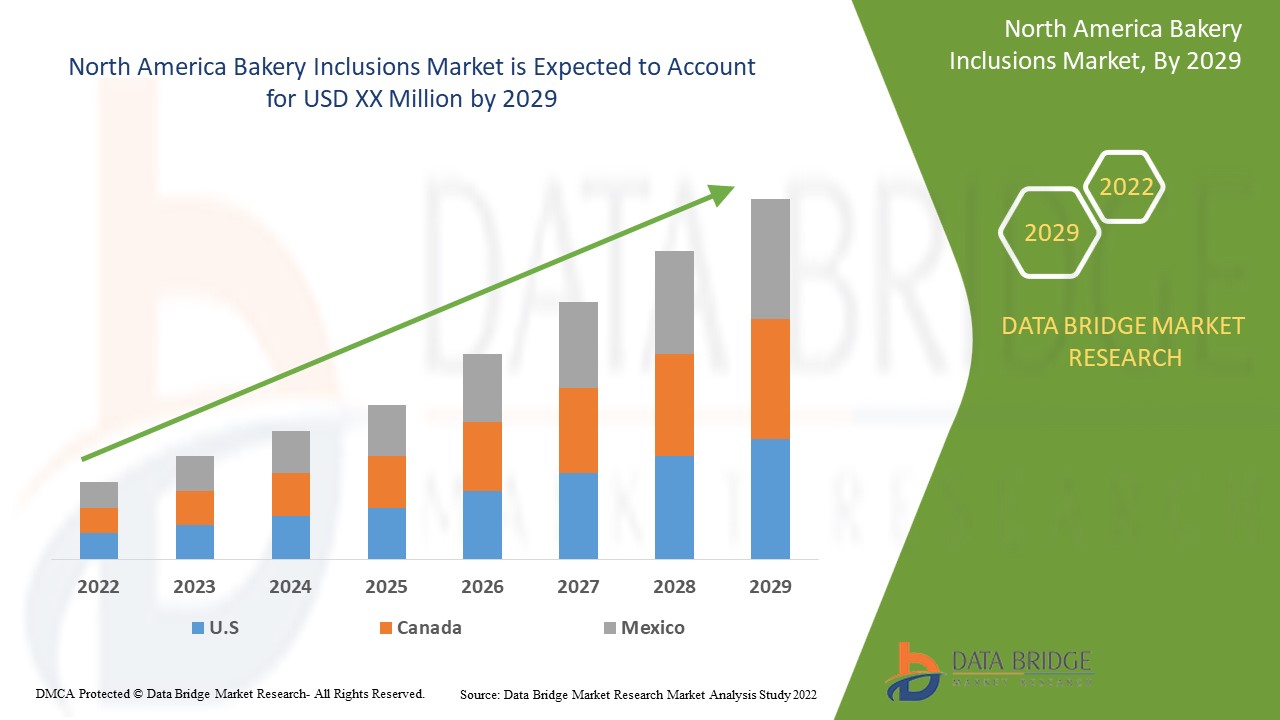
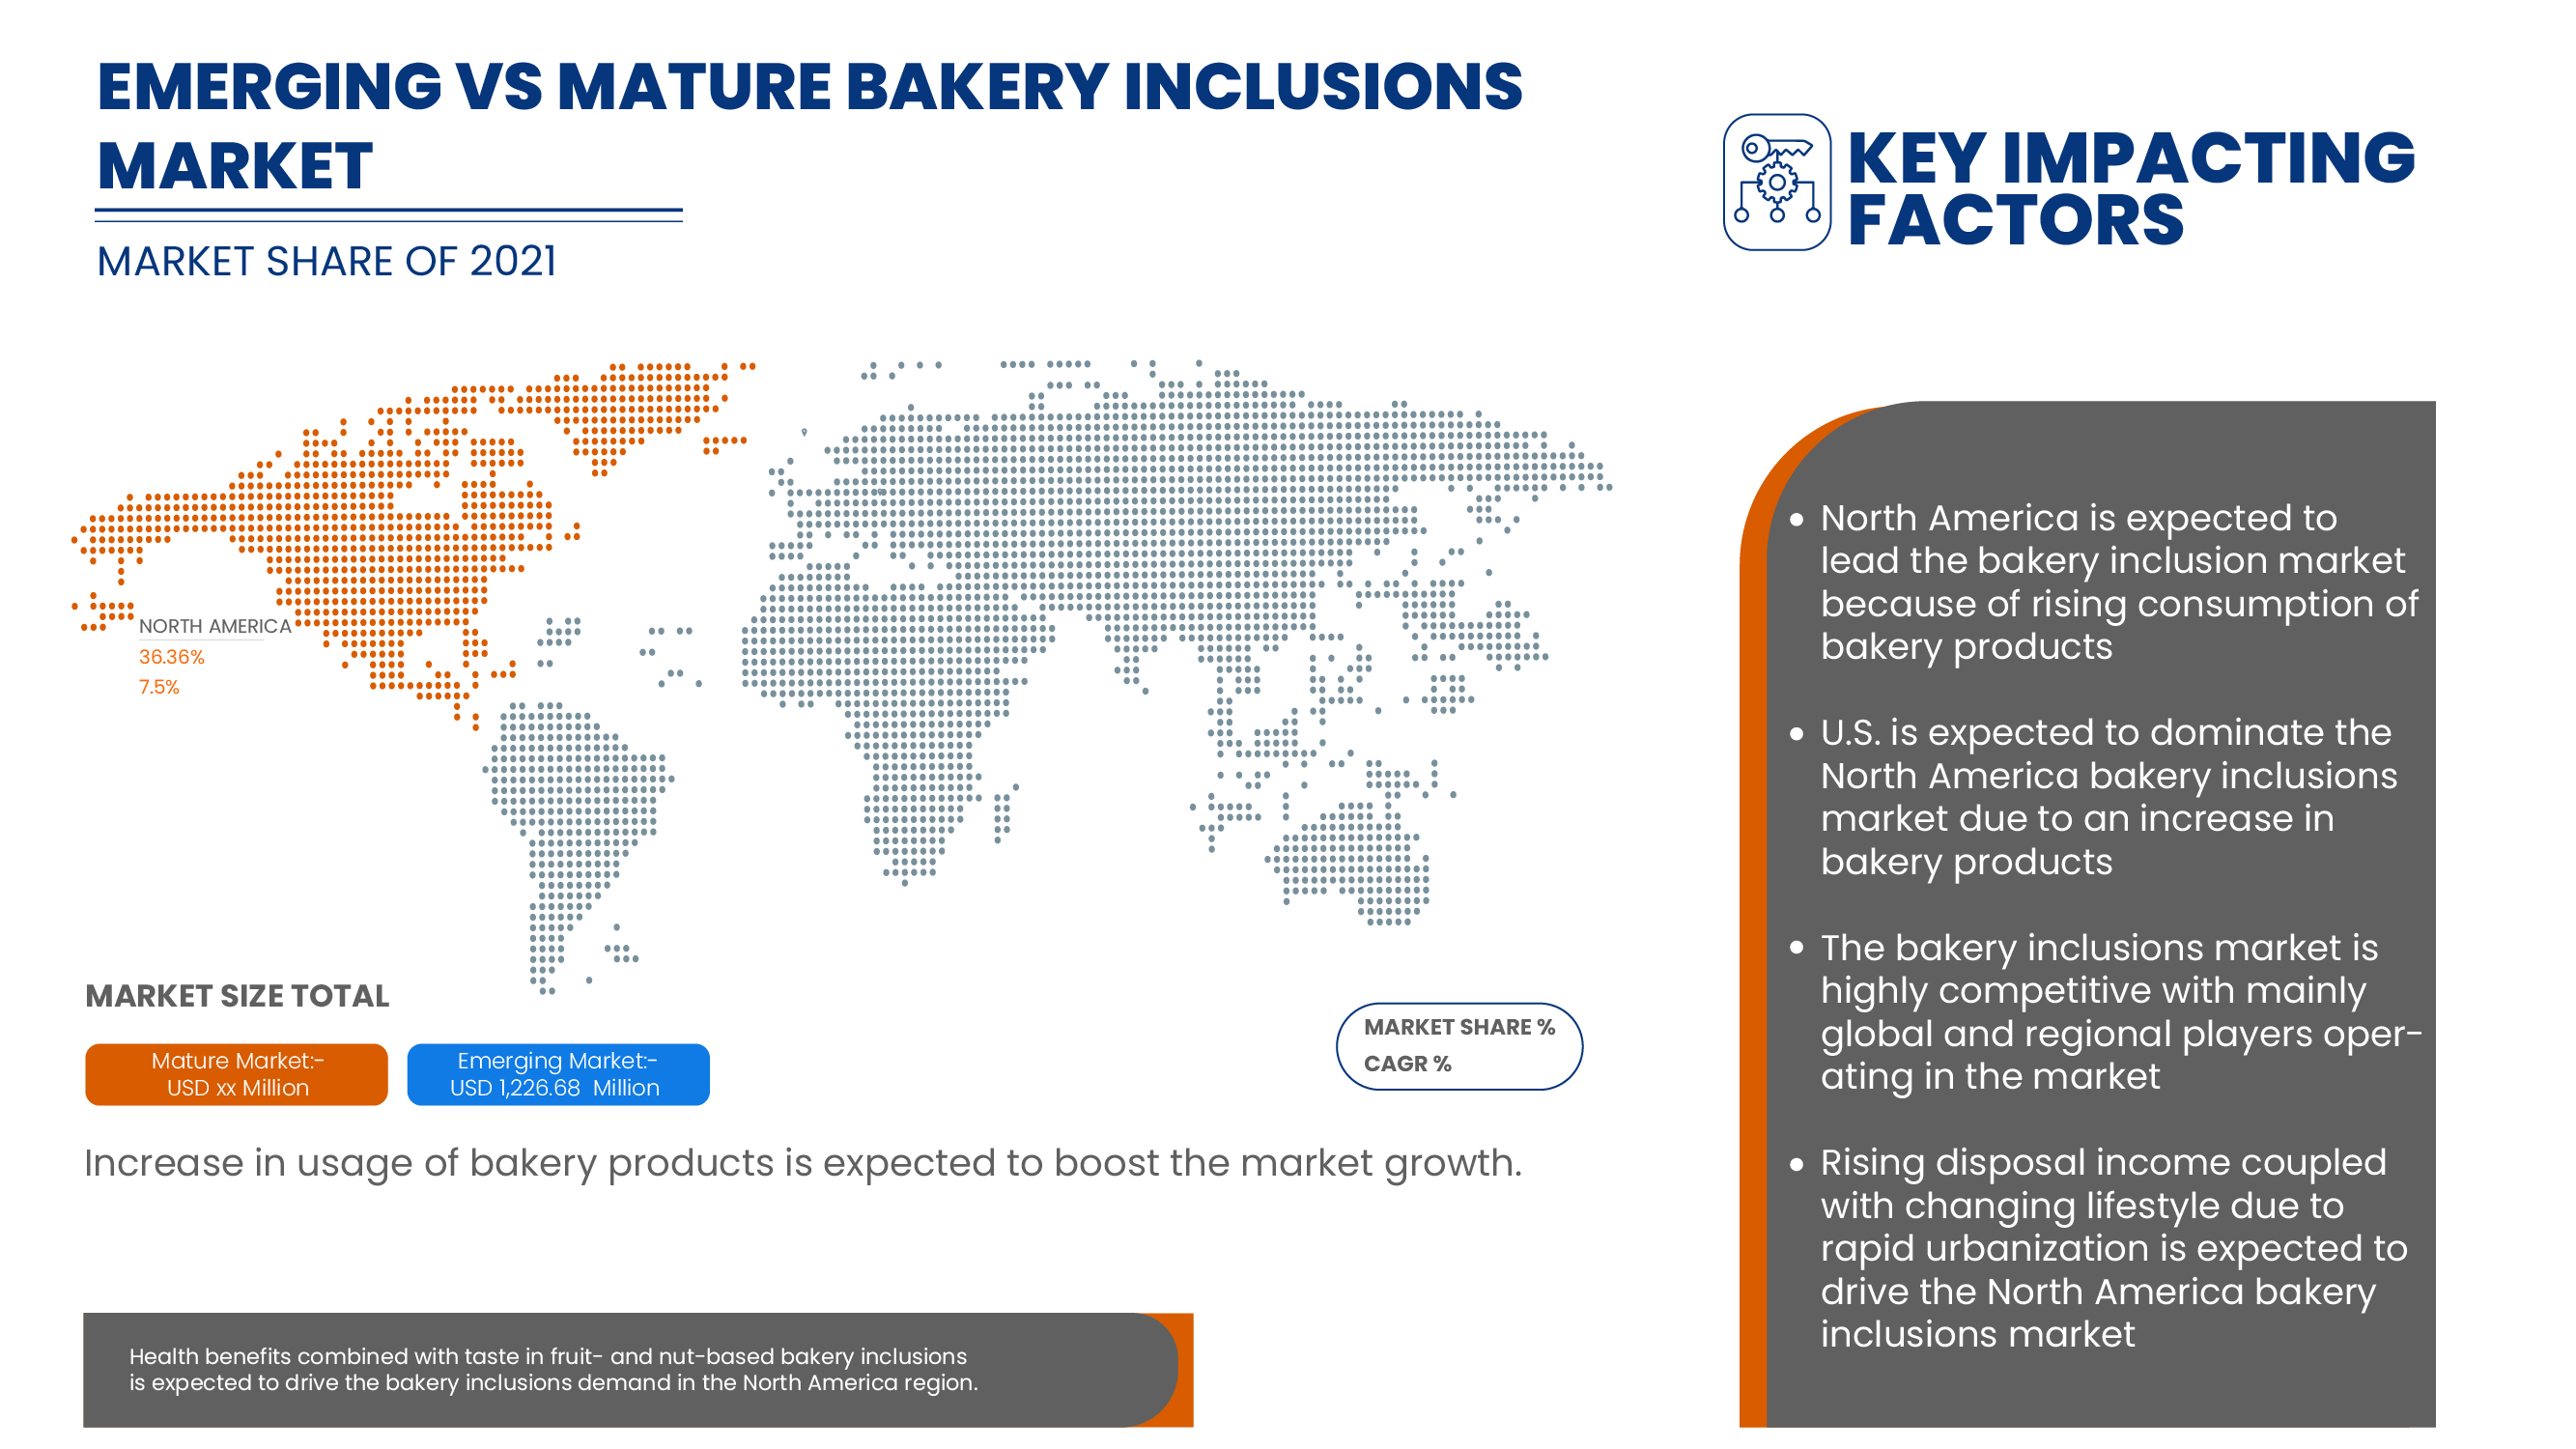
烘焙内含物市场的主要增长因素是生活方式的快速变化以及劳动人口的增加。推动烘焙内含物需求的主要因素是对具有某种增值的加工食品的需求不断增加。此外,可支配收入的增加、快速的城市化以及对方便小吃和糖果的需求不断增长,也在预测期内提高了烘焙内含物市场的整体需求。此外,内含物提供的各种功能特性以及对烘焙和糖果产品的需求不断增长也是增加烘焙内含物市场需求的主要驱动力。此外,食品和饮料领域大量应用的存在也推动了烘焙内含物市场的增长。Data Bridge Market Research 分析,北美烘焙内含物市场在 2022 年至 2029 年的预测期内将以 7.5% 的复合年增长率增长。
|
报告指标 |
细节 |
|
预测期 |
2022 至 2029 年 |
|
基准年 |
2021 |
|
历史岁月 |
2020(可定制至 2020 - 2014 年) |
|
定量单位 |
收入(百万美元),定价(美元) |
|
涵盖的领域 |
按添加物类型(巧克力添加物、焦糖添加物、干果和坚果、粗糖、烘焙食品、水果添加物、调味糖添加物等)、最终用户(食品和饮料加工商、食品服务行业和家庭/零售)、形式(干性和液体性)、来源(植物性和非植物性)、应用(面包、松饼、甜甜圈、羊角面包、面包卷、蛋糕和糕点、曲奇和饼干等)、口味(口味和普通)、分销渠道(直接和间接) |
|
覆盖国家 |
美国、加拿大和墨西哥 |
|
涵盖的市场参与者 |
Kerry、Dr. Oetker、Pecan Deluxe Candy Company、AMERICAN SPRINKLE COMPANY、Girrbach Süßwarendekor GmbH、Cacau Foods do Brasil.、汕头合和科技有限公司、Barry Callebaut、卡夫亨氏公司、Cape Foods、Paulaur Corporation、GÜNTHART & Co. KG、Signature Brands, LLC 等 |
北美烘焙食品市场动态
驱动程序
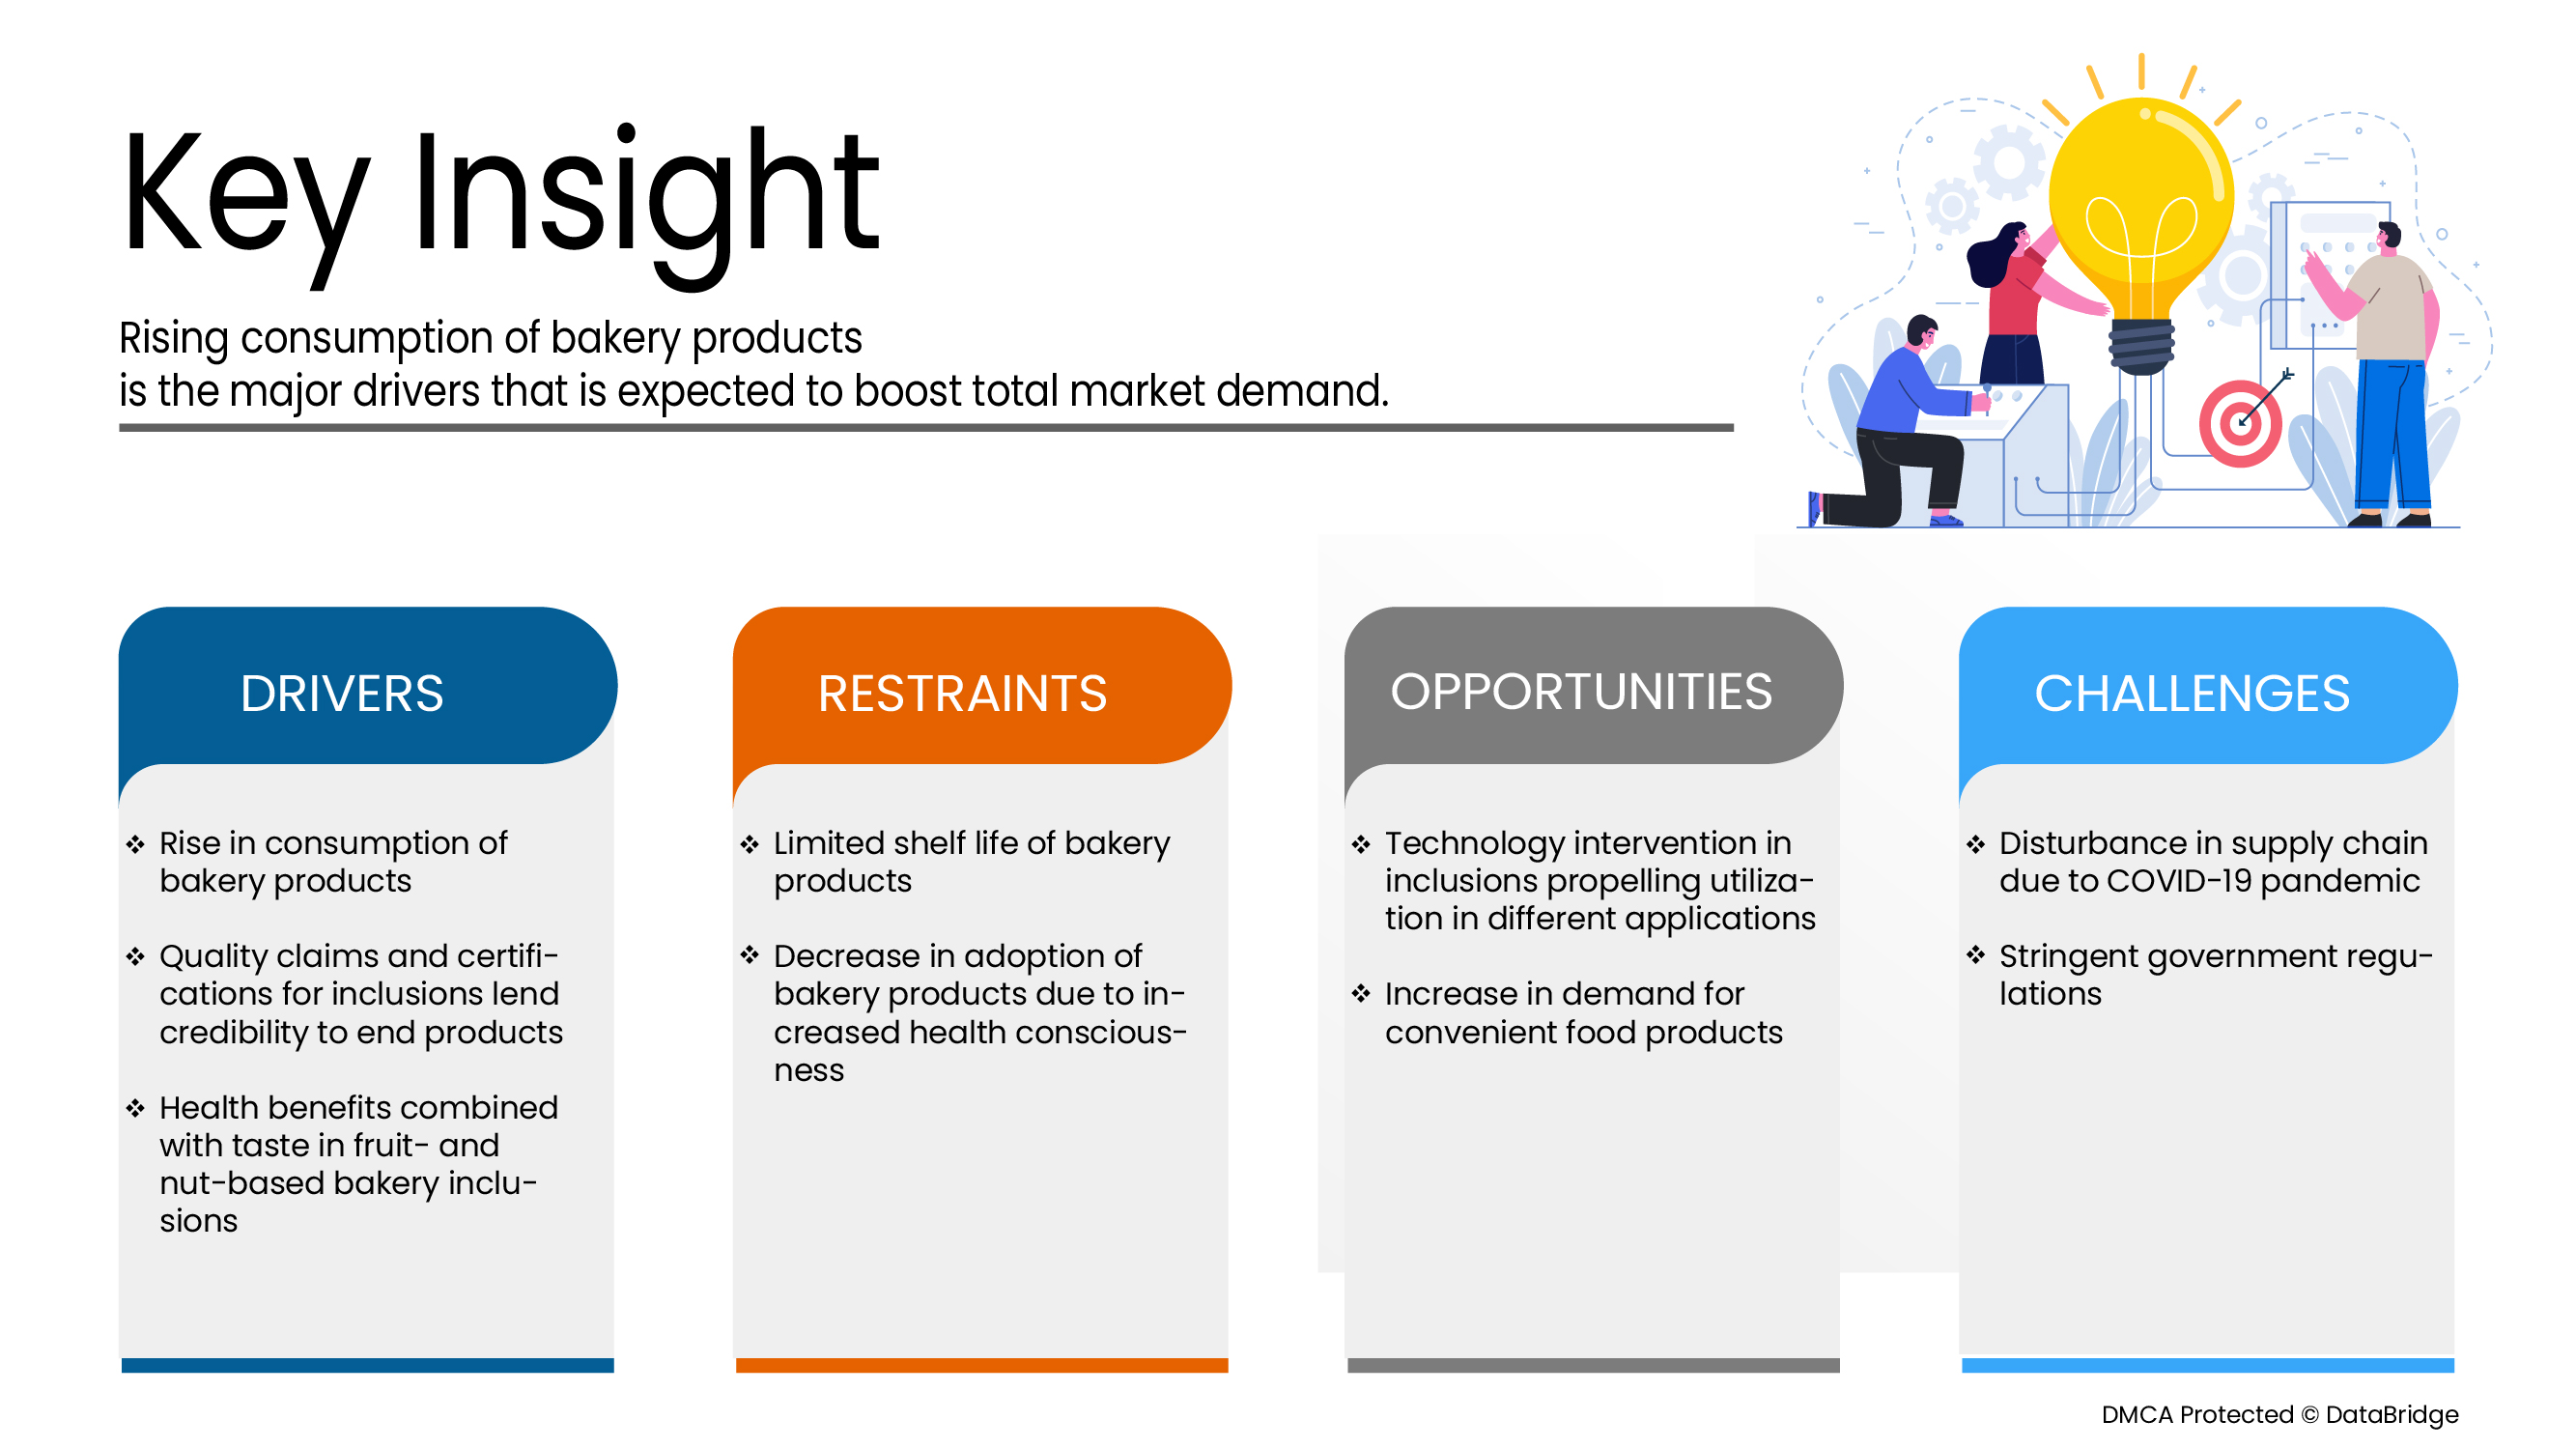
- 烘焙产品消费量不断增长
烘焙食品包括酵母发酵的平底锅面包、炉面包、扁面包、饼干、蛋糕、松饼、曲奇、小圆面包、泡芙和面粉玉米饼。它们由不同的面粉制成,例如小麦粉、高粱粉和许多不同面粉的混合物,并加入不同成分的搅拌器、乳化剂、增味剂、防腐剂和许多其他成分,以增强理想的质地、颜色、味道和香气。烘焙食品中使用不同的内含物,例如巧克力内含物、焦糖内含物、干果和坚果、粗糖、烘焙片、水果内含物和调味糖内含物等。这些内含物为烘焙产品提供了味道和质地。
- 水果和坚果类烘焙食品兼具健康益处和美味
随着肥胖率的上升,对低糖产品的需求也随之增加,因此干果馅料成为全球首选馅料。这些水果馅料为产品增添了天然的甜味。市场上最常用的水果馅料包括苹果、杏、香蕉、樱桃、黑醋栗、黑莓、葡萄、芒果、菠萝和桃子等。
水果内含物具有抗氧化、维生素、矿物质和其他功能性健康益处。此外,由于内含物中糖的天然来源利用趋势不断发展,而不再使用加工糖,推动了对水果内含物的需求。它也吸引了世界各地注重健康的消费者的关注。
机会
- 方便食品需求增加
随着消费者的餐饮消费行为发生显著变化,现代消费者对晚餐解决方案的需求正在迅速增长。虽然人们越来越缺乏时间和技能为家人做饭,但许多消费者愿意在即食食品市场上花钱。这一因素增加了对方便食品零售市场的需求。
由于大多数国家被迫限制人员流动和封锁边境,冠状病毒疫情正在改变消费者的生活方式,使他们更倾向于食用舒适食品。在这个时期,对预制食品的需求至关重要,尤其是在疫情严重打击美国的美国。
限制/挑战
- 烘焙产品的保质期有限
烘焙食品的主要关注点是保持其味道、质地和香气的新鲜度。烘焙产品的保质期有限。各种酶都经过基因改造,通过保持烘焙食品适当的质地、稳定性、新鲜度、体积和香气来提高烘焙产品的新鲜度。这些酶对人体健康有害,预计会抑制烘焙产品市场。
COVID-19 对北美烘焙食品市场的影响
COVID-19 在一定程度上影响了北美烘焙配料市场。由于封锁,制造过程停止,最终用户的需求也下降,这影响了市场。COVID 之后,由于消费者购买模式的变化以及汽车、航空航天和国防、电子和电气、建筑和施工等各种最终用户对烘焙配料的需求逐渐增加,对烘焙配料的需求有所增加。
最新动态
- 2022 年 1 月,Pecan Deluxe Candy Company 荣获 2021 年食品质量与安全奖大型企业奖。该奖项帮助该公司吸引了更多客户群
- 2021 年 4 月,Pecan Deluxe Candy Company 推出了 Popping Boba。该产品的推出帮助该公司扩大了其产品组合
- 2021 年 9 月,欧特家博士收购了 Kuppies,开拓了新业务。此次收购帮助该公司扩大了业务范围和产品组合
- 2021 年 4 月,Pecan Deluxe Candy Company 推出了 Popping Boba。该产品的推出帮助该公司扩大了其产品组合
- 2021 年 9 月,Nimbus Foods Ltd 与 Herza 建立了战略合作伙伴关系。Herza 是功能性巧克力和食品制造用复合物的领先生产商。此次合作帮助该公司扩大了产品范围
北美烘焙配料市场范围
北美烘焙配料市场细分为配料类型、风味、形式、最终用户、来源、应用和分销渠道。这些细分市场之间的增长将帮助您分析行业中增长缓慢的细分市场,并为用户提供有价值的市场概览和市场洞察,以便做出战略决策,确定核心市场应用。
包裹体类型
- 巧克力配料
- 干果和坚果
- 水果夹杂
- 焦糖夹杂物
- 烤制品
- 风味型糖夹心
- 粗糖
- 其他的
根据内含物类型,北美烘焙内含物市场分为巧克力内含物、焦糖内含物、干果和坚果内含物、粗糖内含物、烘焙片内含物、水果内含物、调味糖内含物等。
最终用户
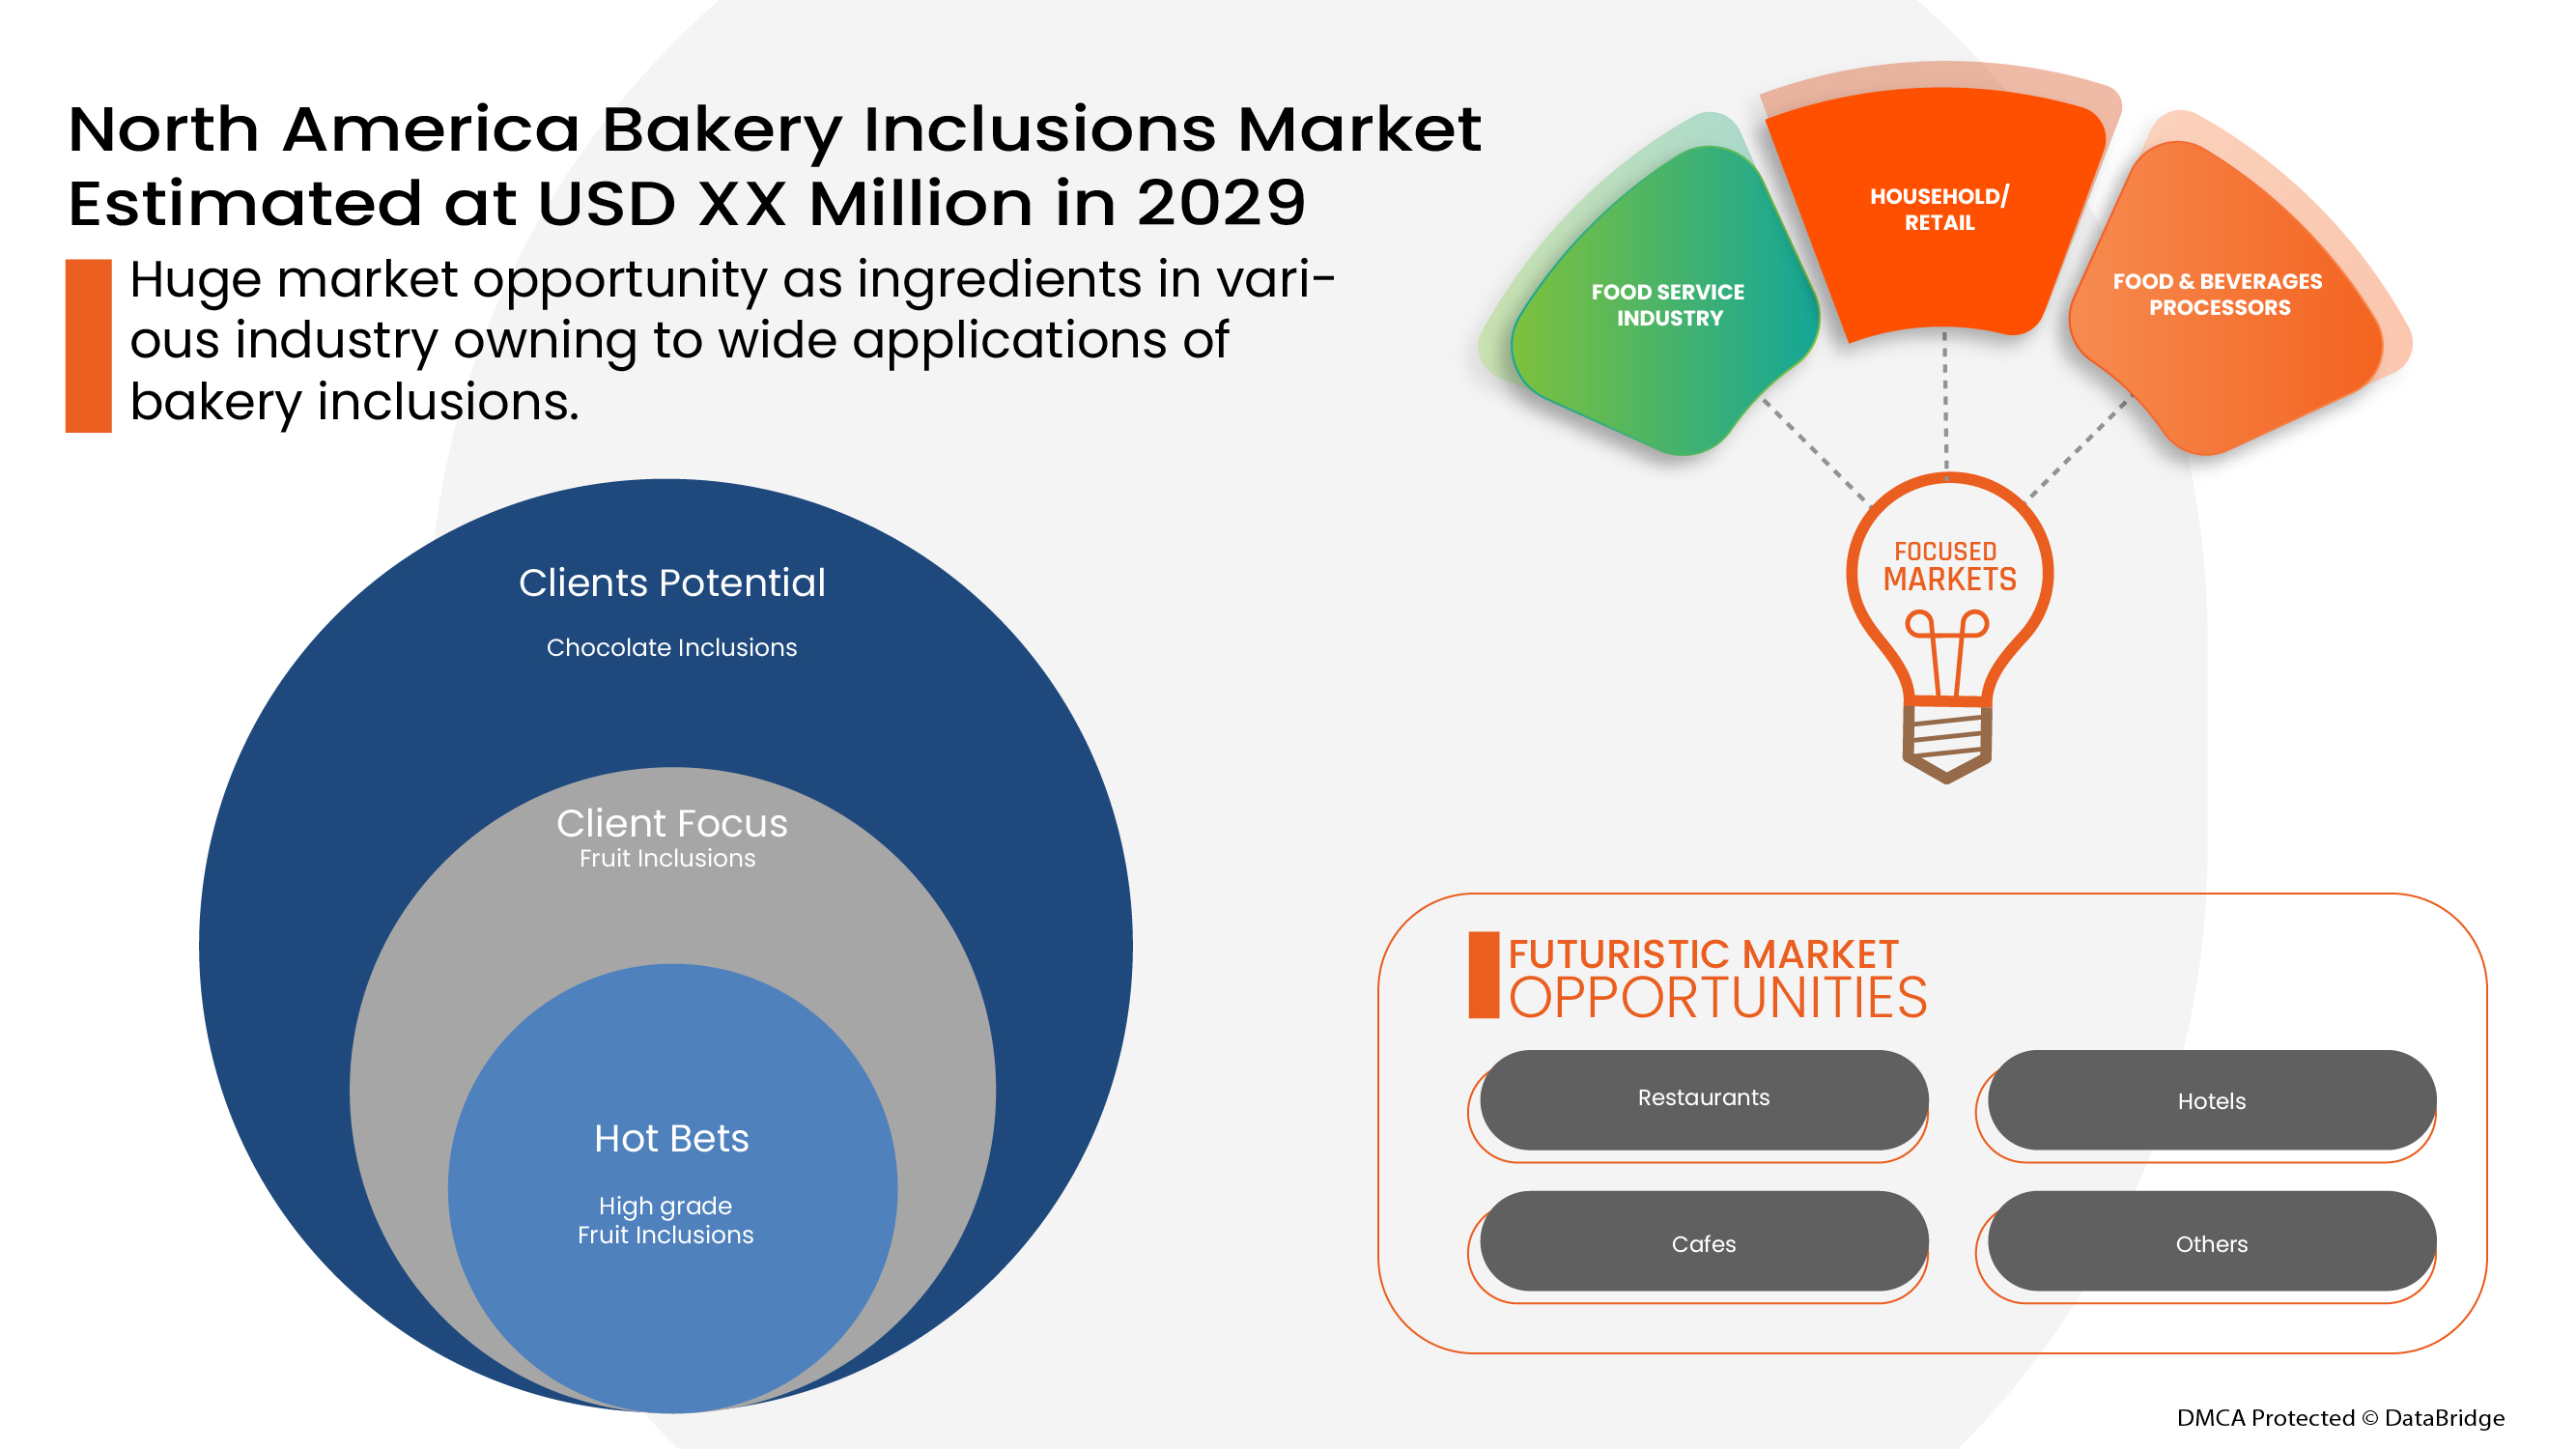
- 食品服务业
- 食品和饮料加工商
- 家庭/零售
根据最终用户,北美烘焙内含物市场分为食品和饮料加工商、食品服务行业以及家庭/零售。
形式
- 干燥
- 液体
根据形式,北美烘焙配料市场分为干性配料和液体配料。
来源
- 基于植物
- 非植物性
根据来源,北美烘焙配料市场分为植物基和非植物基。
应用
- 面包
- 面包卷
- 蛋糕和糕点
- 饼干
- 布朗尼
- 冷冻甜点
- 松饼
- 甜甜圈
- 羊角面包
- 其他的
根据应用,北美烘焙食品市场分为面包、松饼、甜甜圈、羊角面包、面包卷、蛋糕和糕点、饼干和饼干等。
口味类型
- 调味
- 常规的
On the basis of flavor, the North America bakery inclusions market is segmented into the flavor and regular.
DISTRIBUTION CHANNEL
- Direct
- Indirect
On the basis of distribution channel, the North America bakery inclusions market is segmented into the direct and indirect.
North America Bakery Inclusions Market Regional Analysis/Insights
North America bakery inclusions market is analyzed, and market size insights and trends are provided by inclusion type, flavor, form, end user, source, application, and distribution channel.
The regions covered in the bakery inclusions market report are U.S., Canada and Mexico.
U.S. is expected to dominate the North America bakery inclusions market during the forecast period due to the increase in the use of bakery products.
The country section of the report also provides individual market impacting factors and changes in regulations in the market that impact the current and future trends of the market. Data points, such as new and replacement sales, country demographics, disease epidemiology, and import-export tariffs, are some of the major pointers used to forecast the market scenario for individual countries. In addition, the presence and availability of global brands and their challenges faced due to high competition from local and domestic brands and the impact of sales channels are considered while providing forecast analysis of the country data.
Competitive Landscape and North America Bakery Inclusions Market Share Analysis
North America bakery inclusions market competitive landscape provides details by the competitors. Details included are company overview, company financials, revenue generated, market potential, investment in research and development, new market initiatives, North America presence, production sites and facilities, production capacities, company strengths and weaknesses, product launch, product width and breadth, and application dominance. The above data points provided are only related to the companies' focus on the North America bakery inclusions market.
Some of the major players operating in the bakery inclusions market are Kerry, Dr. Oetker, Pecan Deluxe Candy Company, AMERICAN SPRINKLE COMPANY, Girrbach Süßwarendekor GmbH, Cacau Foods do Brasil., Shantou Hehe Technology Co.,Ltd, Barry Callebaut, The Kraft Heinz Company, Cape Foods, Paulaur Corporation, GÜNTHART & Co. KG, Signature Brands, LLC, among others.
Research Methodology
数据收集和基准年分析是使用具有大样本量的数据收集模块完成的。使用市场统计和连贯模型分析和估计市场数据。此外,市场份额分析和关键趋势分析是市场报告中的主要成功因素。DBMR 研究团队使用的关键研究方法是数据三角测量,其中包括数据挖掘、数据变量对市场影响的分析以及主要(行业专家)验证。除此之外,数据模型还包括供应商定位网格、市场时间线分析、市场概览和指南、公司定位网格、公司市场份额分析、测量标准、北美与地区和供应商份额分析。如有进一步询问,请要求分析师致电。
SKU-
Get online access to the report on the World's First Market Intelligence Cloud
- Interactive Data Analysis Dashboard
- Company Analysis Dashboard for high growth potential opportunities
- Research Analyst Access for customization & queries
- Competitor Analysis with Interactive dashboard
- Latest News, Updates & Trend analysis
- Harness the Power of Benchmark Analysis for Comprehensive Competitor Tracking
目录
1 INTRODUCTION
1.1 OBJECTIVES OF THE STUDY
1.2 MARKET DEFINITION
1.3 OVERVIEW OF NORTH AMERICA BAKERY INCLUSIONS MARKET
1.4 LIMITATIONS
1.5 MARKETS COVERED
2 MARKET SEGMENTATION
2.1 MARKETS COVERED
2.2 GEOGRAPHICAL SCOPE
2.3 YEARS CONSIDERED FOR THE STUDY
2.4 CURRENCY AND PRICING
2.5 DBMR TRIPOD DATA VALIDATION MODEL
2.6 MULTIVARIATE MODELLING
2.7 TYPE LIFELINE CURVE
2.8 PRIMARY INTERVIEWS WITH KEY OPINION LEADERS
2.9 DBMR MARKET POSITION GRID
2.1 VENDOR SHARE ANALYSIS
2.11 SECONDARY SOURCES
2.12 ASSUMPTIONS
3 EXECUTIVE SUMMARY
4 PREMIUM INSIGHTS
4.1 BRAND COMPETITIVE ANALYSIS
4.2 BRAND LEVEL VS PRIVATE LABEL
4.3 FUTURE TRENDS
4.3.1 TASTE
4.3.2 LOW SUGAR, LOW CALORIE, AND CLEAN LABEL DEMAND
4.4 HOW FLAVORS ARE DELIVERED TO BAKERY PRODUCERS
4.4.1 INTERNAL FLAVORING
4.4.2 FILLINGS AND ICING
4.5 IMPORT & EXPORT ANALYSIS OF NORTH AMERICA BAKERY INCLUSION MARKET
4.5.1 IMPORT-EXPORT ANALYSIS OF CHOCOLATE
4.5.2 IMPORT-EXPORT ANALYSIS OF EDIBLE FRUIT AND NUTS
4.6 MARKETING STRATEGIES
4.7 PATENT ANALYSIS OF NORTH AMERICA BAKERY INCLUSIONS MARKET
4.7.1 DBMR ANALYSIS
4.7.2 COUNTRY-LEVEL ANALYSIS
4.7.3 YEARWISE ANALYSIS
4.8 NORTH AMERICA BAKERY INCLUSION MARKET PRODUCTION AND CONSUMPTION
5 SUPPLY CHAIN OF NORTH AMERICA BAKERY INCLUSIONS MARKET
5.1 RAW MATERIAL PROCUREMENT
5.2 MANUFACTURING
5.3 PROCESSED INCLUSIONS:
5.4 MARKETING AND DISTRIBUTION
5.5 END USERS
6 NORTH AMERICA BAKERY INCLUSION MARKET: REGULATIONS
6.1 COMMISSION REGULATION (EU)
6.2 EUROPEAN UNION
6.3 REGULATIONS BY USFDA
6.4 GOVERNMENT OF CANADA
7 MARKET OVERVIEW
7.1 DRIVERS
7.1.1 RISE IN CONSUMPTION OF BAKERY PRODUCTS
7.1.2 HEALTH BENEFITS COMBINED WITH TASTE IN FRUIT- AND NUT-BASED BAKERY INCLUSIONS
7.1.3 QUALITY CLAIMS AND CERTIFICATIONS FOR INCLUSIONS LEND CREDIBILITY TO END PRODUCTS
7.1.4 RISING DISPOSABLE INCOME COUPLED WITH CHANGING LIFESTYLES DUE TO RAPID URBANIZATION
7.2 RESTRAINTS
7.2.1 LIMITED SHELF LIFE OF BAKERY PRODUCTS
7.2.2 DECREASE IN ADOPTION OF BAKERY PRODUCTS DUE TO INCREASED HEALTH CONSCIOUSNESS
7.3 OPPORTUNITIES
7.3.1 INCREASE IN DEMAND FOR CONVENIENT FOOD PRODUCTS
7.3.2 GROW IN DEMAND FOR VEGAN AND PLANT-BASED BAKERY PRODUCTS
7.3.3 TECHNOLOGY INTERVENTION IN INCLUSIONS PROPELLING UTILIZATION IN DIFFERENT APPLICATIONS
7.4 CHALLENGES
7.4.1 DISTURBANCE IN SUPPLY CHAIN DUE TO COVID-19 PANDEMIC
7.4.2 STRINGENT GOVERNMENT REGULATIONS
8 NORTH AMERICA BAKERY INCLUSIONS MARKET, BY INCLUSION TYPE
8.1 OVERVIEW
8.2 CHOCOLATE INCLUSIONS
8.2.1 CHOCOLATE CHUNKS
8.2.1.1 DARK
8.2.1.2 MILK
8.2.1.3 WHITE
8.2.2 CHOCOLATE FLAKES
8.2.2.1 DARK
8.2.2.2 MILK
8.2.2.3 WHITE
8.2.3 CHOCOLATE SYRUPS
8.2.3.1 DARK
8.2.3.2 MILK
8.2.3.3 WHITE
8.2.4 OTHERS
8.2.4.1 DARK
8.2.4.2 MILK
8.2.4.3 WHITE
8.3 DRIED FRUITS AND NUTS
8.3.1 ALMOND
8.3.2 WALNUTS
8.3.3 HAZELNUTS
8.3.4 CASHEW
8.3.5 CHESTNUTS
8.3.6 BRAZIL NUTS
8.3.7 MACADAMIA NUTS
8.3.8 HICKORY NUTS
8.3.9 RESINS
8.3.10 OTHERS
8.4 FRUIT INCLUSION
8.4.1 BERRIES
8.4.1.1 STRAWBERRY
8.4.1.2 BLACKBERRY
8.4.1.3 CRANBERRY
8.4.1.4 BLUEBERRY
8.4.1.5 RASPBERRY
8.4.1.6 OTHERS
8.4.2 CHERRY
8.4.3 APPLE
8.4.4 BANANA
8.4.5 CITRUS FRUITS
8.4.5.1 LEMON
8.4.5.2 LIME
8.4.5.3 ORANGE
8.4.5.4 GRAPE FRUIT
8.4.5.5 OTHERS
8.4.6 BLACKCURRANT
8.4.7 MANGO
8.4.8 APRICOT
8.4.9 PINEAPPLE
8.4.10 PEACH
8.4.11 GRAPE
8.4.12 RIG
8.4.13 OTHERS
8.5 CARAMEL INCLUSIONS
8.5.1 NUTS SABLAGE
8.5.2 CARAMEL CRISPY BITES
8.5.3 CARAMEL CRUNCHES
8.6 BAKED PIECES
8.7 FLAVOR TYPED SUGAR INCLUSION
8.8 COARSE SUGAR
8.9 OTHERS
9 NORTH AMERICA BAKERY INCLUSIONS MARKET, BY END USER
9.1 OVERVIEW
9.2 FOOD SERVICE INDUSTRY
9.2.1 RESTAURANTS
9.2.2 HOTELS
9.2.3 CAFES
9.2.4 SHAKES AND SMOOTHIES PARLORS
9.2.5 OTHERS
9.3 FOOD & BEVERAGES PROCESSORS
9.4 HOUSEHOLD/RETAIL
10 NORTH AMERICA BAKERY INCLUSIONS MARKET, BY FORM
10.1 OVERVIEW
10.2 DRY
10.2.1 FLAKES & CRUNCHES
10.2.2 CHIPS & NIBS
10.2.3 POWDER
10.2.4 CUBES/PIECES
10.2.5 GRANULES
10.3 LIQUID
10.3.1 CONCENTRATES
10.3.2 PUREE
11 NORTH AMERICA BAKERY INCLUSIONS MARKET, BY SOURCE
11.1 OVERVIEW
11.2 PLANT BASED
11.3 NON-PLANT BASED
12 NORTH AMERICA BAKERY INCLUSIONS MARKET, BY APPLICATION
12.1 OVERVIEW
12.2 BREADS
12.3 ROLLS
12.4 CAKES & PASTRIES
12.5 COOKIES & BISCUITS
12.6 BROWNIES
12.7 FROZEN DESSERT
12.8 MUFFINS
12.9 DOUGHNUTS
12.1 CROISSANTS
12.11 OTHERS
13 NORTH AMERICA BAKERY INCLUSIONS MARKET, BY FLAVOR TYPE
13.1 OVERVIEW
13.2 FLAVORED
13.2.1 CARAMEL
13.2.2 BUTTERSCOTCH
13.2.3 STRAWBERRY
13.2.4 VANILLA
13.2.5 BLUEBERRY
13.2.6 MOCHA
13.2.7 BANANA
13.2.8 CHERRY
13.2.9 PEPPERMINT
13.2.10 OTHERS
13.3 REGULAR
14 NORTH AMERICA BAKERY INCLUSIONS MARKET, BY DISTRIBUTION CHANNEL
14.1 OVERVIEW
14.2 INDIRECT
14.2.1 STORE-BASED RETAILING
14.2.1.1 SUPERMARKETS/HYPERMARKETS
14.2.1.2 SPECIALTY STORES
14.2.1.3 CONVENIENCE STORES
14.2.1.4 WHOLESALERS
14.2.1.5 GROCERY STORES
14.2.1.6 OTHERS
14.2.2 NON-STORE RETAILING
14.2.2.1 ONLINE
14.2.2.2 VENDING
14.3 DIRECT
15 NORTH AMERICA BAKERY INCLUSIONS MARKET
15.1 NORTH AMERICA
15.1.1 U.S.
15.1.2 CANADA
15.1.3 MEXICO
16 COMPANY LANDSCAPE
16.1 COMPANY SHARE ANALYSIS: NORTH AMERICA
17 SWOT ANALYSIS
18 COMPANY PROFILE
18.1 DR. OETKER
18.1.1 COMPANY SNAPSHOT
18.1.2 PRODUCT PORTFOLIO
18.1.3 RECENT DEVELOPMENT
18.1.4 SWOT ANALYSIS
18.2 KERRY
18.2.1 COMPANY SNAPSHOT
18.2.2 REVENUS ANALYSIS
18.2.3 PRODUCT PORTFOLIO
18.2.4 RECENT DEVELOPMENTS
18.2.5 SWOT ANALYSIS
18.3 BARRY CALLEBAUT
18.3.1 COMPANY SNAPSHOT
18.3.2 REVENUS ANALYSIS
18.3.3 PRODUCT PORTFOLIO
18.3.4 RECENT DEVELOPMENT
18.3.5 SWOT ANALYSIS
18.4 THE KRAFT HEINZ COMPANY
18.4.1 COMPANY SNAPSHOT
18.4.2 REVENUS ANALYSIS
18.4.3 PRODUCT PORTFOLIO
18.4.4 RECENT DEVELOPMENT
18.4.5 SWOT ANALYSIS
18.5 PECAN DELUXE CANDY COMPANY
18.5.1 COMPANY SNAPSHOT
18.5.2 PRODUCT PORTFOLIO
18.5.3 RECENT DEVELOPMENTS
18.5.4 SWOT ANALYSIS
18.6 AMERICAN SPRINKLE COMPANY
18.6.1 COMPANY SNAPSHOT
18.6.2 PRODUCT PORTFOLIO
18.6.3 RECENT DEVELOPMENT
18.7 BRITANNIA SUPERFINE
18.7.1 COMPANY SNAPSHOT
18.7.2 PRODUCT PORTFOLIO
18.7.3 RECENT DEVELOPMENTS
18.8 CACAU FOODS DO BRASIL.
18.8.1 COMPANY SNAPSHOT
18.8.2 PRODUCT PORTFOLIO
18.8.3 RECENT DEVELOPMENTS
18.9 CAPE FOODS
18.9.1 COMPANY SNAPSHOT
18.9.2 PRODUCT PORTFOLIO
18.9.3 RECENT DEVELOPMENTS
18.1 GIRRBACH SÜßWARENDEKOR GMBH
18.10.1 COMPANY SNAPSHOT
18.10.2 PRODUCT PORTFOLIO
18.10.3 RECENT DEVELOPMENTS
18.11 GÜNTHART & CO. KG
18.11.1 COMPANY SNAPSHOT
18.11.2 PRODUCT PORTFOLIO
18.11.3 RECENT DEVELOPMENTS
18.12 HANNS G. WERNER GMBH + CO. KG
18.12.1 COMPANY SNAPSHOT
18.12.2 PRODUCT PORTFOLIO
18.12.3 RECENT DEVELOPMENTS
18.13 NIMBUS FOODS LTD
18.13.1 COMPANY SNAPSHOT
18.13.2 PRODUCT PORTFOLIO
18.13.3 RECENT DEVELOPMENT
18.14 PAULAUR CORPORATION
18.14.1 COMPANY SNAPSHOT
18.14.2 PRODUCT PORTFOLIO
18.14.3 RECENT DEVELOPMENT
18.15 SHANTOU HEHE TECHNOLOGY CO.,LTD
18.15.1 COMPANY SNAPSHOT
18.15.2 PRODUCT PORTFOLIO
18.15.3 RECENT DEVELOPMENTS
18.16 SIGNATURE BRANDS, LLC.
18.16.1 COMPANY SNAPSHOT
18.16.2 PRODUCT PORTFOLIO
18.16.3 RECENT DEVELOPMENT
19 QUESTIONNAIRE
20 RELATED REPORTS
表格列表
TABLE 1 IMPORT DATA OF PRODUCT: CHOCOLATE (USD THOUSAND)
TABLE 2 EXPORT DATA OF PRODUCT: CHOCOLATE (USD THOUSAND)
TABLE 3 IMPORT DATA OF PRODUCT: EDIBLE FRUIT AND NUTS (USD THOUSAND)
TABLE 4 EXPORT DATA OF PRODUCT: EDIBLE FRUIT AND NUTS (USD THOUSAND)
TABLE 5 CANADA'S BAKERY PRODUCTS, MARKET SIZE BY RETAIL VALUE SALES
TABLE 6 PRODUCTION AND CONSUMPTION OF BREAD 2020
TABLE 7 NORTH AMERICA BAKERY INCLUSIONS MARKET, BY INCLUSION TYPE, 2020-2029 (USD MILLION)
TABLE 8 NORTH AMERICA CHOCOLATE INCLUSIONS IN BAKERY INCLUSIONS MARKET, BY TYPE, 2020-2029 (USD MILLION)
TABLE 9 NORTH AMERICA CHOCOLATE CHUNKS IN BAKERY INCLUSIONS MARKET, BY TYPE, 2020-2029 (USD MILLION)
TABLE 10 NORTH AMERICA CHOCOLATE FLAKES IN BAKERY INCLUSIONS MARKET, BY TYPE, 2020-2029 (USD MILLION)
TABLE 11 NORTH AMERICA CHOCOLATE SYRUPS IN BAKERY INCLUSIONS MARKET, BY TYPE, 2020-2029 (USD MILLION)
TABLE 12 NORTH AMERICA OTHERS IN BAKERY INCLUSIONS MARKET, BY TYPE, 2020-2029 (USD MILLION)
TABLE 13 NORTH AMERICA DRIED FRUITS AND NUTS IN BAKERY INCLUSIONS MARKET, BY TYPE, 2020-2029 (USD MILLION)
TABLE 14 NORTH AMERICA FRUIT INCLUSION IN BAKERY INCLUSIONS MARKET, BY TYPE, 2020-2029 (USD MILLION)
TABLE 15 NORTH AMERICA BERRIES INCLUSION IN BAKERY INCLUSIONS MARKET, BY TYPE, 2020-2029 (USD MILLION)
TABLE 16 NORTH AMERICA CITRUS FRUITS INCLUSION IN BAKERY INCLUSIONS MARKET, BY TYPE, 2020-2029 (USD MILLION)
TABLE 17 NORTH AMERICA CARAMEL INCLUSIONS IN BAKERY INCLUSIONS MARKET, BY TYPE, 2020-2029 (USD MILLION)
TABLE 18 NORTH AMERICA BAKERY INCLUSIONS MARKET, BY END USER, 2020-2029 (USD MILLION)
TABLE 19 NORTH AMERICA FOOD SERVICE INDUSTRY IN BAKERY INCLUSIONS MARKET, BY END USER, 2020-2029 (USD MILLION)
TABLE 20 NORTH AMERICA BAKERY INCLUSIONS MARKET, BY FORM, 2020-2029 (USD MILLION)
TABLE 21 NORTH AMERICA DRY IN BAKERY INCLUSIONS MARKET, BY FORM, 2020-2029 (USD MILLION)
TABLE 22 NORTH AMERICA LIQUID IN BAKERY INCLUSIONS MARKET, BY FORM, 2020-2029 (USD MILLION)
TABLE 23 NORTH AMERICA BAKERY INCLUSIONS MARKET, BY SOURCE, 2020-2029 (USD MILLION)
TABLE 24 NORTH AMERICA BAKERY INCLUSIONS MARKET, BY APPLICATION, 2020-2029 (USD MILLION)
TABLE 25 NORTH AMERICA BAKERY INCLUSIONS MARKET, BY FLAVOR TYPE, 2020-2029 (USD MILLION)
TABLE 26 NORTH AMERICA FLAVORED IN BAKERY INCLUSIONS MARKET, BY FLAVOR TYPE, 2020-2029 (USD MILLION)
TABLE 27 NORTH AMERICA BAKERY INCLUSIONS MARKET, BY DISTRIBUTION CHANNEL, 2020-2029 (USD MILLION)
TABLE 28 NORTH AMERICA INDIRECT IN BAKERY INCLUSIONS MARKET, BY DISTRIBUTION CHANNEL, 2020-2029 (USD MILLION)
TABLE 29 NORTH AMERICA STORE-BASED RETAILING IN BAKERY INCLUSIONS MARKET, BY DISTRIBUTION CHANNEL, 2020-2029 (USD MILLION)
TABLE 30 NORTH AMERICA NON-STORE RETAILING IN BAKERY INCLUSIONS MARKET, BY DISTRIBUTION CHANNEL, 2020-2029 (USD MILLION)
TABLE 31 NORTH AMERICA BAKERY INCLUSIONS MARKET, BY COUNTRY, 2020-2029 (USD MILLION)
TABLE 32 NORTH AMERICA BAKERY INCLUSIONS MARKET, BY INCLUSION TYPE, 2020-2029 (USD MILLION)
TABLE 33 NORTH AMERICA CHOCOLATE CHUNKS IN BAKERY INCLUSIONS MARKET, BY TYPE, 2020-2029 (USD MILLION)
TABLE 34 NORTH AMERICA CHOCOLATE CHUNKS IN BAKERY INCLUSIONS MARKET, BY TYPE, 2020-2029 (USD MILLION)
TABLE 35 NORTH AMERICA CHOCOLATE FLAKES IN BAKERY INCLUSIONS MARKET, BY TYPE, 2020-2029 (USD MILLION)
TABLE 36 NORTH AMERICA CHOCOLATE SYRUPS IN BAKERY INCLUSIONS MARKET, BY TYPE, 2020-2029 (USD MILLION)
TABLE 37 NORTH AMERICA OTHERS IN BAKERY INCLUSIONS MARKET, BY TYPE, 2020-2029 (USD MILLION)
TABLE 38 NORTH AMERICA CARAMEL INCLUSIONS IN BAKERY INCLUSIONS MARKET, BY TYPE, 2020-2029 (USD MILLION)
TABLE 39 NORTH AMERICA DRIED FRUITS AND NUTS IN BAKERY INCLUSIONS MARKET, BY TYPE, 2020-2029 (USD MILLION)
TABLE 40 NORTH AMERICA FRUIT INCLUSION IN BAKERY INCLUSIONS MARKET, BY TYPE, 2020-2029 (USD MILLION)
TABLE 41 NORTH AMERICA BERRIES IN BAKERY INCLUSIONS MARKET, BY TYPE, 2020-2029 (USD MILLION)
TABLE 42 NORTH AMERICA CITRUS FRUITS INCLUSION IN BAKERY INCLUSIONS MARKET, BY TYPE, 2020-2029 (USD MILLION)
TABLE 43 NORTH AMERICA BAKERY INCLUSIONS MARKET, BY END USER, 2020-2029 (USD MILLION)
TABLE 44 NORTH AMERICA FOOD SERVICE INDUSTRY IN BAKERY INCLUSIONS MARKET, BY END USER, 2020-2029 (USD MILLION)
TABLE 45 NORTH AMERICA BAKERY INCLUSIONS MARKET, BY FORM, 2020-2029 (USD MILLION)
TABLE 46 NORTH AMERICA DRY IN BAKERY INCLUSIONS MARKET, BY FORM, 2020-2029 (USD MILLION)
TABLE 47 NORTH AMERICA LIQUID IN BAKERY INCLUSIONS MARKET, BY FORM, 2020-2029 (USD MILLION)
TABLE 48 NORTH AMERICA BAKERY INCLUSIONS MARKET, BY SOURCE, 2020-2029 (USD MILLION)
TABLE 49 NORTH AMERICA BAKERY INCLUSIONS MARKET, BY APPLICATION, 2020-2029 (USD MILLION)
TABLE 50 NORTH AMERICA BAKERY INCLUSIONS MARKET, BY FLAVOR TYPE, 2020-2029 (USD MILLION)
TABLE 51 NORTH AMERICA FLAVORED IN BAKERY INCLUSIONS MARKET, BY FLAVOR TYPE, 2020-2029 (USD MILLION)
TABLE 52 NORTH AMERICA BAKERY INCLUSIONS MARKET, BY DISTRIBUTION CHANNEL, 2020-2029 (USD MILLION)
TABLE 53 NORTH AMERICA INDIRECT IN BAKERY INCLUSIONS MARKET, BY DISTRIBUTION CHANNEL, 2020-2029 (USD MILLION)
TABLE 54 NORTH AMERICA STORE-BASED RETAILING IN BAKERY INCLUSIONS MARKET, BY DISTRIBUTION CHANNEL, 2020-2029 (USD MILLION)
TABLE 55 NORTH AMERICA NON-STORE RETAILING IN BAKERY INCLUSIONS MARKET, BY DISTRIBUTION CHANNEL, 2020-2029 (USD MILLION)
TABLE 56 U.S. BAKERY INCLUSIONS MARKET, BY INCLUSION TYPE, 2020-2029 (USD MILLION)
TABLE 57 U.S. CHOCOLATE INCLUSIONS IN BAKERY INCLUSIONS MARKET, BY TYPE, 2020-2029 (USD MILLION)
TABLE 58 U.S. CHOCOLATE CHUNKS IN BAKERY INCLUSIONS MARKET, BY TYPE, 2020-2029 (USD MILLION)
TABLE 59 U.S. CHOCOLATE FLAKES IN BAKERY INCLUSIONS MARKET, BY TYPE, 2020-2029 (USD MILLION)
TABLE 60 U.S. CHOCOLATE SYRUPS IN BAKERY INCLUSIONS MARKET, BY TYPE, 2020-2029 (USD MILLION)
TABLE 61 U.S. OTHERS IN BAKERY INCLUSIONS MARKET, BY TYPE, 2020-2029 (USD MILLION)
TABLE 62 U.S. CARAMEL INCLUSIONS IN BAKERY INCLUSIONS MARKET, BY TYPE, 2020-2029 (USD MILLION)
TABLE 63 U.S. DRIED FRUITS AND NUTS IN BAKERY INCLUSIONS MARKET, BY TYPE, 2020-2029 (USD MILLION)
TABLE 64 U.S. FRUIT INCLUSION IN BAKERY INCLUSIONS MARKET, BY TYPE, 2020-2029 (USD MILLION)
TABLE 65 U.S. BERRIES IN BAKERY INCLUSIONS MARKET, BY TYPE, 2020-2029 (USD MILLION)
TABLE 66 U.S. CITRUS FRUITS INCLUSION IN BAKERY INCLUSIONS MARKET, BY TYPE, 2020-2029 (USD MILLION)
TABLE 67 U.S. BAKERY INCLUSIONS MARKET, BY END USER, 2020-2029 (USD MILLION)
TABLE 68 U.S. FOOD SERVICE INDUSTRY IN BAKERY INCLUSIONS MARKET, BY END USER, 2020-2029 (USD MILLION)
TABLE 69 U.S. BAKERY INCLUSIONS MARKET, BY FORM, 2020-2029 (USD MILLION)
TABLE 70 U.S. DRY IN BAKERY INCLUSIONS MARKET, BY FORM, 2020-2029 (USD MILLION)
TABLE 71 U.S. LIQUID IN BAKERY INCLUSIONS MARKET, BY FORM, 2020-2029 (USD MILLION)
TABLE 72 U.S. BAKERY INCLUSIONS MARKET, BY SOURCE, 2020-2029 (USD MILLION)
TABLE 73 U.S. BAKERY INCLUSIONS MARKET, BY APPLICATION, 2020-2029 (USD MILLION)
TABLE 74 U.S. BAKERY INCLUSIONS MARKET, BY FLAVOR TYPE, 2020-2029 (USD MILLION)
TABLE 75 U.S. FLAVORED IN BAKERY INCLUSIONS MARKET, BY FLAVOR TYPE, 2020-2029 (USD MILLION)
TABLE 76 U.S. BAKERY INCLUSIONS MARKET, BY DISTRIBUTION CHANNEL, 2020-2029 (USD MILLION)
TABLE 77 U.S. INDIRECT IN BAKERY INCLUSIONS MARKET, BY DISTRIBUTION CHANNEL, 2020-2029 (USD MILLION)
TABLE 78 U.S. STORE-BASED RETAILING IN BAKERY INCLUSIONS MARKET, BY DISTRIBUTION CHANNEL, 2020-2029 (USD MILLION)
TABLE 79 U.S. NON-STORE RETAILING IN BAKERY INCLUSIONS MARKET, BY DISTRIBUTION CHANNEL, 2020-2029 (USD MILLION)
TABLE 80 CANADA BAKERY INCLUSIONS MARKET, BY INCLUSION TYPE, 2020-2029 (USD MILLION)
TABLE 81 CANADA CHOCOLATE INCLUSIONS IN BAKERY INCLUSIONS MARKET, BY TYPE, 2020-2029 (USD MILLION)
TABLE 82 CANADA CHOCOLATE CHUNKS IN BAKERY INCLUSIONS MARKET, BY TYPE, 2020-2029 (USD MILLION)
TABLE 83 CANADA CHOCOLATE FLAKES IN BAKERY INCLUSIONS MARKET, BY TYPE, 2020-2029 (USD MILLION)
TABLE 84 CANADA CHOCOLATE SYRUPS IN BAKERY INCLUSIONS MARKET, BY TYPE, 2020-2029 (USD MILLION)
TABLE 85 CANADA OTHERS IN BAKERY INCLUSIONS MARKET, BY TYPE, 2020-2029 (USD MILLION)
TABLE 86 CANADA CARAMEL INCLUSIONS IN BAKERY INCLUSIONS MARKET, BY TYPE, 2020-2029 (USD MILLION)
TABLE 87 CANADA DRIED FRUITS AND NUTS IN BAKERY INCLUSIONS MARKET, BY TYPE, 2020-2029 (USD MILLION)
TABLE 88 CANADA FRUIT INCLUSION IN BAKERY INCLUSIONS MARKET, BY TYPE, 2020-2029 (USD MILLION)
TABLE 89 CANADA BERRIES IN BAKERY INCLUSIONS MARKET, BY TYPE, 2020-2029 (USD MILLION)
TABLE 90 CANADA CITRUS FRUITS INCLUSION IN BAKERY INCLUSIONS MARKET, BY TYPE, 2020-2029 (USD MILLION)
TABLE 91 CANADA BAKERY INCLUSIONS MARKET, BY END USER, 2020-2029 (USD MILLION)
TABLE 92 CANADA FOOD SERVICE INDUSTRY IN BAKERY INCLUSIONS MARKET, BY END USER, 2020-2029 (USD MILLION)
TABLE 93 CANADA BAKERY INCLUSIONS MARKET, BY FORM, 2020-2029 (USD MILLION)
TABLE 94 CANADA DRY IN BAKERY INCLUSIONS MARKET, BY FORM, 2020-2029 (USD MILLION)
TABLE 95 CANADA LIQUID IN BAKERY INCLUSIONS MARKET, BY FORM, 2020-2029 (USD MILLION)
TABLE 96 CANADA BAKERY INCLUSIONS MARKET, BY SOURCE, 2020-2029 (USD MILLION)
TABLE 97 CANADA BAKERY INCLUSIONS MARKET, BY APPLICATION, 2020-2029 (USD MILLION)
TABLE 98 CANADA BAKERY INCLUSIONS MARKET, BY FLAVOR TYPE, 2020-2029 (USD MILLION)
TABLE 99 CANADA FLAVORED IN BAKERY INCLUSIONS MARKET, BY FLAVOR TYPE, 2020-2029 (USD MILLION)
TABLE 100 CANADA BAKERY INCLUSIONS MARKET, BY DISTRIBUTION CHANNEL, 2020-2029 (USD MILLION)
TABLE 101 CANADA INDIRECT IN BAKERY INCLUSIONS MARKET, BY DISTRIBUTION CHANNEL, 2020-2029 (USD MILLION)
TABLE 102 CANADA STORE-BASED RETAILING IN BAKERY INCLUSIONS MARKET, BY DISTRIBUTION CHANNEL, 2020-2029 (USD MILLION)
TABLE 103 CANADA NON-STORE RETAILING IN BAKERY INCLUSIONS MARKET, BY DISTRIBUTION CHANNEL, 2020-2029 (USD MILLION)
TABLE 104 MEXICO BAKERY INCLUSIONS MARKET, BY INCLUSION TYPE, 2020-2029 (USD MILLION)
TABLE 105 MEXICO CHOCOLATE INCLUSIONS IN BAKERY INCLUSIONS MARKET, BY TYPE, 2020-2029 (USD MILLION)
TABLE 106 MEXICO CHOCOLATE CHUNKS IN BAKERY INCLUSIONS MARKET, BY TYPE, 2020-2029 (USD MILLION)
TABLE 107 MEXICO CHOCOLATE FLAKES IN BAKERY INCLUSIONS MARKET, BY TYPE, 2020-2029 (USD MILLION)
TABLE 108 MEXICO CHOCOLATE SYRUPS IN BAKERY INCLUSIONS MARKET, BY TYPE, 2020-2029 (USD MILLION)
TABLE 109 MEXICO OTHERS IN BAKERY INCLUSIONS MARKET, BY TYPE, 2020-2029 (USD MILLION)
TABLE 110 MEXICO CARAMEL INCLUSIONS IN BAKERY INCLUSIONS MARKET, BY TYPE, 2020-2029 (USD MILLION)
TABLE 111 MEXICO DRIED FRUITS AND NUTS IN BAKERY INCLUSIONS MARKET, BY TYPE, 2020-2029 (USD MILLION)
TABLE 112 MEXICO FRUIT INCLUSION IN BAKERY INCLUSIONS MARKET, BY TYPE, 2020-2029 (USD MILLION)
TABLE 113 MEXICO BERRIES IN BAKERY INCLUSIONS MARKET, BY TYPE, 2020-2029 (USD MILLION)
TABLE 114 MEXICO CITRUS FRUITS INCLUSION IN BAKERY INCLUSIONS MARKET, BY TYPE, 2020-2029 (USD MILLION)
TABLE 115 MEXICO BAKERY INCLUSIONS MARKET, BY END USER, 2020-2029 (USD MILLION)
TABLE 116 MEXICO FOOD SERVICE INDUSTRY IN BAKERY INCLUSIONS MARKET, BY END USER, 2020-2029 (USD MILLION)
TABLE 117 MEXICO BAKERY INCLUSIONS MARKET, BY FORM, 2020-2029 (USD MILLION)
TABLE 118 MEXICO DRY IN BAKERY INCLUSIONS MARKET, BY FORM, 2020-2029 (USD MILLION)
TABLE 119 MEXICO LIQUID IN BAKERY INCLUSIONS MARKET, BY FORM, 2020-2029 (USD MILLION)
TABLE 120 MEXICO BAKERY INCLUSIONS MARKET, BY SOURCE, 2020-2029 (USD MILLION)
TABLE 121 MEXICO BAKERY INCLUSIONS MARKET, BY APPLICATION, 2020-2029 (USD MILLION)
TABLE 122 MEXICO BAKERY INCLUSIONS MARKET, BY FLAVOR TYPE, 2020-2029 (USD MILLION)
TABLE 123 MEXICO FLAVORED IN BAKERY INCLUSIONS MARKET, BY FLAVOR TYPE, 2020-2029 (USD MILLION)
TABLE 124 MEXICO BAKERY INCLUSIONS MARKET, BY DISTRIBUTION CHANNEL, 2020-2029 (USD MILLION)
TABLE 125 MEXICO INDIRECT IN BAKERY INCLUSIONS MARKET, BY DISTRIBUTION CHANNEL, 2020-2029 (USD MILLION)
TABLE 126 MEXICO STORE-BASED RETAILING IN BAKERY INCLUSIONS MARKET, BY DISTRIBUTION CHANNEL, 2020-2029 (USD MILLION)
TABLE 127 MEXICO NON-STORE RETAILING IN BAKERY INCLUSIONS MARKET, BY DISTRIBUTION CHANNEL, 2020-2029 (USD MILLION)
图片列表
FIGURE 1 NORTH AMERICA BAKERY INCLUSIONS MARKET: SEGMENTATION
FIGURE 2 NORTH AMERICA BAKERY INCLUSIONS MARKET: DATA TRIANGULATION
FIGURE 3 NORTH AMERICA BAKERY INCLUSIONS MARKET : DROC ANALYSIS
FIGURE 4 NORTH AMERICA BAKERY INCLUSIONS MARKET: REGIONAL VS COUNTRY MARKET ANALYSIS
FIGURE 5 NORTH AMERICA BAKERY INCLUSIONS MARKET : COMPANY RESEARCH ANALYSIS
FIGURE 6 NORTH AMERICA BAKERY INCLUSIONS MARKET : INTERVIEW DEMOGRAPHICS
FIGURE 7 NORTH AMERICA BAKERY INCLUSIONS MARKET : DBMR MARKET POSITION GRID
FIGURE 8 NORTH AMERICA BAKERY INCLUSIONS MARKET : VENDOR SHARE ANALYSIS
FIGURE 9 NORTH AMERICA BAKERY INCLUSIONS MARKET: SEGMENTATION
FIGURE 10 INCREASING DEMAND OF BAKERY PRODUCTS AND INCREASE IN DEMAND OF READY TO EAT PRODUCTS ARE LEADING THE GROWTH OF THE NORTH AMERICA BAKERY INCLUSIONS MARKET IN THE FORECAST PERIOD OF 2022 TO 2029
FIGURE 11 INCLUSION TYPE SEGMENT IS EXPECTED TO ACCOUNT FOR THE LARGEST SHARE OF THE NORTH AMERICA BAKERY INCLUSIONS MARKETIN 2022 & 2029
FIGURE 12 PATENT REGISTERED FOR BAKERY INCLUSIONS, BY COUNTRY
FIGURE 13 PATENT REGISTERED YEAR (2018 - 2022)
FIGURE 14 SUPPLY CHAIN OF NORTH AMERICA BAKERY INCLUSIONS MARKET
FIGURE 15 VALUE CHAIN OF NORTH AMERICA BAKERY INCLUSIONS
FIGURE 16 DRIVERS, RESTRAINTS, OPPORTUNITIES, AND CHALLENGES OF NORTH AMERICA BAKERY INCLUSIONS MARKET
FIGURE 17 AVERAGE ANNUAL EXPENDITURE BY BAKERY PRODUCTS (2017-2020)
FIGURE 18 WORLDWIDE GDP PER CAPITA INCOME (2015-2020)
FIGURE 19 U.S. BAKERY PRODUCTS SALES SHARED IN 2021
FIGURE 20 GLOBAL NUMBER OF PEOPLE SIGNING TO 'VEGANUARY' CAMPAIGN, (2014-2019)
FIGURE 21 NORTH AMERICA BAKERY INCLUSIONS MARKET: BY INCLUSION TYPE, 2021
FIGURE 22 NORTH AMERICA BAKERY INCLUSIONS MARKET: BY END USER, 2021
FIGURE 23 NORTH AMERICA BAKERY INCLUSIONS MARKET: BY FORM, 2021
FIGURE 24 NORTH AMERICA BAKERY INCLUSIONS MARKET: BY SOURCE, 2021
FIGURE 25 NORTH AMERICA BAKERY INCLUSIONS MARKET: BY APPLICATION, 2021
FIGURE 26 NORTH AMERICA BAKERY INCLUSIONS MARKET: BY FLAVOR TYPE, 2021
FIGURE 27 NORTH AMERICA BAKERY INCLUSIONS MARKET: BY DISTRIBUTION CHANNEL, 2021
FIGURE 28 NORTH AMERICA BAKERY INCLUSIONS MARKET: SNAPSHOT (2021)
FIGURE 29 NORTH AMERICA BAKERY INCLUSIONS MARKET: BY COUNTRY (2021)
FIGURE 30 NORTH AMERICA BAKERY INCLUSIONS MARKET: BY COUNTRY (2022 & 2029)
FIGURE 31 NORTH AMERICA BAKERY INCLUSIONS MARKET: BY COUNTRY (2021 & 2029)
FIGURE 32 NORTH AMERICA BAKERY INCLUSIONS MARKET: BY INCLUSION TYPE (2022-2029)
FIGURE 33 NORTH AMERICA BAKERY INCLUSIONS MARKET: COMPANY SHARE 2021 (%)

研究方法
数据收集和基准年分析是使用具有大样本量的数据收集模块完成的。该阶段包括通过各种来源和策略获取市场信息或相关数据。它包括提前检查和规划从过去获得的所有数据。它同样包括检查不同信息源中出现的信息不一致。使用市场统计和连贯模型分析和估计市场数据。此外,市场份额分析和关键趋势分析是市场报告中的主要成功因素。要了解更多信息,请请求分析师致电或下拉您的询问。
DBMR 研究团队使用的关键研究方法是数据三角测量,其中包括数据挖掘、数据变量对市场影响的分析和主要(行业专家)验证。数据模型包括供应商定位网格、市场时间线分析、市场概览和指南、公司定位网格、专利分析、定价分析、公司市场份额分析、测量标准、全球与区域和供应商份额分析。要了解有关研究方法的更多信息,请向我们的行业专家咨询。
可定制
Data Bridge Market Research 是高级形成性研究领域的领导者。我们为向现有和新客户提供符合其目标的数据和分析而感到自豪。报告可定制,包括目标品牌的价格趋势分析、了解其他国家的市场(索取国家列表)、临床试验结果数据、文献综述、翻新市场和产品基础分析。目标竞争对手的市场分析可以从基于技术的分析到市场组合策略进行分析。我们可以按照您所需的格式和数据样式添加您需要的任意数量的竞争对手数据。我们的分析师团队还可以为您提供原始 Excel 文件数据透视表(事实手册)中的数据,或者可以帮助您根据报告中的数据集创建演示文稿。


