欧洲药房自动化市场,按产品(系统、软件和服务)、药房类型(独立、连锁和联邦)、药房规模(大型药房、中型药房和小型药房)、应用(药品分配和包装、药品储存和库存管理)、最终用户(住院药房、门诊药房、零售药房、网上药房、中央配药/邮购药房、药房福利管理组织等)、分销渠道(直接招标和第三方分销商)划分 - 行业趋势和预测到 2030 年。
欧洲药房自动化市场分析与洞察
因用药失误导致的事故和死亡事件不断增加,给整个医疗行业带来了巨大压力。医护人员和药剂师都在寻找更有效、更准确的解决方案,以避免此类频繁发生的医疗事故。此外,随着患者和访客数量不断增加,以及他们各自的安全需求不断增加,药物输送系统也变得越来越复杂。为了解决这一严重问题,药房自动化系统等先进技术正成为最有力的工具。这些工具的目标是减少医疗处方错误并最大限度地保障患者安全。因此,实施此类药房自动化系统有助于医疗服务提供商和药剂师最大限度地减少损失并提高质量和生产力。
此外,技术创新的实施和自动化系统的进步,以及改进的药房自动化系统,带来了更高的成功率,而设备的新应用以及对处方药配制、分配、储存和贴标创新产品的需求增加,正在推动预测期内的市场增长。然而,预计诸如药房自动化系统成本高昂而不愿实施等因素将限制其采用,从而抑制市场增长。
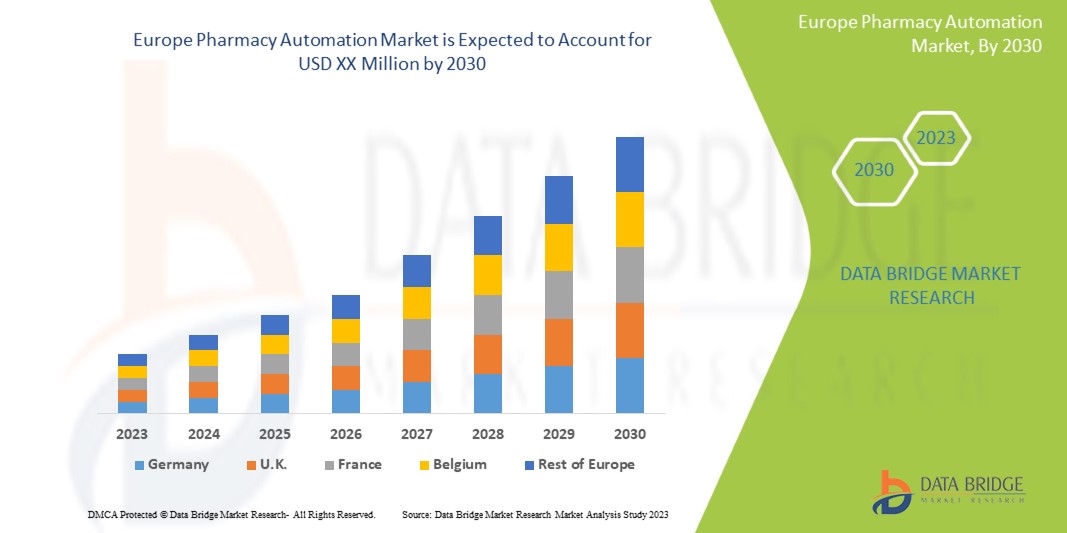
欧洲药房自动化市场支持性强,旨在减少药物分配错误并提高患者安全。Data Bridge Market Research 分析称,在 2023 年至 2030 年的预测期内,欧洲药房自动化市场将以 9.6% 的复合年增长率增长。
|
报告指标 |
细节 |
|
预测期 |
2023 至 2030 年 |
|
基准年 |
2022 |
|
历史年份 |
2021(可定制为 2015 - 2020) |
|
定量单位 |
收入(百万美元)和定价(美元) |
|
涵盖的领域 |
产品(系统、软件和服务)、药房类型(独立药房、连锁药房和联邦药房)、药房规模(大型药房、中型药房和小型药房)、应用(药品调配和包装、药品储存和库存管理)、最终用户(住院药房、门诊药房、零售药房、网上药房、中央配药/邮购药房、药房福利管理组织等)、分销渠道(直接招标和第三方分销商) |
|
覆盖国家 |
德国、法国、意大利、英国、西班牙、荷兰、俄罗斯、瑞士、土耳其、比利时、欧洲其他地区 |
|
涵盖的市场参与者 |
ARxIUM、OMNICELL INC.、Cerner Corporation、Capsa Healthcare、ScriptPro LLC、RxSafe, LLC.、MedAvail Technologies, Inc.、Asteres Inc.、InterLink AI, Inc.、BD、Baxter、Fullscript、McKesson Corporation、Innovation Associates、AmerisourceBergen Corporation、UNIVERSAL LOGISTICS HOLDINGS, INC、Takazono Corporation、TOSHO Inc.、Willach Group、BIQHS、Synergy Medical、Yuyama、APD Algoritmos Procesos y Diseños SA、JVM Europe BV、Genesis Automation LTD、myPak Solutions Pty Ltd.、Demodeks Pharmacy Shelving、Deenova Srl、KUKA AG 和 KLS Pharma Robotics GmbH 等 |
市场定义
药房自动化在现代医疗保健中发挥着重要作用,因为它使药品可以方便地在医院药房或零售药房中交付和分发。药房自动化有助于减少用药错误。它可以防止在手动过程中发生的错误,例如缺少药物信息、缺少患者信息、配药配方、处方错误、跟踪治疗等。最常见的错误类型之一是错误的标签信息和说明。为了改善医疗设施和服务并确保患者安全,减少处方错误至关重要,这就是为什么药房自动化系统以非常重要的方式用于消除存储、库存、使用和检索错误的原因。使用药房自动化是高度可接受的,并且有利于提高药房的效率和准确性。此外,预防用药错误的需求和全球老年人口的增加可能会在预测期内推动市场增长。
欧洲药房自动化市场动态
本节旨在了解市场驱动因素、优势、机遇、限制和挑战。下面将详细讨论所有这些内容:
司机
- 减少用药错误的需求日益增加
医疗失误是各国死亡的主要原因,进一步导致全球住院人数增加。用药失误有多种类型,包括药理和药物患者护理链中的失误:处方失误、配药失误、给药失误、抄录失误、处方错误和“跨环境”失误。
用药错误可能由于多种因素而发生,例如医生和药剂师之间订单协调不当、药房储存方式不当以及使用相同标签而产生的误解。
配药错误包括任何与处方顺序不符或有偏差的情况,例如配发错误的剂量、药物、剂量类型、数量不正确,或标签不足、不正确或不充分。配药前使用说明误导或不足,药物计划、包装或储存不当也被视为用药错误。
在一家每天配发 250 张处方的药房中,错误发生率为每天 4 次,这意味着在全国每年配发的 30 亿张处方中,错误次数估计达到 5150 万次。
- 药品需求不断增长
由于癌症、糖尿病、肥胖症、哮喘等慢性病的发病率不断上升,全球对药品的需求不断增加。患有这些疾病的人依赖于医生开出的一种或另一种药物。
此外,由于医疗设施的改善,欧洲老龄人口正在增加。研发的增加导致针对特定疾病的有效和新型药物的推出,进一步推动了对药品需求的激增。
此外,COVID-19 的出现也增加了全球对各种药物的需求,其中包括维生素 C片和羟氯喹等,导致对药品的需求大幅增加。
机会
- 需要提高药房的工作效率
每家药店都在努力做同样的事情,包括正确有效地配药、提供高质量的患者护理,以及维持可持续的商业模式,让员工有良好的工作满意度,消费者也感到满意。
为了提高药房活动的有效性,支持医院的整体战略和重点提供以患者为中心的高质量护理,许多医院和药房领导已经开始采用药房自动化系统。
采用增强型工作流程和药房自动化软件和系统可能会提高药房的效率。因此,提高药房工作效率的需求为市场增长提供了机会。
克制
- 高资本投资
与手动系统相比,药房自动化系统成本更高。普通药房自动化系统的价格为 59,198.45 美元起,但更奇特的版本价格可高达 591,984.50 美元。
由于实施药房自动化系统所需的资本投入相当高,因此发展中国家的医院和药房以及全球的小型药房很难采用此类系统。因此,高资本投入导致药房自动化系统的采用率下降。因此,它成为市场增长的制约因素。
挑战
- 严格的监管程序
医院和药房必须在国家药品供应链中发挥关键作用:向公众分发药品。在规范药品分发实践的几项州和联邦法规中,有 3 项重要法律与公众和行业从业人员的保护和安全有关。
这些法律适用于药品供应链保护、管制物质监管和安全以及制药危险废物管理,由 FDA、DEA 和 EPA 实施。
因此,自动化制药系统制造商必须遵守各种法规;保持这种合规性是一项繁琐的工作,可能会延迟产品上市。因此,监管程序的严格性对市场增长构成了挑战。
最新动态
- 2023 年 1 月,AmerisourceBergen Corporation 宣布完成对 PharmaLex Holding GmbH 的收购。收购 PharmaLex 将增强 AmerisourceBergen Corporation 的增长战略,提升其在专业服务和欧洲制药制造商服务能力平台方面的领导地位。
- 2022 年 2 月,百特宣布已获得通用漏洞和暴露 (CVE) 计划的授权,成为 CVE 编号机构。
欧洲药房自动化市场
欧洲药房自动化市场根据产品、药房类型、药房规模、应用、最终用户和分销渠道分为六个显著的部分。
产品
- 系统
- 软件
- 服务
根据产品,市场分为系统、软件和服务。
药房类型
- 独立的
- 链
- 联邦
根据药店类型,市场分为独立药店、连锁药店和联邦药店。
药房规模
- 大型药房
- 中型药店
- 小型药房
根据药店规模,市场分为大型药店、中型药店和小型药店。
应用
- 药品调配和包装
- 药品储存
- 库存管理
根据应用,市场分为药品分配和包装、药品储存和库存管理。
最终用户
- 住院药房
- 门诊药房
- 零售药店
- 网上药店
- 中央补货/邮购药房
- 药房福利管理组织
- 其他的
根据最终用户,市场细分为住院药房、门诊药房、零售药房、网上药房、中央配药/邮购药房、药房福利管理组织等。
分销渠道
- 直接招标
- 第三方分销商
根据分销渠道,市场分为直接招标和第三方分销商。
欧洲药房自动化市场区域分析/见解
欧洲药房自动化市场根据产品、药房类型、药房规模、应用、最终用户和分销渠道分为六个显著的部分。
本市场报告涵盖的国家包括德国、法国、意大利、英国、西班牙、荷兰、俄罗斯、瑞士、比利时、土耳其和欧洲其他国家。
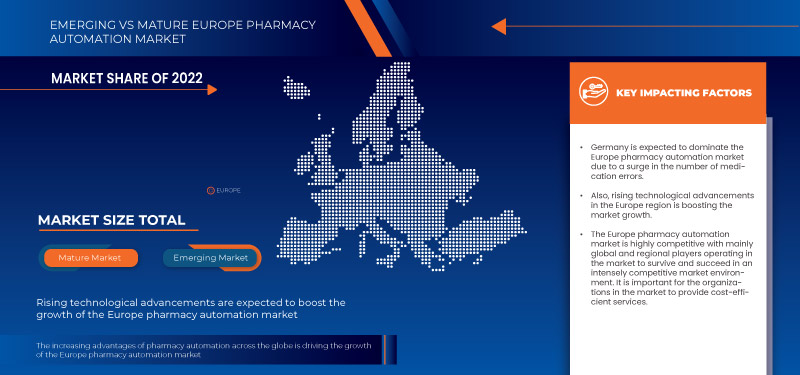
2023 年,由于市场技术进步的提升,预计德国将主导欧洲地区。
报告的国家部分还提供了影响市场当前和未来趋势的各个市场影响因素和国内市场监管变化。新销售、替代销售、国家人口统计、监管法案和进出口关税等数据点是用于预测各个国家市场情景的一些主要指标。此外,在对国家数据进行预测分析时,还考虑了欧洲品牌的存在和可用性以及它们因来自本地和国内品牌的激烈或稀缺竞争而面临的挑战,以及销售渠道的影响。
竞争格局和欧洲药房自动化市场份额分析
欧洲药房自动化市场竞争格局提供了竞争对手的详细信息。详细信息包括公司概况、公司财务状况、产生的收入、市场潜力、研发投资、新市场计划、欧洲业务、生产基地和设施、生产能力、公司优势和劣势、产品发布、产品宽度和广度以及应用主导地位。以上提供的数据点仅与公司对市场的关注有关。
欧洲药房自动化市场的一些主要市场参与者包括 Willach Group、McKesson Corporation、OMNICELL, INC.、Cerner Corporation、Capsa Healthcare、ScriptPro LLC、RxSafe, LLC.、MedAvail Technologies, Inc.、Asteres Inc.、InterLink AI, Inc.、BD、Baxter、Fullscript、Innovation Associates 和 AmerisourceBergen Corporation。
SKU-
Get online access to the report on the World's First Market Intelligence Cloud
- Interactive Data Analysis Dashboard
- Company Analysis Dashboard for high growth potential opportunities
- Research Analyst Access for customization & queries
- Competitor Analysis with Interactive dashboard
- Latest News, Updates & Trend analysis
- Harness the Power of Benchmark Analysis for Comprehensive Competitor Tracking
目录
1 INTRODUCTION
1.1 OBJECTIVES OF THE STUDY
1.2 MARKET DEFINITION
1.3 OVERVIEW OF EUROPE PHARMACY AUTOMATION MARKET
1.4 CURRENCY AND PRICING
1.5 LIMITATIONS
1.6 MARKETS COVERED
2 MARKET SEGMENTATION
2.1 MARKETS COVERED
2.2 GEOGRAPHICAL SCOPE
2.3 YEARS CONSIDERED FOR THE STUDY
2.4 DBMR TRIPOD DATA VALIDATION MODEL
2.5 PRIMARY INTERVIEWS WITH KEY OPINION LEADERS
2.6 MULTIVARIATE MODELLING
2.7 MARKET APPLICATION COVERAGE GRID
2.8 PRODUCT LIFELINE CURVE
2.9 DBMR MARKET POSITION GRID
2.1 VENDOR SHARE ANALYSIS
2.11 SECONDARY SOURCES
2.12 ASSUMPTIONS
3 EXECUTIVE SUMMARY
4 EUROPE PHARMACY AUTOMATION MARKET: REGULATIONS
4.1 EXISTING STATE LAWS AND REGULATIONS FOR THE USE OF AUTOMATED DISPENSING SYSTEMS (ADS) IN THE U.S.
5 MARKET OVERVIEW
5.1 DRIVERS
5.1.1 GROWING NEED TO MINIMIZE MEDICATION ERRORS
5.1.2 RISING DEMAND FOR PHARMACEUTICALS
5.1.3 RISING LABOR COST
5.1.4 ADVANTAGES OF PHARMACY AUTOMATION SYSTEMS OVER MANUAL METHODS
5.1.5 TECHNOLOGICAL ADVANCEMENTS AND PRECISE ROBOTIC TOOLS
5.2 RESTRAINTS
5.2.1 RELUCTANCE AMONG THE HEALTHCARE ORGANIZATIONS TO ADOPT PHARMACY AUTOMATION SYSTEMS
5.2.2 HIGH CAPITAL INVESTMENT
5.2.3 INTEROPERABILITY PROBLEMS IN PHARMACY AUTOMATION
5.3 OPPORTUNITIES
5.3.1 NEED FOR INCREASING THE EFFICIENCY OF WORK WITHIN THE PHARMACIES
5.3.2 RISING HEALTHCARE EXPENDITURE IN EMERGING NATIONS
5.3.3 STRATEGIC INITIATIVES OF KEY MARKET PLAYERS
5.4 CHALLENGES
5.4.1 STRINGENCY OF REGULATORY PROCEDURES
5.4.2 SKILLED WORK-FORCE CHALLENGES
5.4.3 LIMITATIONS OF PHARMACY AUTOMATION SYSTEMS
6 EUROPE PHARMACY AUTOMATION MARKET, BY PRODUCT
6.1 OVERVIEW
6.2 SYSTEMS
6.3 SOFTWARE
6.4 SERVICES
7 EUROPE PHARMACY AUTOMATION MARKET, BY PHARMACY TYPE
7.1 OVERVIEW
7.2 INDEPENDENT
7.3 CHAIN
7.4 FEDERAL
8 EUROPE PHARMACY AUTOMATION MARKET, BY PHARMACY SIZE
8.1 OVERVIEW
8.2 LARGE SIZE PHARMACY
8.3 MEDIUM SIZE PHARMACY
8.4 SMALL SIZE PHARMACY
9 EUROPE PHARMACY AUTOMATION MARKET, BY APPLICATION
9.1 OVERVIEW
9.2 DRUG DISPENSING AND PACKAGING
9.3 DRUG STORAGE
9.4 INVENTORY MANAGEMENT
10 EUROPE PHARMACY AUTOMATION MARKET, BY END USER
10.1 OVERVIEW
10.2 INPATIENT PHARMACIES
10.3 OUTPATIENT PHARMACIES
10.4 RETAIL PHARMACIES
10.5 ONLINE PHARMACIES
10.6 CENTRAL FILL/MAIL ORDER PHARMACIES
10.7 PHARMACY BENEFIT MANAGEMENT ORGANIZATIONS
10.8 OTHERS
11 EUROPE PHARMACY AUTOMATION MARKET, BY DISTRIBUTION CHANNEL
11.1 OVERVIEW
11.2 DIRECT TENDER
11.3 THIRD PARTY DISTRIBUTOR
12 EUROPE PHARMACY AUTOMATION MARKET, BY REGION
12.1 EUROPE
12.1.1 GERMANY
12.1.2 FRANCE
12.1.3 ITALY
12.1.4 U.K.
12.1.5 SPAIN
12.1.6 SWITZERLAND
12.1.7 RUSSIA
12.1.8 NETHERLANDS
12.1.9 BELGIUM
12.1.10 TURKEY
12.1.11 REST OF EUROPE
13 EUROPE PHARMACY AUTOMATION MARKET, COMPANY LANDSCAPE
13.1 COMPANY SHARE ANALYSIS: EUROPE
14 SWOT ANALYSIS
15 COMPANY PROFILE
15.1 OMNICELL, INC.
15.1.1 COMPANY SNAPSHOT
15.1.2 REVENUE ANALYSIS
15.1.3 COMPANY SHARE ANALYSIS
15.1.4 PRODUCT PORTFOLIO
15.1.5 RECENT DEVELOPMENTS
15.2 MCKESSON CORPORATION
15.2.1 COMPANY SNAPSHOT
15.2.2 REVENUE ANALYSIS
15.2.3 COMPANY SHARE ANALYSIS
15.2.4 PRODUCT PORTFOLIO
15.2.5 RECENT DEVELOPMENTS
15.3 AMERISOURCEBERGEN CORPORATION
15.3.1 COMPANY SNAPSHOT
15.3.2 REVENUE ANALYSIS
15.3.3 COMPANY SHARE ANALYSIS
15.3.4 PRODUCT PORTFOLIO
15.3.5 RECENT DEVELOPMENTS
15.4 BAXTER
15.4.1 COMPANY SNAPSHOT
15.4.2 REVENUE ANALYSIS
15.4.3 COMPANY SHARE ANALYSIS
15.4.4 PRODUCT PORTFOLIO
15.4.5 RECENT DEVELOPMENTS
15.5 TOSHO CO., INC.
15.5.1 COMPANY SNAPSHOT
15.5.2 COMPANY SHARE ANALYSIS
15.5.3 PRODUCT PORTFOLIO
15.5.4 RECENT DEVELOPMENTS
15.6 APD ALGORITMOS PROCESOS Y DISEÑOS S.A.
15.6.1 COMPANY SNAPSHOT
15.6.2 PRODUCT PORTFOLIO
15.6.3 RECENT DEVELOPMENTS
15.7 ASTERES INC.
15.7.1 COMPANY SNAPSHOT
15.7.2 PRODUCT PORTFOLIO
15.7.3 RECENT DEVELOPMENTS
15.8 ARXIUM
15.8.1 COMPANY SNAPSHOT
15.8.2 PRODUCT PORTFOLIO
15.8.3 RECENT DEVELOPMENTS
15.9 BD
15.9.1 COMPANY SNAPSHOT
15.9.2 REVENUE ANALYSIS
15.9.3 COMPANY SHARE ANALYSIS
15.9.4 PRODUCT PORTFOLIO
15.9.5 RECENT DEVELOPMENTS
15.1 BIQHS
15.10.1 COMPANY SNAPSHOT
15.10.2 PRODUCT PORTFOLIO
15.10.3 RECENT DEVELOPMENTS
15.11 CAPSA HEALTHCARE
15.11.1 COMPANY SNAPSHOT
15.11.2 PRODUCT PORTFOLIO
15.11.3 RECENT DEVELOPMENTS
15.12 CERNER CORPORATION
15.12.1 COMPANY SNAPSHOT
15.12.2 REVENUE ANALYSIS
15.12.3 PRODUCT PORTFOLIO
15.12.4 RECENT DEVELOPMENTS
15.13 DEENOVA S.R.L.
15.13.1 COMPANY SNAPSHOT
15.13.2 PRODUCT PORTFOLIO
15.13.3 RECENT DEVELOPMENTS
15.14 DEMODEKS PHARMACY SHELVING
15.14.1 COMPANY SNAPSHOT
15.14.2 PRODUCT PORTFOLIO
15.14.3 RECENT DEVELOPMENTS
15.15 FULLSCRIPT
15.15.1 COMPANY SNAPSHOT
15.15.2 PRODUCT PORTFOLIO
15.15.3 RECENT DEVELOPMENTS
15.16 GENESIS AUTOMATION LTD
15.16.1 COMPANY SNAPSHOT
15.16.2 PRODUCT PORTFOLIO
15.16.3 RECENT DEVELOPMENTS
15.17 IA
15.17.1 COMPANY SNAPSHOT
15.17.2 PRODUCT PORTFOLIO
15.17.3 RECENT DEVELOPMENTS
15.18 INTERLINK AI, INC
15.18.1 COMPANY SNAPSHOT
15.18.2 PRODUCT PORTFOLIO
15.18.3 RECENT DEVELOPMENTS
15.19 JVM EUROPE BV
15.19.1 COMPANY SNAPSHOT
15.19.2 PRODUCT PORTFOLIO
15.19.3 RECENT DEVELOPMENTS
15.2 KLS PHARMA ROBOTICS GMBH
15.20.1 COMPANY SNAPSHOT
15.20.2 PRODUCT PORTFOLIO
15.20.3 RECENT DEVELOPMENTS
15.21 KUKA AG
15.21.1 COMPANY SNAPSHOT
15.21.2 REVENUE ANALYSIS
15.21.3 COMPANY SHARE ANALYSIS
15.21.4 PRODUCT PORTFOLIO
15.21.5 RECENT DEVELOPMENTS
15.22 MEDAVAIL TECHNOLOGIES, INC.
15.22.1 COMPANY SNAPSHOT
15.22.2 PRODUCT PORTFOLIO
15.22.3 RECENT DEVELOPMENTS
15.23 MYPAK SOLUTIONS PTY LTD.
15.23.1 COMPANY SNAPSHOT
15.23.2 PRODUCT PORTFOLIO
15.23.3 RECENT DEVELOPMENTS
15.24 RXSAFE, LLC.
15.24.1 COMPANY SNAPSHOT
15.24.2 PRODUCT PORTFOLIO
15.24.3 RECENT DEVELOPMENTS
15.25 SCRIPTPRO LLC
15.25.1 COMPANY SNAPSHOT
15.25.2 COMPANY SHARE ANALYSIS
15.25.3 PRODUCT PORTFOLIO
15.25.4 RECENT DEVELOPMENTS
15.26 SYNERGY MEDICAL
15.26.1 COMPANY SNAPSHOT
15.26.2 PRODUCT PORTFOLIO
15.26.3 RECENT DEVELOPMENTS
15.27 TAKAZONO CORPORATION
15.27.1 COMPANY SNAPSHOT
15.27.2 PRODUCT PORTFOLIO
15.27.3 RECENT DEVELOPMENTS
15.28 UNIVERSAL LOGISTICS HOLDINGS, INC.
15.28.1 COMPANY SNAPSHOT
15.28.2 REVENUE ANALYSIS
15.28.3 PRODUCT PORTFOLIO
15.28.4 RECENT DEVELOPMENTS
15.29 WILLACH GROUP
15.29.1 COMPANY SNAPSHOT
15.29.2 PRODUCT PORTFOLIO
15.29.3 RECENT DEVELOPMENTS
15.3 YUYAMA
15.30.1 COMPANY SNAPSHOT
15.30.2 PRODUCT PORTFOLIO
15.30.3 RECENT DEVELOPMENTS
16 QUESTIONNAIRE
17 RELATED REPORTS
图片列表
FIGURE 1 EUROPE PHARMACY AUTOMATION MARKET: SEGMENTATION
FIGURE 2 EUROPE PHARMACY AUTOMATION MARKET: DATA TRIANGULATION
FIGURE 3 EUROPE PHARMACY AUTOMATION MARKET: DROC ANALYSIS
FIGURE 4 EUROPE PHARMACY AUTOMATION MARKET: EUROPE VS REGIONAL MARKET ANALYSIS
FIGURE 5 EUROPE PHARMACY AUTOMATION MARKET: COMPANY RESEARCH ANALYSIS
FIGURE 6 EUROPE PHARMACY AUTOMATION MARKET: INTERVIEW DEMOGRAPHICS
FIGURE 7 EUROPE PHARMACY AUTOMATION MARKET: MARKET APPLICATION COVERAGE GRID
FIGURE 8 EUROPE PHARMACY AUTOMATION MARKET: DBMR MARKET POSITION GRID
FIGURE 9 EUROPE PHARMACY AUTOMATION MARKET: VENDOR SHARE ANALYSIS
FIGURE 10 EUROPE PHARMACY AUTOMATION MARKET: SEGMENTATION
FIGURE 11 GROWING NEED TO MINIMIZE MEDICATION ERRORS IS EXPECTED TO DRIVE THE EUROPE PHARMACY AUTOMATION MARKET IN THE FORECAST PERIOD OF 2023 TO 2030
FIGURE 12 SYSTEMS SEGMENT IS EXPECTED TO ACCOUNT FOR THE LARGEST SHARE OF THE EUROPE PHARMACY AUTOMATION MARKET IN 2023 AND 2030
FIGURE 13 DRIVERS, RESTRAINTS, OPPORTUNITIES AND CHALLENGES OF EUROPE PHARMACY AUTOMATION MARKET
FIGURE 14 EUROPE PHARMACY AUTOMATION MARKET: BY PRODUCT, 2022
FIGURE 15 EUROPE PHARMACY AUTOMATION MARKET: BY PRODUCT, 2023-2030 (USD
FIGURE 16 EUROPE PHARMACY AUTOMATION MARKET: BY PRODUCT, CAGR (2023-2030)
FIGURE 17 EUROPE PHARMACY AUTOMATION MARKET: BY PRODUCT, LIFELINE CURVE
FIGURE 18 EUROPE PHARMACY AUTOMATION MARKET: BY PHARMACY TYPE, 2022
FIGURE 19 EUROPE PHARMACY AUTOMATION MARKET: BY PHARMACY TYPE, 2023-2030 (USD MILLION)
FIGURE 20 EUROPE PHARMACY AUTOMATION MARKET: BY PHARMACY TYPE, CAGR (2023-2030)
FIGURE 21 EUROPE PHARMACY AUTOMATION MARKET: BY PHARMACY TYPE, LIFELINE CURVE
FIGURE 22 EUROPE PHARMACY AUTOMATION MARKET: BY PHARMACY SIZE, 2022
FIGURE 23 EUROPE PHARMACY AUTOMATION MARKET: BY PHARMACY SIZE, 2023-2030 (USD MILLION)
FIGURE 24 EUROPE PHARMACY AUTOMATION MARKET: BY PHARMACY SIZE, CAGR (2023-2030)
FIGURE 25 EUROPE PHARMACY AUTOMATION MARKET: BY PHARMACY SIZE, LIFELINE CURVE
FIGURE 26 EUROPE PHARMACY AUTOMATION MARKET: BY APPLICATION, 2022
FIGURE 27 EUROPE PHARMACY AUTOMATION MARKET: BY APPLICATION, 2023-2030 (USD MILLION)
FIGURE 28 EUROPE PHARMACY AUTOMATION MARKET: BY APPLICATION, CAGR (2023-2030)
FIGURE 29 EUROPE PHARMACY AUTOMATION MARKET: BY APPLICATION, LIFELINE CURVE
FIGURE 30 EUROPE PHARMACY AUTOMATION MARKET: BY END USER, 2022
FIGURE 31 EUROPE PHARMACY AUTOMATION MARKET: BY END USER, 2023-2030 (USD MILLION)
FIGURE 32 EUROPE PHARMACY AUTOMATION MARKET: BY END USER, CAGR (2023-2030)
FIGURE 33 EUROPE PHARMACY AUTOMATION MARKET: BY END USER, LIFELINE CURVE
FIGURE 34 EUROPE PHARMACY AUTOMATION MARKET: BY DISTRIBUTION CHANNEL, 2022
FIGURE 35 EUROPE PHARMACY AUTOMATION MARKET: BY DISTRIBUTION CHANNEL, 2023-2030 (USD MILLION)
FIGURE 36 EUROPE PHARMACY AUTOMATION MARKET: BY DISTRIBUTION CHANNEL, CAGR (2023-2030)
FIGURE 37 EUROPE PHARMACY AUTOMATION MARKET: BY DISTRIBUTION CHANNEL, LIFELINE CURVE
FIGURE 38 EUROPE PHARMACY AUTOMATION MARKET: SNAPSHOT (2022)
FIGURE 39 EUROPE PHARMACY AUTOMATION MARKET: BY COUNTRY (2022)
FIGURE 40 EUROPE PHARMACY AUTOMATION MARKET: BY COUNTRY (2023 & 2030)
FIGURE 41 EUROPE PHARMACY AUTOMATION MARKET: BY COUNTRY (2022 & 2030)
FIGURE 42 EUROPE PHARMACY AUTOMATION MARKET: BY PRODUCT (2023-2030)
FIGURE 43 EUROPE PHARMACY AUTOMATION MARKET: COMPANY SHARE 2022 (%)

研究方法
数据收集和基准年分析是使用具有大样本量的数据收集模块完成的。该阶段包括通过各种来源和策略获取市场信息或相关数据。它包括提前检查和规划从过去获得的所有数据。它同样包括检查不同信息源中出现的信息不一致。使用市场统计和连贯模型分析和估计市场数据。此外,市场份额分析和关键趋势分析是市场报告中的主要成功因素。要了解更多信息,请请求分析师致电或下拉您的询问。
DBMR 研究团队使用的关键研究方法是数据三角测量,其中包括数据挖掘、数据变量对市场影响的分析和主要(行业专家)验证。数据模型包括供应商定位网格、市场时间线分析、市场概览和指南、公司定位网格、专利分析、定价分析、公司市场份额分析、测量标准、全球与区域和供应商份额分析。要了解有关研究方法的更多信息,请向我们的行业专家咨询。
可定制
Data Bridge Market Research 是高级形成性研究领域的领导者。我们为向现有和新客户提供符合其目标的数据和分析而感到自豪。报告可定制,包括目标品牌的价格趋势分析、了解其他国家的市场(索取国家列表)、临床试验结果数据、文献综述、翻新市场和产品基础分析。目标竞争对手的市场分析可以从基于技术的分析到市场组合策略进行分析。我们可以按照您所需的格式和数据样式添加您需要的任意数量的竞争对手数据。我们的分析师团队还可以为您提供原始 Excel 文件数据透视表(事实手册)中的数据,或者可以帮助您根据报告中的数据集创建演示文稿。


