

Global Graph Database Market
Размер рынка в млрд долларов США
CAGR :
% 
 USD
2.70 Billion
USD
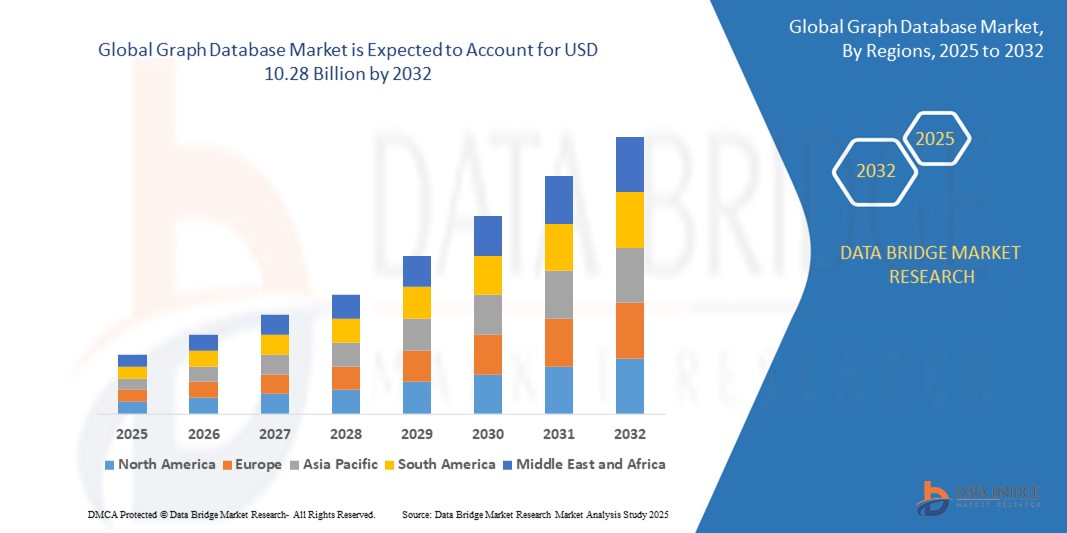
10.28 Billion
2024
2032
USD
2.70 Billion
USD
10.28 Billion
2024
2032
| 2025 –2032 | |
| USD 2.70 Billion | |
| USD 10.28 Billion | |
| % | |
|
Сегментация мирового рынка графовых баз данных по типу (Resource Description Framework (RDF) и Labeled Property Graph (LPG)), применению (обнаружение, предотвращение мошенничества и механизм рекомендаций), база данных (реляционная (SQL) и нереляционная (NoSQL)), модели развертывания (локальная и облачная), типу анализа (анализ пути, анализ связности, анализ сообщества и анализ центральности), размеру (крупные предприятия, малые и средние предприятия), компоненту (программное обеспечение и услуги), конечному пользователю (банковское дело, финансовые услуги и страхование, телекоммуникации и ИТ, здравоохранение и науки о жизни, транспорт и логистика, розничная торговля и электронная коммерция, энергетика и коммунальные услуги, государственный и общественный сектор, производство и другие) — отраслевые тенденции и прогноз до 2032 года
Размер рынка графовых баз данных
- Объем мирового рынка графовых баз данных оценивался в 2,70 млрд долларов США в 2024 году и, как ожидается, достигнет 10,28 млрд долларов США к 2032 году при среднегодовом темпе роста 18,20% в течение прогнозируемого периода .
- Рост рынка во многом обусловлен растущим внедрением графовых баз данных для аналитики данных в реальном времени, обнаружения мошенничества и создания рекомендательных систем в таких секторах, как бизнес-финансирование, телекоммуникации и электронная коммерция.
- Кроме того, растущая сложность корпоративных данных и растущий спрос на масштабируемые, высокопроизводительные решения, которые раскрывают скрытые взаимосвязи, позиционируют графовые базы данных как важнейший инструмент для современной инфраструктуры данных, тем самым значительно ускоряя расширение рынка.
Анализ рынка графовых баз данных
- Графовые базы данных, предназначенные для хранения, управления и запроса данных на основе взаимосвязей, становятся необходимыми для предприятий, стремящихся извлекать ценную информацию из тесно связанных и сложных наборов данных в различных приложениях, таких как обнаружение мошенничества, рекомендательные системы и сетевой анализ.
- Растущий спрос на графовые базы данных обусловлен, прежде всего, растущей потребностью в аналитике в реальном времени, растущим внедрением искусственного интеллекта и машинного обучения, а также растущим объемом неструктурированных и полуструктурированных данных, генерируемых в различных отраслях.
- Северная Америка доминировала на рынке графовых баз данных с долей 42,5% в 2024 году благодаря раннему внедрению инструментов передовой аналитики, значительным инвестициям в ИИ и машинное обучение, а также растущей потребности в обработке данных в режиме реального времени в таких отраслях, как бизнес-финансирование, здравоохранение и ИТ.
- Ожидается, что Азиатско-Тихоокеанский регион станет самым быстрорастущим регионом на рынке графовых баз данных в течение прогнозируемого периода благодаря росту цифровизации предприятий, поддерживаемым государством инициативам «умных городов» и быстрому внедрению облачных технологий в таких странах, как Китай, Индия, Япония и Южная Корея.
- Облачный сегмент доминировал на рынке в 2024 году благодаря растущему спросу на масштабируемые, экономичные и не требующие обслуживания варианты развертывания. Облачные графовые базы данных обеспечивают производительность по требованию, упрощённую интеграцию с другими облачными сервисами и глобальную доступность, что делает их идеальными для распределённых команд и разработки современных приложений.
Отчет о сфере применения и сегментации рынка графической базы данных
|
Атрибуты |
Ключевые рыночные данные Graph Database |
|
Охваченные сегменты |
|
|
Охваченные страны |
Северная Америка
Европа
Азиатско-Тихоокеанский регион
Ближний Восток и Африка
Южная Америка
|
|
Ключевые игроки рынка |
|
|
Рыночные возможности |
|
|
Информационные наборы данных с добавленной стоимостью |
Помимо таких рыночных данных, как рыночная стоимость, темпы роста, сегменты рынка, географический охват, участники рынка и рыночный сценарий, отчет о рынке, подготовленный командой Data Bridge Market Research, включает в себя углубленный экспертный анализ, анализ импорта/экспорта, анализ цен, анализ потребления продукции и анализ пестицидов. |
Тенденции рынка графовых баз данных
«Растущее внедрение облачных графовых баз данных»
- Значительной и быстрорастущей тенденцией на мировом рынке графовых баз данных является растущее внедрение облачных моделей развертывания, обеспечивающих повышенную масштабируемость, гибкость и совместную работу в режиме реального времени в распределенных средах данных.
- Например, Amazon Neptune, полностью управляемый сервис графовых баз данных на AWS, поддерживает модели RDF и Property Graph и широко используется для графов знаний и обнаружения мошенничества. Аналогичным образом, Azure Cosmos DB от Microsoft обеспечивает встроенную поддержку Gremlin API, что позволяет создавать масштабируемые решения для графовых баз данных в облаке.
- Облачные графовые базы данных позволяют организациям управлять огромными объемами связанных данных с минимальными затратами на инфраструктуру, обеспечивая более быстрое развертывание и простую интеграцию с существующими облачными сервисами. Интеграция Google Cloud с Neo4j AuraDB позволяет пользователям создавать расширенные аналитические и рекомендательные системы без необходимости управления внутренними системами.
- Эти платформы поддерживают такие варианты использования, как управление доступом к удостоверениям, анализ мошенничества в режиме реального времени и персонализированная доставка контента за счет использования моделирования данных, ориентированного на взаимоотношения, в экономически эффективной среде по требованию.
- Этот переход к облачным графовым решениям фундаментально меняет способы извлечения компаниями аналитической информации из сложных данных. Такие компании, как Neo4j и TigerGraph, активно расширяют свои облачные предложения, чтобы удовлетворить растущий спрос со стороны таких секторов, как бизнес-финансирование, телекоммуникации и розничная торговля.
- Спрос на облачные графовые базы данных стремительно растет, поскольку предприятия стремятся модернизировать инфраструктуру данных, сократить время получения информации и добиться бесшовной интеграции с рабочими процессами ИИ и машинного обучения.
Динамика рынка графовых баз данных
Водитель
«Растущая потребность в аналитике данных в реальном времени»
- Растущая потребность в аналитике данных в реальном времени в различных отраслях является важным фактором роста спроса на графовые базы данных.
- Например, в марте 2024 года компания Neo4j объявила о крупных обновлениях своей платформы для анализа графовых данных, расширяющих возможности выдачи рекомендаций в режиме реального времени и обнаружения мошенничества, которые быстро внедряются финтех-компаниями и платформами электронной коммерции. Ожидается, что подобные разработки ключевых игроков будут способствовать развитию рынка графовых баз данных в ближайшие годы.
- В условиях растущих объёмов высокосвязных данных предприятиям графовые базы данных позволяют мгновенно анализировать взаимосвязи и закономерности, с которыми традиционные базы данных не справляются эффективно. Это критически важно в таких случаях, как обнаружение мошеннических транзакций, выявление сбоев в цепочке поставок и поддержка систем персонализированного контента.
- Кроме того, растущий спрос на мгновенную аналитику в таких секторах, как банковское дело, телекоммуникации и розничная торговля, побуждает организации переходить от моделей пакетной обработки к решениям для аналитики в реальном времени, основанным на графовых технологиях.
- Облачные решения от таких компаний, как TigerGraph, Amazon Neptune и Microsoft Azure Cosmos DB, еще больше расширяют доступ к аналитике графов в реальном времени, позволяя предприятиям быстро и экономично развертывать эти возможности в различных операционных средах.
Сдержанность/Вызов
«Ограниченный опыт работы с рабочей силой»
- Недостаточный опыт работы с технологиями графовых баз данных представляет собой серьёзную проблему для более широкого внедрения и внедрения на рынке. Поскольку графовые базы данных требуют специальных знаний в области теории графов, языков запросов, таких как Cypher или Gremlin, и проектирования схем, многим организациям сложно найти квалифицированных специалистов, способных эффективно внедрять и администрировать эти системы.
- Например, несмотря на широкое распространение Neo4j, многие предприятия сталкиваются с серьёзными трудностями при обучении разработчиков, знакомых с его архитектурой и языком графовых запросов. Отсутствие опыта может привести к замедлению процесса развёртывания, неправильной настройке реализаций и неполному использованию возможностей графовой базы данных.
- Решение этой проблемы посредством целевых программ обучения, сертификационных курсов и удобных инструментов разработки критически важно для расширения рынка. Такие компании, как TigerGraph и Neo4j, запустили образовательные инициативы и платформы поддержки сообщества для формирования базы квалифицированных пользователей, однако нехватка квалифицированных специалистов по-прежнему остаётся узким местом для масштабирования передовых графовых решений.
- Кроме того, стремительный темп развития графических технологий может привести к перегрузке традиционных ИТ-отделов, что ещё больше увеличит дефицит специалистов. Эта проблема особенно актуальна для малых и средних предприятий, которым может не хватать ресурсов для инвестирования в специализированное обучение.
- Устранение нехватки талантов посредством стратегического партнерства, академического сотрудничества и упрощения инструментария будет иметь решающее значение для того, чтобы организации могли в полной мере использовать потенциал графовых баз данных для аналитики в реальном времени, обнаружения мошенничества и приложений на основе графов знаний.
Сфера применения графовых баз данных
Рынок сегментирован по типу, применению, базе данных, модели развертывания, типу анализа, размеру, компоненту и конечному пользователю.
• По типу
По типу рынок графовых баз данных сегментируется на Resource Description Framework (RDF) и Labeled Property Graph (LPG). Сегмент Labeled Property Graph (LPG) обеспечил наибольшую долю выручки на рынке в 2024 году благодаря своей гибкости в представлении сложных взаимосвязей с узлами, рёбрами и свойствами «ключ-значение». Интуитивно понятная структура моделирования данных LPG поддерживает такие сценарии использования, как графы знаний, рекомендательные системы и обнаружение мошенничества в режиме реального времени, обеспечивая высокую производительность, что делает её подходящей как для транзакционных, так и для аналитических задач.
Прогнозируется, что сегмент RDF будет демонстрировать самые высокие среднегодовые темпы роста в период с 2025 по 2032 год, чему будут способствовать его стандартизированная структура семантической паутины и высокая совместимость со связанными данными и онтологическими рассуждениями. RDF находит всё большее применение в государственном и академическом секторах для интеграции данных и соответствия стандартам W3C, особенно в проектах, требующих высокой степени взаимодействия между разнородными источниками данных.
• По применению
По сфере применения рынок графовых баз данных сегментируется на сегменты обнаружения и предотвращения мошенничества, а также на системы рекомендаций. Наибольшая доля выручки в 2024 году пришлась на сегмент обнаружения и предотвращения мошенничества благодаря его растущему внедрению в банковском секторе и электронной коммерции для выявления скрытых закономерностей и аномалий в режиме реального времени. Графовые базы данных отлично справляются с выявлением подозрительного поведения благодаря связной аналитике данных, предоставляя компаниям передовые инструменты для борьбы со всё более изощрёнными мошенническими схемами.
Ожидается, что сегмент рекомендательных систем будет демонстрировать самые высокие темпы роста в период с 2025 по 2032 год, что обусловлено спросом на гиперперсонализированный пользовательский опыт в таких секторах, как розничная торговля, стриминг и социальные платформы. Рекомендации на основе графов используют многомерные взаимосвязи для предоставления точного контента и предложений продуктов, значительно повышая вовлеченность и удовлетворенность клиентов.
• По базе данных
В зависимости от типа базы данных рынок графовых баз данных сегментируется на реляционные (SQL) и нереляционные (NoSQL). Сегмент нереляционных (NoSQL) баз данных занимал наибольшую долю рынка в 2024 году благодаря высокой масштабируемости, гибкости схем и способности обрабатывать неструктурированные и полуструктурированные данные. Графовые базы данных NoSQL поддерживают гибкую разработку приложений и аналитику в реальном времени, что обеспечивает их широкое применение в динамических средах, таких как социальные сети, кибербезопасность и управление знаниями.
Прогнозируется, что сегмент реляционных (SQL) сред будет расти самыми быстрыми темпами в период с 2025 по 2032 год, поскольку предприятия интегрируют возможности графов в традиционные среды SQL. Этот гибридный подход позволяет организациям использовать существующую реляционную инфраструктуру, одновременно получая расширенные функции запросов к связям, минимизируя перебои в работе и потребности в обучении.
• По модели развертывания
По модели развертывания рынок графовых баз данных сегментируется на локальные и облачные. Облачный сегмент обеспечил наибольшую долю выручки в 2024 году, что обусловлено растущим спросом на масштабируемые, экономичные и не требующие обслуживания варианты развертывания. Облачные графовые базы данных обеспечивают производительность по требованию, упрощённую интеграцию с другими облачными сервисами и глобальную доступность, что делает их идеальными для распределённых команд и разработки современных приложений.
Ожидается, что сегмент локальных решений будет демонстрировать самые быстрые темпы роста в период с 2025 по 2032 год, особенно среди предприятий в таких строго регулируемых секторах, как финансы, здравоохранение и оборона. Эти организации предпочитают локальные решения для более эффективного контроля данных, соблюдения строгих политик конфиденциальности и защиты от внешних угроз.
• По типу анализа
По типу анализа рынок графовых баз данных сегментируется на анализ путей, анализ связности, анализ сообществ и анализ центральности. Анализ путей занимал наибольшую долю рынка в 2024 году благодаря своей важнейшей роли в оптимизации логистики, выявлении цепочек мошенничества и картировании клиентских маршрутов. Он позволяет компаниям понимать последовательности, зависимости и причинно-следственные связи в транзакционных и операционных данных.
Ожидается, что анализ сообществ будет демонстрировать самые высокие среднегодовые темпы роста в период с 2025 по 2032 год благодаря его применению в маркетинге, анализе социальных сетей и кибербезопасности. Он помогает выявлять кластеры, группы влияния и модели поведения, позволяя проводить более целенаправленные вмешательства и глубже понимать динамику экосистем.
• По размеру
В зависимости от размера организации рынок сегментируется на крупные предприятия и малые и средние предприятия (МСП). Крупные предприятия обеспечили наибольшую долю выручки в 2024 году, что обусловлено их обширной потребностью в управлении большими и сложными наборами данных в разных департаментах и регионах. Эти организации используют графовые базы данных для построения графов корпоративных знаний, анализа мошенничества и оптимизации цепочек поставок.
Ожидается, что сегмент малого и среднего бизнеса будет расти самыми быстрыми темпами в период с 2025 по 2032 год благодаря активизации инициатив цифровой трансформации и расширению доступа к облачным графическим решениям. Малые и средние предприятия получают выгоду от улучшенного понимания клиентов и оптимизированного процесса принятия решений без значительных инвестиций в традиционную инфраструктуру.
• По компонентам
По компонентному составу рынок графовых баз данных сегментируется на два сегмента: программное обеспечение и услуги. Сегмент программного обеспечения занимал наибольшую долю рынка в 2024 году благодаря растущему внедрению графовых движков и платформ управления базами данных для запросов, визуализации и интеграции данных. Постоянные инновации продуктов и растущая доступность ПО с открытым исходным кодом дополнительно укрепляют этот сегмент.
Прогнозируется, что сегмент услуг будет расти самыми высокими среднегодовыми темпами в период с 2025 по 2032 год, чему будет способствовать растущий спрос на услуги консалтинга, обучения, интеграции и поддержки. По мере того, как всё больше организаций осваивают графовые технологии, услуги экспертов становятся критически важными для обеспечения плавного внедрения, оптимизации производительности и стратегического соответствия бизнес-целям.
• Конечным пользователем
По типу конечного пользователя рынок графовых баз данных сегментируется следующим образом: банковское дело, финансовые услуги и страхование (BFSI), телекоммуникации и ИТ, здравоохранение и науки о жизни, транспорт и логистика, розничная торговля и электронная коммерция, энергетика и коммунальные услуги, государственный и общественный сектор, производство и другие. Сегмент BFSI занимал наибольшую долю рынка в 2024 году, что обусловлено потребностью в надежном обнаружении мошенничества, управлении рисками и соблюдении нормативных требований. Графовые базы данных предоставляют участникам BFSI возможность отображать сложные транзакционные взаимосвязи и отслеживать сети финансовых преступлений.
Ожидается, что сектор здравоохранения и наук о жизни будет демонстрировать самые высокие среднегодовые темпы роста в период с 2025 по 2032 год благодаря развитию приложений в области геномики, разработки лекарственных препаратов и интеграции данных пациентов. Графовые технологии позволяют исследователям и врачам анализировать биологические сети и медицинские записи в связанном контексте, ускоряя инновации и персонализированную медицинскую помощь.
Региональный анализ рынка графовых баз данных
- Северная Америка доминировала на рынке графовых баз данных с наибольшей долей выручки в 42,5% в 2024 году, что обусловлено ранним внедрением инструментов расширенной аналитики, значительными инвестициями в ИИ и машинное обучение, а также растущей потребностью в обработке данных в режиме реального времени в таких отраслях, как бизнес-финансирование, здравоохранение и ИТ.
- Организации в регионе используют графовые базы данных для обнаружения мошенничества, создания рекомендательных систем и комплексного сетевого анализа структурированных и неструктурированных наборов данных.
- Расширение рынка поддерживается присутствием ведущих поставщиков, растущим внедрением облачных технологий и корпоративным спросом на масштабируемые, высокопроизводительные решения для управления данными.
Обзор рынка графических баз данных США
Рынок графовых баз данных США занял наибольшую долю выручки в Северной Америке в 2024 году благодаря повсеместной цифровизации предприятий и интеграции графовой аналитики в платформы данных. Развитая облачная инфраструктура страны и ориентированная на данные нормативно-правовая база стимулируют их внедрение в сфере финансов, здравоохранения и розничной торговли. Американские компании всё чаще используют графовые базы данных для улучшения качества обслуживания клиентов, обеспечения кибербезопасности и анализа взаимоотношений, опираясь на мощную экосистему поставщиков решений и облачных платформ.
Обзор рынка базы данных Europe Graph
Ожидается, что рынок графовых баз данных в Европе будет расти высокими среднегодовыми темпами в течение всего прогнозируемого периода, в первую очередь благодаря строгим стандартам управления данными, таким как GDPR, и растущему вниманию к происхождению данных, прозрачности и совместимости в регионе. Растущий спрос на аналитику на основе ИИ в телекоммуникациях, банковских и финансовых услугах (BFSI) и государственных услугах стимулирует рост. Компании внедряют графовые технологии для повышения эффективности обнаружения мошенничества, улучшения прозрачности цепочек поставок и внедрения стратегий персонализации в цифровых каналах.
Обзор рынка графических баз данных Великобритании
Ожидается, что рынок графовых баз данных в Великобритании будет расти высокими среднегодовыми темпами в течение прогнозируемого периода, чему будет способствовать рост инвестиций в цифровую трансформацию и растущая значимость сетевой аналитики в государственном и финансовом секторах. Расширение финтех-ландшафта Великобритании и акцент на кибербезопасность стимулируют спрос на решения для обнаружения мошенничества и построения карт поведения клиентов на основе графов. Их внедрение также растёт в исследовательских институтах и компаниях, специализирующихся на построении семантических графов знаний.
Анализ рынка графической базы данных Германии
Рынок графовых баз данных в Германии будет стабильно расти в течение прогнозируемого периода, чему будет способствовать акцент страны на Индустрию 4.0, автоматизацию данных и интеллектуальное принятие решений. Немецкие предприятия используют графовые базы данных для оптимизации производственных сетей, предиктивного обслуживания и ИТ-операций. Интеграция графовой аналитики в устаревшие системы и ERP-платформы набирает обороты, особенно в автомобильной, производственной и государственной сферах.
Обзор рынка графических баз данных в Азиатско-Тихоокеанском регионе
Рынок графовых баз данных в Азиатско-Тихоокеанском регионе, как ожидается, будет расти самыми быстрыми темпами в год в период с 2025 по 2032 год, чему будут способствовать растущая цифровизация предприятий, поддерживаемые государством инициативы по развитию умных городов и быстрое внедрение облачных технологий в таких странах, как Китай, Индия, Япония и Южная Корея. Организации обращаются к графовым базам данных для обнаружения мошенничества, персонализации услуг и комплексной интеграции данных в распределенных средах.
Обзор рынка Japan Graph Database
Рынок графовых баз данных в Японии стабильно растёт благодаря мощной технологической инфраструктуре страны и растущему спросу на решения для обработки данных на основе искусственного интеллекта. Предприятия и государственные учреждения используют графовые базы данных для улучшения семантического поиска, оптимизации логистики и выявления закономерностей в киберугрозах. Развитию рынка также способствует интеграция графовой аналитики в системы Интернета вещей и интеллектуального производства, соответствующие целям японской программы «Общество 5.0».
Обзор рынка баз данных China Graph
Рынок графовых баз данных Китая занимал самую большую долю выручки в Азиатско-Тихоокеанском регионе в 2024 году благодаря усилиям правительства по внедрению инноваций в сфере данных и высокому спросу со стороны технологического, финансового и логистического секторов. Быстрорастущая цифровая экосистема Китая использует графовые базы данных для поддержки рекомендательных систем, выявления мошенничества и анализа цепочек поставок. Отечественные поставщики активно внедряют инновации в сфере графовых баз данных, опираясь на обширный кадровый потенциал и благоприятную политическую среду.
Доля рынка графовых баз данных
Лидерами отрасли графовых баз данных являются, в первую очередь, хорошо зарекомендовавшие себя компании, в том числе:
- Hewlett Packard Enterprise Development LP (США)
- IBM (США)
- Microsoft (США)
- Сименс (Германия)
- ANSYS, Inc. (США)
- SAP SE (Германия)
- Oracle (США)
- Robert Bosch GmbH (Германия)
- Atos SE (Франция)
- АББ (Швейцария)
- Келлтон (Индия)
- AVEVA Group Limited (Великобритания)
- DXC Technology Company (США)
- Altair Engineering, Inc. (США)
- Hexaware Technologies Limited. (Индия)
- Tata Consultancy Services Limited (Индия)
- Infosys Limited (Индия)
- NTT DATA Group Corporation (Япония)
- Cloud Software Group, Inc. (США)
- Redis Ltd (США)
Последние разработки на мировом рынке графовых баз данных
- В мае 2023 года AWS заключила партнерское соглашение с Neo4j, ключевым игроком в определении ландшафта графовых баз данных и установлении стандартов открытого исходного кода. Будучи продавцом на AWS Marketplace, Neo4j зарекомендовала себя как лидер в области графовых баз данных. Кроме того, компания получила сертификат AWS Data and Analytics Competency, подтверждающий её опыт в предоставлении передовых решений для работы с данными на платформе AWS.
- В мае 2023 года SAP и Google Cloud объявили о расширенном партнерстве, включающем запуск комплексного решения для работы с открытыми данными, направленного на оптимизацию ландшафтов данных и максимальное раскрытие потенциала бизнес-данных. Эта новая инициатива объединяет технологии SAP и Google Cloud в области обработки данных и аналитики для повышения доступности и полезности корпоративных данных. Кроме того, она направлена на стимулирование развития корпоративного искусственного интеллекта, способствуя более широкому внедрению инноваций и получению более ценной информации для бизнеса.
- В апреле 2023 года компания Neo4j заключила партнерское соглашение с Imperium Solutions, чтобы удовлетворить растущий спрос на графовые технологии в Сингапуре. Благодаря этому сотрудничеству Imperium Solutions поможет клиентам раскрыть весь потенциал Neo4j, ведущего поставщика графовых баз данных, известного решением сложных задач корпоративного уровня. Целью этого партнерства является повышение эффективности выявления взаимосвязей и закономерностей в обширных наборах данных, что принесет большую пользу компаниям в регионе.
- В феврале 2023 года IBM объявила о приобретении StepZen Inc., разработчика сервера GraphQL с инновационной архитектурой, которая позволяет разработчикам быстро и с минимальным написанием кода создавать API GraphQL. StepZen отличается высокой гибкостью и легко интегрируется с различными подходами к API. Кроме того, он предлагается в формате SaaS (программное обеспечение как услуга) и поддерживает развёртывания в частных облаках и локальных центрах обработки данных, удовлетворяя разнообразные бизнес-потребности.
- В декабре 2022 года LSEG и Microsoft заключили 10-летнее стратегическое партнерство, направленное на разработку решений для обработки данных и аналитики нового поколения, а также на совершенствование облачной инфраструктуры. В рамках этого сотрудничества Microsoft инвестирует в акционерный капитал LSEG путем приобретения акций. Партнерство будет использовать Microsoft Azure, искусственный интеллект и Microsoft Teams для проектирования инфраструктуры данных LSEG и создания инновационных решений для повышения производительности, аналитики данных и моделирования для пользователей.
SKU-
Get online access to the report on the World's First Market Intelligence Cloud

- Интерактивная панель анализа данных
- Панель анализа компании для возможностей с высоким потенциалом роста
- Доступ аналитика-исследователя для настройки и запросов
- Анализ конкурентов с помощью интерактивной панели
- Последние новости, обновления и анализ тенденций
- Используйте возможности сравнительного анализа для комплексного отслеживания конкурентов
Содержание
1 INTRODUCTION
1.1 OBJECTIVES OF THE STUDY
1.2 MARKET DEFINITION
1.3 OVERVIEW OF GLOBAL GRAPH DATABASE MARKET
1.4 CURRENCY AND PRICING
1.5 LIMITATION
1.6 MARKETS COVERED
2 MARKET SEGMENTATION
2.1 KEY TAKEAWAYS
2.2 ARRIVING AT THE GLOBAL GRAPH DATABASE MARKET
2.2.1 VENDOR POSITIONING GRID
2.2.2 TECHNOLOGY LIFE LINE CURVE
2.2.3 MARKET GUIDE
2.2.4 MULTIVARIATE MODELLING
2.2.5 TOP TO BOTTOM ANALYSIS
2.2.6 STANDARDS OF MEASUREMENT
2.2.7 VENDOR SHARE ANALYSIS
2.2.8 DATA POINTS FROM KEY PRIMARY INTERVIEWS
2.2.9 DATA POINTS FROM KEY SECONDARY DATABASES
2.3 GLOBAL GRAPH DATABASE MARKET: RESEARCH SNAPSHOT
2.4 ASSUMPTIONS
3 MARKET OVERVIEW
3.1 DRIVERS
3.2 RESTRAINTS
3.3 OPPORTUNITIES
3.4 CHALLENGES
4 EXECUTIVE SUMMARY
5 PREMIUM INSIGHTS
5.1 PORTER’S FIVE FORCES ANALYSIS
5.2 REGULATORY STANDARDS
5.3 INDUSTRY ANALYSIS & FUTURISTIC SCENARIO
5.4 PENETRATION AND GROWTH POSPECT MAPPING
5.5 NEW BUSINESS AND EMERGING BUSINESS'S REVENUE OPPORTUNITIES
5.6 TECHNOLOGY ANALYSIS
5.6.1 KEY TECHNOLOGIES
5.6.2 COMPLEMENTARY TECHNOLOGIES
5.6.3 ADJACENT TECHNOLOGIES
FIGURE 1 TECHNOLOGY MATRIX
Company Product/Service offered
5.7 COMPANY COMPETITIVE ANALYSIS
5.7.1 STRATEGIC DEVELOPMENT
5.7.2 TECHNOLOGY IMPLEMENTATION PROCESS
5.7.2.1. CHALLENGES
5.7.2.2. INHOUSE IMPLEMENTATION/OUTSOURCED (THIRD PARTY) IMPLEMENTATION
5.7.3 CUSTOMER BASE
5.7.4 SERVICE POSITIONING
5.7.5 CUSTOMER FEEDBACK/RATING (B2B OR B2C)
5.7.6 APPLICATION REACH
5.7.7 SERVICE PLATFORM MATRIX
FIGURE 2 COMPANY COMPARATIVE ANALYSIS
Parameters Company A
Market Share
Growth (%)
Target Audience
Price Structure
Market Strategies
Customer Feedback
Service Positioning
Customer Feedback/Rating
Strategic Development
Application Reach
6 COMPANY SERVICE PLATFORM MATRIX
6.1 USED CASES & ITS ANALYSIS
7 FIG 4. USED CASE ANALYSIS
Company Product/Service offered
8 GLOBAL GRAPH DATABASE MARKET, BY MODEL TYPE
8.1 OVERVIEW
8.2 RESOURCE DESCRIPTION FRAMEWORK (RDF)
8.3 LABELED PROPERTY GRAPH (LPG)
8.4 HYPERGRAPHS
8.5 OTHERS
9 GLOBAL GRAPH DATABASE MARKET, BY SET OF OBJECTS
9.1 OVERVIEW
9.2 NODES
9.3 EDGES
9.4 OTHERS
10 GLOBAL GRAPH DATABASE MARKET, BY OFFERING
10.1 OVERVIEW
10.2 SOLUTION
10.2.1 BY DEPLOYMENT TYPE
10.2.1.1. ON-PREMISE
10.2.1.2. CLOUD
10.3 SERVICES
10.3.1 PROFESSIONAL SERVICES
10.3.2 MANAGED SERVICES
11 GLOBAL GRAPH DATABASE MARKET, BY ANALYSIS TYPE
11.1 OVERVIEW
11.2 PATH ANALYSIS
11.3 CONNECTIVITY ANALYSIS
11.4 COMMUNITY ANALYSIS
11.5 CENTRALITY ANALYSIS
12 GLOBAL GRAPH DATABASE MARKET, BY APPLICATION
12.1 OVERVIEW
12.2 FRAUD DETECTION
12.3 REAL-TIME RECOMMENDATION ENGINES
12.4 MASTER DATA MANAGEMENT (MDM)
12.5 NETWORK AND IT OPERATIONS
12.6 IDENTITY AND ACCESS MANAGEMENT (IAM)
13 GLOBAL GRAPH DATABASE MARKET, BY ORGANISATION TYPE
13.1 OVERVIEW
13.2 LARGE ENTERPRISES
13.3 SMALL & MEDIUM ENTERPRISES
14 GLOBAL GRAPH DATABASE MARKET, BY DEPLOYMENT MODE
14.1 OVERVIEW
14.2 ON-PREMISE
14.3 CLOUD
15 GLOBAL GRAPH DATABASE MARKET, BY END USER
15.1 OVERVIEW
15.2 MANUFACTURING & AUTOMOTIVE
15.2.1 BY OFFERING
15.2.1.1. SOLUTION
15.2.1.1.1. BY DEPLOYMENT TYPE
15.2.1.1.1.1 ON-PREMISE
15.2.1.1.1.2 CLOUD
15.2.1.1.1.3 SERVICES
15.2.1.1.1.4 PROFESSIONAL SERVICES
15.2.1.1.1.5 MANAGED SERVICES
15.3 RETAIL AND E-COMMERCE
15.3.1 SOLUTION
15.3.1.1. BY DEPLOYMENT TYPE
15.3.1.1.1. ON-PREMISE
15.3.1.1.2. CLOUD
15.3.1.2. SERVICES
15.3.1.2.1. PROFESSIONAL SERVICES
15.3.1.2.2. MANAGED SERVICES
15.4 HEALTHCARE AND PHARMACEUTICALS
15.4.1 SOLUTION
15.4.1.1. BY DEPLOYMENT TYPE
15.4.1.1.1. ON-PREMISE
15.4.1.1.2. CLOUD
15.4.1.2. SERVICES
15.4.1.2.1. PROFESSIONAL SERVICES
15.4.1.2.2. MANAGED SERVICES
15.5 BANKING, FINANCIAL SERVICES & INSURANCE
15.5.1 SOLUTION
15.5.1.1. BY DEPLOYMENT TYPE
15.5.1.1.1. ON-PREMISE
15.5.1.1.2. CLOUD
15.5.1.2. SERVICES
15.5.1.2.1. PROFESSIONAL SERVICES
15.5.1.2.2. MANAGED SERVICES
15.6 ENERGY & UTILITIES
15.6.1 SOLUTION
15.6.1.1. BY DEPLOYMENT TYPE
15.6.1.1.1. ON-PREMISE
15.6.1.1.2. CLOUD
15.6.1.2. SERVICES
15.6.1.2.1. PROFESSIONAL SERVICES
15.6.1.2.2. MANAGED SERVICES
15.7 GOVERNMENT & PUBLIC
15.7.1 SOLUTION
15.7.1.1. BY DEPLOYMENT TYPE
15.7.1.1.1. ON-PREMISE
15.7.1.1.2. CLOUD
15.7.1.2. SERVICES
15.7.1.2.1. PROFESSIONAL SERVICES
15.7.1.2.2. MANAGED SERVICES
15.8 TELECOM & IT
15.8.1 SOLUTION
15.8.1.1. BY DEPLOYMENT TYPE
15.8.1.1.1. ON-PREMISE
15.8.1.1.2. CLOUD
15.8.1.2. SERVICES
15.8.1.2.1. PROFESSIONAL SERVICES
15.8.1.2.2. MANAGED SERVICES
15.9 TRANSPORTATION & LOGISTICS
15.9.1 SOLUTION
15.9.1.1. BY DEPLOYMENT TYPE
15.9.1.1.1. ON-PREMISE
15.9.1.1.2. CLOUD
15.9.1.2. SERVICES
15.9.1.2.1. PROFESSIONAL SERVICES
15.9.1.2.2. MANAGED SERVICES
15.1 OTHERS
16 GLOBAL GRAPH DATABASE MARKET, BY REGION
16.1 GLOBAL GRAPH DATABASE MARKET, (ALL SEGMENTATION PROVIDED ABOVE IS REPRESENTED IN THIS CHAPTER BY COUNTRY)
16.1.1 NORTH AMERICA
16.1.1.1. U.S.
16.1.1.2. CANADA
16.1.1.3. MEXICO
16.1.2 EUROPE
16.1.2.1. GERMANY
16.1.2.2. FRANCE
16.1.2.3. U.K.
16.1.2.4. ITALY
16.1.2.5. SPAIN
16.1.2.6. RUSSIA
16.1.2.7. TURKEY
16.1.2.8. BELGIUM
16.1.2.9. NETHERLANDS
16.1.2.10. SWITZERLAND
16.1.2.11. SWEDEN
16.1.2.12. DENMARK
16.1.2.13. POLAND
16.1.2.14. REST OF EUROPE
16.1.3 ASIA PACIFIC
16.1.3.1. JAPAN
16.1.3.2. CHINA
16.1.3.3. SOUTH KOREA
16.1.3.4. INDIA
16.1.3.5. AUSTRALIA AND NEW ZEALAND
16.1.3.6. SINGAPORE
16.1.3.7. THAILAND
16.1.3.8. MALAYSIA
16.1.3.9. INDONESIA
16.1.3.10. PHILIPPINES
16.1.3.11. TAIWAN
16.1.3.12. VIETNAM
16.1.3.13. REST OF ASIA PACIFIC
16.1.4 SOUTH AMERICA
16.1.4.1. BRAZIL
16.1.4.2. ARGENTINA
16.1.4.3. REST OF SOUTH AMERICA
16.1.5 MIDDLE EAST AND AFRICA
16.1.5.1. SOUTH AFRICA
16.1.5.2. EGYPT
16.1.5.3. SAUDI ARABIA
16.1.5.4. U.A.E
16.1.5.5. ISRAEL
16.1.5.6. KUWAIT
16.1.5.7. QATAR
16.1.5.8. REST OF MIDDLE EAST AND AFRICA
16.2 KEY PRIMARY INSIGHTS: BY MAJOR COUNTRIES
17 GLOBAL GRAPH DATABASE MARKET, COMPANY LANDSCAPE
17.1 COMPANY SHARE ANALYSIS: GLOBAL
17.2 COMPANY SHARE ANALYSIS: NORTH AMERICA
17.3 COMPANY SHARE ANALYSIS: EUROPE
17.4 COMPANY SHARE ANALYSIS: ASIA-PACIFIC
17.5 MERGERS & ACQUISITIONS
17.6 NEW PRODUCT DEVELOPMENT & APPROVALS
17.7 EXPANSIONS
17.8 REGULATORY CHANGES
17.9 PARTNERSHIP AND OTHER STRATEGIC DEVELOPMENTS
18 GLOBAL GRAPH DATABASE MARKET, SWOT ANALYSIS
19 GLOBAL GRAPH DATABASE MARKET, COMPANY PROFILE
19.1 MICROSOFT CORPORATION
19.1.1 COMPANY SNAPSHOT
19.1.2 REVENUE ANALYSIS
19.1.3 PRODUCT PORTFOLIO
19.1.4 RECENT DEVELOPMENTS
19.2 IBM CORPORATION
19.2.1 COMPANY SNAPSHOT
19.2.2 REVENUE ANALYSIS
19.2.3 PRODUCT PORTFOLIO
19.2.4 RECENT DEVELOPMENTS
19.3 NEO4J INC.
19.3.1 COMPANY SNAPSHOT
19.3.2 REVENUE ANALYSIS
19.3.3 PRODUCT PORTFOLIO
19.3.4 RECENT DEVELOPMENTS
19.4 ORACLE CORPORATION
19.4.1 COMPANY SNAPSHOT
19.4.2 REVENUE ANALYSIS
19.4.3 PRODUCT PORTFOLIO
19.4.4 RECENT DEVELOPMENTS
19.5 DATASTAX INC.
19.5.1 COMPANY SNAPSHOT
19.5.2 REVENUE ANALYSIS
19.5.3 PRODUCT PORTFOLIO
19.5.4 RECENT DEVELOPMENTS
19.6 ARANGOGRAPH DB
19.6.1 COMPANY SNAPSHOT
19.6.2 REVENUE ANALYSIS
19.6.3 PRODUCT PORTFOLIO
19.6.4 RECENT DEVELOPMENTS
19.7 TIGERGRAPH
19.7.1 COMPANY SNAPSHOT
19.7.2 REVENUE ANALYSIS
19.7.3 PRODUCT PORTFOLIO
19.7.4 RECENT DEVELOPMENTS
19.8 AMAZON WEB SERVICES INC.
19.8.1 COMPANY SNAPSHOT
19.8.2 REVENUE ANALYSIS
19.8.3 PRODUCT PORTFOLIO
19.8.4 RECENT DEVELOPMENTS
19.9 ONTOTEXT INC.
19.9.1 COMPANY SNAPSHOT
19.9.2 REVENUE ANALYSIS
19.9.3 PRODUCT PORTFOLIO
19.9.4 RECENT DEVELOPMENTS
19.1 STARDOG UNION
19.10.1 COMPANY SNAPSHOT
19.10.2 REVENUE ANALYSIS
19.10.3 PRODUCT PORTFOLIO
19.10.4 RECENT DEVELOPMENTS
19.11 SAP SE
19.11.1 COMPANY SNAPSHOT
19.11.2 REVENUE ANALYSIS
19.11.3 PRODUCT PORTFOLIO
19.11.4 RECENT DEVELOPMENTS
19.12 MARKLOGIC CORPORATION
19.12.1 COMPANY SNAPSHOT
19.12.2 REVENUE ANALYSIS
19.12.3 PRODUCT PORTFOLIO
19.12.4 RECENT DEVELOPMENTS
19.13 TIBCO SOFTWARE INC. (CLOUD SOFTWARE GROUP)
19.13.1 COMPANY SNAPSHOT
19.13.2 REVENUE ANALYSIS
19.13.3 PRODUCT PORTFOLIO
19.13.4 RECENT DEVELOPMENTS
19.14 FRANZ INC.
19.14.1 COMPANY SNAPSHOT
19.14.2 REVENUE ANALYSIS
19.14.3 PRODUCT PORTFOLIO
19.14.4 RECENT DEVELOPMENTS
19.15 OPENLINK SOFTWARE
19.15.1 COMPANY SNAPSHOT
19.15.2 REVENUE ANALYSIS
19.15.3 PRODUCT PORTFOLIO
19.15.4 RECENT DEVELOPMENTS
19.16 BITNINE CO. LTD.
19.16.1 COMPANY SNAPSHOT
19.16.2 REVENUE ANALYSIS
19.16.3 PRODUCT PORTFOLIO
19.16.4 RECENT DEVELOPMENTS
19.17 FLUREE
19.17.1 COMPANY SNAPSHOT
19.17.2 REVENUE ANALYSIS
19.17.3 PRODUCT PORTFOLIO
19.17.4 RECENT DEVELOPMENTS
19.18 DGRAPH
19.18.1 COMPANY SNAPSHOT
19.18.2 REVENUE ANALYSIS
19.18.3 PRODUCT PORTFOLIO
19.18.4 RECENT DEVELOPMENTS
19.19 REDIS LABS
19.19.1 COMPANY SNAPSHOT
19.19.2 REVENUE ANALYSIS
19.19.3 PRODUCT PORTFOLIO
19.19.4 RECENT DEVELOPMENTS
19.2 ALTAIR ENGINEERING INC.
19.20.1 COMPANY SNAPSHOT
19.20.2 REVENUE ANALYSIS
19.20.3 PRODUCT PORTFOLIO
19.20.4 RECENT DEVELOPMENTS
NOTE: THE COMPANIES PROFILED IS NOT EXHAUSTIVE LIST AND IS AS PER OUR PREVIOUS CLIENT REQUIREMENT. WE PROFILE MORE THAN 100 COMPANIES IN OUR STUDY AND HENCE THE LIST OF COMPANIES CAN BE MODIFIED OR REPLACED ON REQUEST
20 RELATED REPORTS
21 QUESTIONNAIRE
22 ABOUT DATA BRIDGE MARKET RESEARCH
Методология исследования
Сбор данных и анализ базового года выполняются с использованием модулей сбора данных с большими размерами выборки. Этап включает получение рыночной информации или связанных данных из различных источников и стратегий. Он включает изучение и планирование всех данных, полученных из прошлого заранее. Он также охватывает изучение несоответствий информации, наблюдаемых в различных источниках информации. Рыночные данные анализируются и оцениваются с использованием статистических и последовательных моделей рынка. Кроме того, анализ доли рынка и анализ ключевых тенденций являются основными факторами успеха в отчете о рынке. Чтобы узнать больше, пожалуйста, запросите звонок аналитика или оставьте свой запрос.
Ключевой методологией исследования, используемой исследовательской группой DBMR, является триангуляция данных, которая включает в себя интеллектуальный анализ данных, анализ влияния переменных данных на рынок и первичную (отраслевую экспертную) проверку. Модели данных включают сетку позиционирования поставщиков, анализ временной линии рынка, обзор рынка и руководство, сетку позиционирования компании, патентный анализ, анализ цен, анализ доли рынка компании, стандарты измерения, глобальный и региональный анализ и анализ доли поставщика. Чтобы узнать больше о методологии исследования, отправьте запрос, чтобы поговорить с нашими отраслевыми экспертами.
Доступна настройка
Data Bridge Market Research является лидером в области передовых формативных исследований. Мы гордимся тем, что предоставляем нашим существующим и новым клиентам данные и анализ, которые соответствуют и подходят их целям. Отчет можно настроить, включив в него анализ ценовых тенденций целевых брендов, понимание рынка для дополнительных стран (запросите список стран), данные о результатах клинических испытаний, обзор литературы, обновленный анализ рынка и продуктовой базы. Анализ рынка целевых конкурентов можно проанализировать от анализа на основе технологий до стратегий портфеля рынка. Мы можем добавить столько конкурентов, о которых вам нужны данные в нужном вам формате и стиле данных. Наша команда аналитиков также может предоставить вам данные в сырых файлах Excel, сводных таблицах (книга фактов) или помочь вам в создании презентаций из наборов данных, доступных в отчете.

