Рынок обнаружения утечек в Европе по типу (вверх по течению, в середине и вниз по течению), тип продукта (ручные газоанализаторы, детекторы на базе БПЛА, пилотируемые летательные аппараты и детекторы на базе транспортных средств), технология (акустика/ультразвук, методы отклонения давления-потока, расширенная модель переходных процессов в реальном времени (E-RTTM), тепловидение , баланс массы/объема, зондирование паров, лазерное поглощение и лидар, обнаружение утечек в гидравлической системе, клапаны отрицательного давления и другие), конечный пользователь (нефть и газ, химический завод, водоочистные сооружения, теплоэлектростанции, горнодобывающая промышленность и шламовые заводы и другие), страна (Германия, Франция, Великобритания, Италия, Испания, Россия, Турция, Бельгия, Нидерланды, Швейцария, остальная Европа) Отраслевые тенденции и прогноз до 2028 года
Анализ рынка и аналитика : рынок обнаружения утечек в Европе
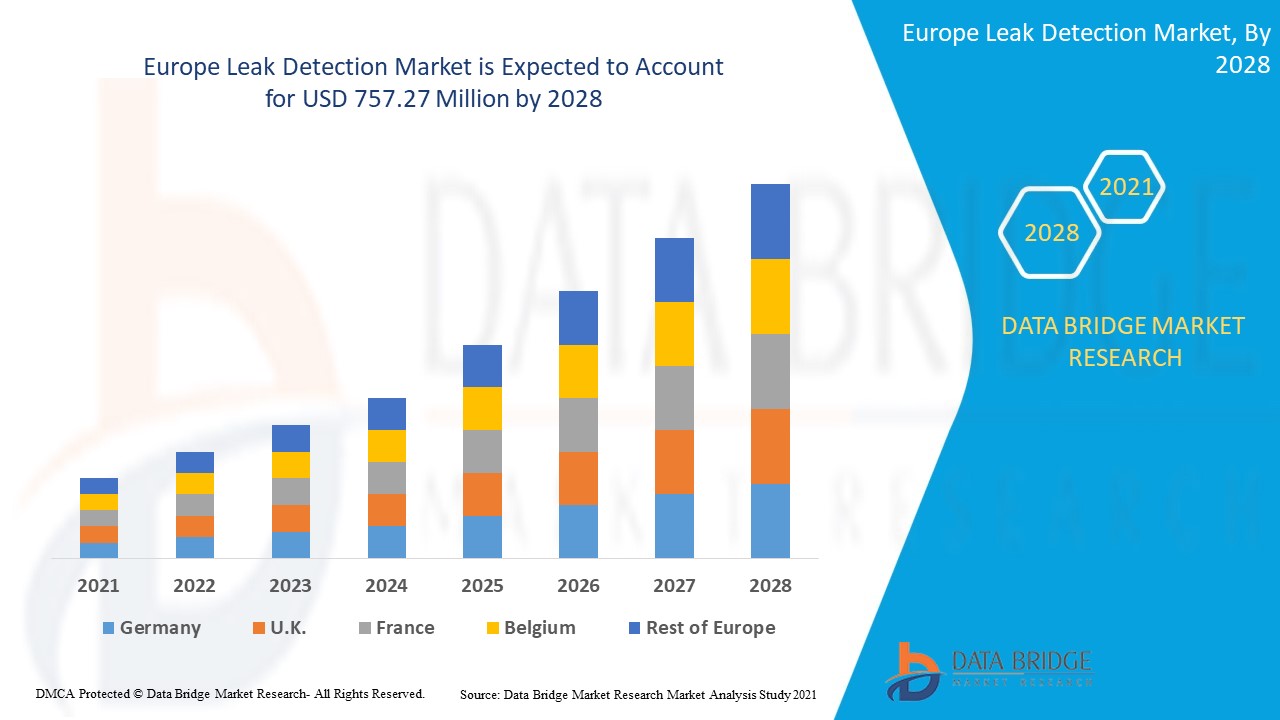
Ожидается, что рынок обнаружения утечек в Европе будет расти в прогнозируемый период с 2021 по 2028 год. По данным Data Bridge Market Research, среднегодовой темп роста рынка составит 7,4% в прогнозируемый период с 2021 по 2028 год, а к 2028 году он, как ожидается, достигнет 757,27 млн долларов США. Основными факторами, способствующими росту рынка, являются рост инфраструктуры нефте- и газопроводов и хранилищ.
Термин «утечка» или «протечка» означает непреднамеренную трещину, отверстие или пористость в ограждающей стенке или стыке труб, батарей, герметичных изделий, камер или контейнеров для хранения, которые должны содержать/передавать различные жидкости и газы. Эти трещины или отверстия позволяют жидкостям и газам выходить из закрытой среды. Утечки должны быть обнаружены как можно скорее, чтобы уменьшить потери и вред, причиняемый окружающей среде, для чего используются различные датчики и приборы обнаружения утечек. Основной функцией системы обнаружения утечек является локализация и измерение размера утечек в герметичных изделиях.
Большое количество инцидентов с утечками в трубопроводах и растущая интеграция передовых технологий в детекторы утечек расширяют рынок обнаружения утечек. Например, в январе 2020 года компания FLIR Systems Inc. выпустила FLIR GF77a, свою первую неохлаждаемую, стационарную, подключенную тепловизионную камеру для обнаружения метана и других промышленных газов. С этим новым запуском серии продуктов оптической газовой визуализации (OGI) компания расширила свой ассортимент продукции и увеличит свою клиентскую базу.
В этом отчете о рынке обнаружения утечек содержатся сведения о доле рынка, новых разработках и анализе продуктового портфеля, влиянии внутренних и локальных игроков рынка, анализируются возможности с точки зрения новых источников дохода, изменений в рыночных правилах, одобрений продуктов, стратегических решений, запусков продуктов, географических расширений и технологических инноваций на рынке. Чтобы понять анализ и рыночный сценарий, свяжитесь с нами для получения аналитического обзора, наша команда поможет вам создать решение по влиянию на доход для достижения желаемой цели.
Объем и размер рынка обнаружения утечек в Европе
Leak detection market is segmented on the basis of type, product type, technology and end user. The growth among segments helps you analyse niche pockets of growth and strategies to approach the market and determine your core application areas and the difference in your target markets.
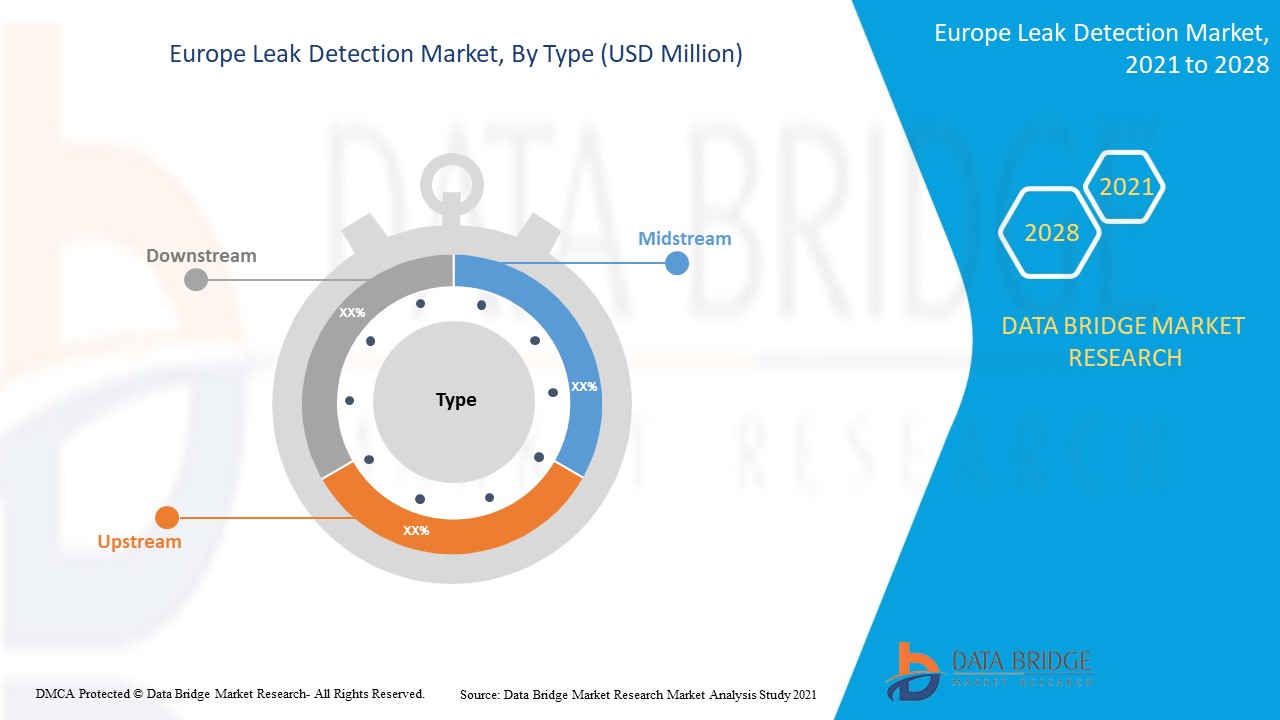
- On the basis of type, the leak detection market is segmented into upstream, midstream and downstream. In 2021, the midstream segment accounted largest market share as midstream segment basically deals with the transportation of crude oil and natural gas through various modes of transportation such as pipeline. These pipelines are needed to be protected against leakages to avoid leak incidents and cause loss of life and property. Thus, the midstream is dominating the type segment.
- On the basis of product type, the leak detection market is segmented into handheld gas detectors, UAV-based detectors, manned aircraft detectors and vehicle-based detectors. In 2021, vehicle-based detectors accounted largest market share as it can be easily mounted on a vehicle and be used for monitoring the pipelines through the moving vehicle. This is the most economical and fast way of detecting leaking and is therefore dominating the product type segment.
- On the basis of technology, the leak detection market is segmented into acoustic / ultrasound, fiber optic, pressure-flow deviation methods, extended real-time transient model (E-RTTM), thermal imaging, mass/volume balance, vapor sensing, laser absorption and LIDAR, hydraulic leak detection, negative pressure waves and others. In 2021, acoustic / ultrasound accounted largest market share as it offers faster detection of leakage and is low cost solution, moreover, it provides early detection and the loss can be prevented at an early stage, these factors lead to highest growth of acoustic/ultrasound in technology segment.
- On the basis of end user, the leak detection market is segmented into oil and gas, chemical plant, water treatment plants, thermal power plant, mining and slurry and others. In 2021, oil and gas accounted largest market share as this industry is a major user of leak detection system in order to prevent leakage of crude oil and gas and methane emission. The leakage can lead to severe loss of life and property. Moreover, several government regulations to prevent leak incidents have increased the demand of leak detection in oil and gas industry.
Europe Leak Detection Market Country Level Analysis
Leak detection market is analysed and market size information is provided by country, type, product type, technology and end user.
The countries covered in Europe leak detection market report are Germany, U.K., France, Switzerland, Italy, Spain, Netherlands, Russia, Belgium, Turkey and Rest of Europe.
Russia accounted largest market share owing to large number of oil and gas production and transferring pipeline projects in the region.
The country section of the report also provides individual market impacting factors and changes in regulation in the market domestically that impacts the current and future trends of the market. Data points such as new sales, replacement sales, country demographics, regulatory acts and import-export tariffs are some of the major pointers used to forecast the market scenario for individual countries. Also, presence and availability of Europe brands and their challenges faced due to large or scarce competition from local and domestic brands, impact of sales channels are considered while providing forecast analysis of the country data.
High Number of Pipeline Leakages Incidents
Leak detection market also provides you with detailed market analysis for every country growth in industry with sales, components sales, impact of technological development in leak detection and changes in regulatory scenarios with their support for the leak detection market. The data is available for historic period 2011 to 2019.
Competitive Landscape and Leak Detection Market Share Analysis
Leak detection market competitive landscape provides details by competitor. Details included are company overview, company financials, revenue generated, market potential, investment in research and development, new market initiatives, Europe presence, production sites and facilities, company strengths and weaknesses, product launch, product trials pipelines, product approvals, patents, product width and breadth, application dominance, technology lifeline curve. The above data points provided are only related to the companies’ focus related to leak detection market.
The major players covered in the report are FLIR SYSTEMS, Inc., ABB, Honeywell International Inc., Siemens Energy, Pentair, ClampOn AS, Schneider Electric, Atmos International, Xylem, Emerson Electric Co., KROHNE Messtechnik GmbH, PERMA-PIPE International Holdings, Inc., TTK, PSI Software AG, MSA, HIMA, AVEVA Group plc, Yokogawa Electric Corporation, INFICON, Fotech Group Ltd., Asel-Tech Inc., MAGNUM Pirex AG / MAGNUM LEO-Pipe GmbH and OptaSense Ltd. among others. DBMR analysts understand competitive strengths and provide competitive analysis for each competitor separately.
Many product developments are also initiated by the companies worldwide which are also accelerating the growth of leak detection market.
For instance,
- In October 2020, ABB has launched the new ABB MicroGuard, a first comprehensive gas leak detection system solution for utility industry to help safeguard city populations. The MicroGuard will work alongside ABB’s MobileGuard to pinpoint dangerous gas leaks faster and in easier way. Through this new product launch the company has expanded their product line.
- В декабре 2019 года Honeywell International Inc. объявила о приобретении Rebellion Photonics, поставщика инновационных, интеллектуальных, визуальных решений для мониторинга газа, которые помогают максимизировать безопасность, эксплуатационные характеристики и сокращение выбросов в нефтегазовой, нефтехимической и энергетической отраслях. Это приобретение поможет компании расширить свой продуктовый портфель.
Расширение производства, разработка новых продуктов и другие стратегии увеличивают долю рынка компании за счет увеличения охвата и присутствия. Это также дает преимущество организации в улучшении своего предложения по обнаружению утечек.
SKU-
Get online access to the report on the World's First Market Intelligence Cloud
- Интерактивная панель анализа данных
- Панель анализа компании для возможностей с высоким потенциалом роста
- Доступ аналитика-исследователя для настройки и запросов
- Анализ конкурентов с помощью интерактивной панели
- Последние новости, обновления и анализ тенденций
- Используйте возможности сравнительного анализа для комплексного отслеживания конкурентов
Содержание
- introduction
- OBJECTIVES OF THE STUDY
- MARKET DEFINITION
- OVERVIEW of EUROPE LEAK DETECTION MARKET
- LIMITATIONs
- MARKETS COVERED
- MARKET SEGMENTATION
- MARKETS COVERED
- geographical scope
- years considered for the study
- currency and pricing
- DBMR TRIPOD DATA VALIDATION MODEL
- primary interviews with key opinion leaders
- DBMR MARKET POSITION GRID
- vendor share analysis
- MULTIVARIATE MODELLING
- type LIFELINE CURVE
- secondary sourcEs
- assumptions
- EXECUTIVE SUMMARY
- premium insights
- Oil and gas Projects incorporating Leak detection products
- Upcoming Leak detection Tenders for Various End-Users
- market overview
- drivers
- Increasing growth in oil and gas pipeline and storage plant infrastructure
- High number of pipeline leakages incidents
- Rising Government initiatives to prevent methane leak detection
- Aging water infrastructure in developed countries
- Increasing need of leak detectors in chemical plants
- RESTRAINT
- technical complications with leak detectors
- OPPoRTUNITies
- Rising oil and gas production Europely
- Increasing Europe oil and natural gas consumption
- Increasing integration of advanced technology in leak detectors
- increasing GROWTH IN INVESTMENTS AND EXPANSIONS MADE BY the MARKET PLAYERS
- Emergence of new product developments
- CHALLENGES
- challenge associated with large diameter pipelines for effective leak detection
- rising focus on the development of renewable energy generation
- Europe economic crisis
- Impact of Covid-19 on Europe Leak Detection Market
- ANALYSIS ON IMPACT OF COVID-19 ON THE MARKET
- AFTERMATH OF COVID-19 AND GOVERNMENT INITIATIVE TO BOOST THE MARKET
- STRATEGIC DECISIONS FOR MANUFACTURERS AFTER COVID-19 TO GAIN COMPETITIVE MARKET SHARE
- IMPACT ON DEMAND
- IMPACT ON SUPPLY CHAIN
- CONCLUSION
- Europe leak detection MARKET, BY type
- overview
- Midstream
- Downstream
- upstream
- Europe leak detection MARKET, BY product type
- overview
- Vehicle-Based Detectors
- UAV-Based Detectors
- Handheld Gas Detectors
- Manned Aircraft Detectors
- others
- Europe leak detection MARKET, BY technology
- overview
- Acoustic/Ultrasound
- Extended Real-Time Transient Model (E-RTTM)
- Negative Pressure Waves
- Thermal Imaging
- Fiber Optic
- Laser Absorption and LIDAR
- Pressure-Flow Deviation Method
- Mass/Volume Balance
- Vapor Sensing
- Hydraulic Leak Detection
- others
- Europe leak detection MARKET, BY end-user
- overview
- Oil and Gas
- By loCation
- onshore
- Offshore
- By Medium
- Oil and Condensate
- Natural Gas
- By Technology
- Acoustic/Ultrasound
- Negative Pressure Waves
- Extended Real-Time Transient Model (E-RTTM)
- Thermal Imaging
- Laser Absorption and LIDAR
- Hydraulic Leak Detection
- Fiber Optic
- Pressure-Flow Deviation Method
- Mass/Volume Balance
- Vapor Sensing
- Others
- chemical plant
- By technology
- Acoustic/Ultrasound
- Thermal Imaging
- Pressure-Flow Deviation Method
- Extended Real-Time Transient Model (E-RTTM)
- Fiber Optic
- Mass/Volume Balance
- Vapor Sensing
- Laser Absorption and LIDAR
- Hydraulic Leak Detection
- Negative Pressure Waves
- Others
- water treatment Plant
- By technology
- Acoustic/Ultrasound
- Pressure-Flow Deviation Method
- Extended Real-Time Transient Model (E-RTTM)
- Vapor Sensing
- Negative Pressure Waves
- Mass/Volume Balance
- Thermal Imaging
- Laser Absorption and LIDAR
- Hydraulic Leak Detection
- Fiber Optic
- Others
- THERMAL POWER PLANT
- By technology
- Acoustic/Ultrasound
- Pressure-Flow Deviation Method
- Extended Real-Time Transient Model (E-RTTM)
- Vapor Sensing
- Negative Pressure Waves
- Mass/Volume Balance
- Thermal Imaging
- Laser Absorption and LIDAR
- Hydraulic Leak Detection
- Fiber Optic
- Others
- Mining and Slurry
- By technology
- Acoustic/Ultrasound
- Fiber Optic
- Pressure-Flow Deviation Method
- Extended Real-Time Transient Model (E-RTTM)
- Thermal Imaging
- Mass/Volume Balance
- Vapor Sensing
- Laser Absorption and LIDAR
- Hydraulic Leak Detection
- Negative Pressure Waves
- Others
- others
- EUROPE Leak detection market, by geography
- Europe
- Russia
- U.K.
- Italy
- Turkey
- Germany
- Netherlands
- Spain
- france
- belgium
- switzerland
- Rest of Europe
- Europe leak detection Market: COMPANY landscape
- Company share analysis: Europe
- swot
- company profiles
- flir systems, inc.
- COMPANY snapshot
- Revenue Analysis
- company share analysis
- product PORTFOLIO
- recent DEVELOPMENTS
- honeywell international inc.
- COMPANY snapshot
- revenue analysis
- company share analysis
- PRODUCT PORTFOLIO
- recent DEVELOPMENTS
- siemens energy
- COMPANY snapshot
- revenue analysis
- company share analysis
- PRODUCT PORTFOLIO
- recent DEVELOPMENT
- schneider electric
- COMPANY snapshot
- revenue analysis
- company share analysis
- PRODUCT PORTFOLIO
- recent DEVELOPMENTS
- inficon
- COMPANY snapshot
- Revenue analysis
- company share analysis
- PRODUCT PORTFOLIO
- recent DEVELOPMENTS
- ABB
- COMPANY snapshot
- Revenue Analysis
- company share analysis
- product PORTFOLIO
- recent DEVELOPMENTs
- asel-tech inc.
- COMPANY snapshot
- PRODUCT PORTFOLIO
- recent DEVELOPMENT
- atmos international
- COMPANY snapshot
- PRODUCT PORTFOLIO
- recent DEVELOPMENT
- aveva group plc
- COMPANY snapshot
- Revenue Analysis
- product PORTFOLIO
- recent DEVELOPMENT
- clampon as
- COMPANY snapshot
- PRODUCT PORTFOLIO
- recent DEVELOPMENT
- emerson electric co.
- COMPANY snapshot
- Revenue Analysis
- company share analysis
- product PORTFOLIO
- recent DEVELOPMENTS
- fotech group ltd.
- COMPANY snapshot
- PRODUCT PORTFOLIO
- recent DEVELOPMENT
- hawk measurement systems
- COMPANY snapshot
- PRODUCT PORTFOLIO
- recent DEVELOPMENTS
- hima
- COMPANY snapshot
- PRODUCT PORTFOLIO
- recent DEVELOPMENTS
- krohne messtechnik gmbh
- COMPANY snapshot
- PRODUCT PORTFOLIO
- recent DEVELOPMENTS
- magnum pirex ag / magnum leo-pipe gmbh
- COMPANY snapshot
- PRODUCT PORTFOLIO
- recent DEVELOPMENT
- msa
- COMPANY snapshot
- revenue analysis
- PRODUCT PORTFOLIO
- recent DEVELOPMENTS
- optasense ltd
- COMPANY snapshot
- PRODUCT PORTFOLIO
- recent DEVELOPMENTS
- pentair
- COMPANY snapshot
- revenue analysis
- PRODUCT PORTFOLIO
- recent DEVELOPMENT
- perma-pipe international holdings, inc.
- COMPANY snapshot
- revenue analysis
- PRODUCT PORTFOLIO
- recent DEVELOPMENTS
- psi software ag
- COMPANY snapshot
- revenue analysis
- PRODUCT PORTFOLIO
- recent DEVELOPMENT
- ttk - Leak Detection System
- COMPANY snapshot
- PRODUCT PORTFOLIO
- recent DEVELOPMENTS
- xylem
- COMPANY snapshot
- Revenue Analysis
- brand PORTFOLIO
- recent DEVELOPMENTS
- yokogawa electric corporation
- COMPANY snapshot
- Revenue Analysis
- Product PORTFOLIO
- recent developments
- questionnaire
- related reports
Список таблиц
TABLE 1 SUMMARY OF PIPELINE INCIDENTS FROM JANUARY 2010 TO DECEMBER 2019
TABLE 2 THE 10 LARGEST OIL PRODUCERS AND SHARE OF TOTAL WORLD OIL PRODUCTION IN 2019
TABLE 3 THE 10 LARGEST OIL CONSUMERS AND SHARE OF TOTAL WORLD OIL CONSUMPTION IN 2018
TABLE 4 Europe Leak Detection Market, By Type, 2019-2028 (USD Million)
TABLE 5 Europe Midstream in Leak Detection Market, By Region,2019-2028, (USD Million)
TABLE 6 Europe Downstream in Leak Detection Market, By Region,2019-2028, (USD Million)
TABLE 7 Europe Upstream in Leak Detection Market, By Region,2019-2028, (USD Million)
TABLE 8 Europe LEAK Detection Market, By Product Type, 2019-2028 (USD Million)
TABLE 9 Europe Vehicle Based-Detectors in Leak Detection Market, By Region,2019-2028, (USD Million)
TABLE 10 Europe UAV-Based Detectors in Leak Detection Market, By Region,2019-2028, (USD Million)
TABLE 11 Europe Handheld Gas Detectors in Leak Detection Market, By Region,2019-2028, (USD Million)
TABLE 12 Europe Manned Aircraft Detectors in Leak Detection Market, By Region,2019-2028, (USD Million)
TABLE 13 Europe Others in Leak Detection Market, By Region,2019-2028, (USD Million)
TABLE 14 Europe LEAK Detection Market, By Technology, 2019-2028 (USD Million)
TABLE 15 Europe Acoustic/Ultrasound in Leak Detection Market, By Region,2019-2028, (USD Million)
TABLE 16 Europe Extended Real-Time Transient Model (E-RTTM) in Leak Detection Market, By Region,2019-2028, (USD Million)
TABLE 17 Europe Negative Pressure Waves in Leak Detection Market, By Region,2019-2028, (USD Million)
TABLE 18 Europe Thermal Imaging in Leak Detection Market, By Region,2019-2028, (USD Million)
TABLE 19 Europe Fibre Optic in Leak Detection Market, By Region,2019-2028, (USD Million)
TABLE 20 Europe Laser Absorption and LIDAR in Leak Detection Market, By Region,2019-2028, (USD Million)
TABLE 21 Europe Pressure-Flow Deviation Method in Leak Detection Market, By Region,2019-2028, (USD Million)
TABLE 22 Europe Mass/Volume Balance in Leak Detection Market, By Region,2019-2028, (USD Million)
TABLE 23 Europe Vapor Sensing in Leak Detection Market, By Region,2019-2028, (USD Million)
TABLE 24 Europe Hydraulic Leak Detection in Leak Detection Market, By Region,2019-2028, (USD Million)
TABLE 25 Europe Others in Leak Detection Market, By Region,2019-2028, (USD Million)
TABLE 26 Europe Leak Detection Market, By End User, 2019-2028 (USD Million)
TABLE 27 Europe Oil and Gas in Leak Detection Market, By Region,2019-2028, (USD Million)
TABLE 28 Europe Oil and Gas in Leak Detection Market, By Location, 2019-2028 (USD Million)
TABLE 29 Europe Oil and Gas Leak Detection Market, By Medium, 2019-2028 (USD Million)
TABLE 30 Europe Oil and Gas Leak Detection Market, By Technology, 2019-2028 (USD Million)
TABLE 31 Europe Chemical Plant in Leak Detection Market, By Region,2019-2028, (USD Million)
TABLE 32 Europe Chemical Plant Leak Detection Market, By Technology, 2019-2028 (USD Million)
TABLE 33 Europe Water Treatment Plant in Leak Detection Market, By Region,2019-2028, (USD Million)
TABLE 34 Europe Water Treatment Plant Leak Detection Market, By Technology, 2019-2028 (USD Million)
TABLE 35 Europe Thermal Power Plant in Leak Detection Market, By Region,2019-2028, (USD Million)
TABLE 36 Europe Thermal Power Plant Leak Detection Market, By Technology, 2019-2028 (USD Million)
TABLE 37 Europe Mining and Slurry in Leak Detection Market, By Region,2019-2028, (USD Million)
TABLE 38 Europe Mining and Slurry in Leak Detection Market, By technology, Market Forecast 2021-2028 (USD Million)
TABLE 39 Europe Mining and Slurry in Leak detection market, By region, Market Forecast 2021-2028 (USD Million)
TABLE 40 Europe leak detection MARKET, BY COUNTRY, 2019-2028 (USD Million)
TABLE 41 Europe Leak Detection Market, By Type, 2019-2028 (USD Million)
TABLE 42 Europe Leak Detection Market, By Product Type, 2019-2028 (USD Million)
TABLE 43 Europe Leak Detection Market, By Technology, 2019-2028 (USD Million)
TABLE 44 Europe leak detection Market, By end user, 2019-2028 (USD Million)
TABLE 45 Europe Oil and Gas in Leak Detection Market, By Location, 2019-2028 (USD Million)
TABLE 46 Europe Oil and Gas Leak Detection Market, By Medium, 2019-2028 (USD Million)
TABLE 47 Europe Oil and Gas Leak Detection Market, By Technology, 2019-2028 (USD Million)
TABLE 48 Europe Chemical Plant Leak Detection Market, By Technology, 2019-2028 (USD Million)
TABLE 49 Europe Water Treatment Plant Leak Detection Market, By Technology, 2019-2028 (USD Million)
TABLE 50 Europe Thermal Power Plant Leak Detection Market, By Technology, 2019-2028 (USD Million)
TABLE 51 Europe Mining and Slurry Leak Detection Market, By Technology, 2019-2028 (USD Million)
TABLE 52 Russia Leak Detection Market, By Type, 2019-2028 (USD Million)
TABLE 53 Russia Leak Detection Market, By Product Type, 2019-2028 (USD Million)
TABLE 54 Russia Leak Detection Market, By Technology, 2019-2028 (USD Million)
TABLE 55 Russia leak detection Market, By end user, 2019-2028 (USD Million)
TABLE 56 Russia Oil and Gas in Leak Detection Market, By Location, 2019-2028 (USD Million)
TABLE 57 Russia Oil and Gas Leak Detection Market, By Medium, 2019-2028 (USD Million)
TABLE 58 Russia Oil and Gas Leak Detection Market, By Technology, 2019-2028 (USD Million)
TABLE 59 Russia Chemical Plant Leak Detection Market, By Technology, 2019-2028 (USD Million)
TABLE 60 Russia Water Treatment Plant Leak Detection Market, By Technology, 2019-2028 (USD Million)
TABLE 61 Russia Thermal Power Plant Leak Detection Market, By Technology, 2019-2028 (USD Million)
TABLE 62 Russia Mining and Slurry Leak Detection Market, By Technology, 2019-2028 (USD Million)
TABLE 63 U.K. Leak Detection Market, By Type, 2019-2028 (USD Million)
TABLE 64 U.K. Leak Detection Market, By Product Type, 2019-2028 (USD Million)
TABLE 65 U.K. Leak Detection Market, By Technology, 2019-2028 (USD Million)
TABLE 66 U.K. leak detection Market, By end user, 2019-2028 (USD Million)
TABLE 67 U.K. Oil and Gas in Leak Detection Market, By Location, 2019-2028 (USD Million)
TABLE 68 U.K. Oil and Gas Leak Detection Market, By Medium, 2019-2028 (USD Million)
TABLE 69 U.K. Oil and Gas Leak Detection Market, By Technology, 2019-2028 (USD Million)
TABLE 70 U.K. Chemical Plant Leak Detection Market, By Technology, 2019-2028 (USD Million)
TABLE 71 U.K. Water Treatment Plant Leak Detection Market, By Technology, 2019-2028 (USD Million)
TABLE 72 U.K. Thermal Power Plant Leak Detection Market, By Technology, 2019-2028 (USD Million)
TABLE 73 U.K. Mining and Slurry Leak Detection Market, By Technology, 2019-2028 (USD Million)
TABLE 74 Italy Leak Detection Market, By Type, 2019-2028 (USD Million)
TABLE 75 Italy Leak Detection Market, By Product Type, 2019-2028 (USD Million)
TABLE 76 Italy Leak Detection Market, By Technology, 2019-2028 (USD Million)
TABLE 77 Italy leak detection Market, By end user, 2019-2028 (USD Million)
TABLE 78 Italy Oil and Gas in Leak Detection Market, By Location, 2019-2028 (USD Million)
TABLE 79 Italy Oil and Gas Leak Detection Market, By Medium, 2019-2028 (USD Million)
TABLE 80 Italy Oil and Gas Leak Detection Market, By Technology, 2019-2028 (USD Million)
TABLE 81 Italy Chemical Plant Leak Detection Market, By Technology, 2019-2028 (USD Million)
TABLE 82 Italy Water Treatment Plant Leak Detection Market, By Technology, 2019-2028 (USD Million)
TABLE 83 Italy Thermal Power Plant Leak Detection Market, By Technology, 2019-2028 (USD Million)
TABLE 84 Italy Mining and Slurry Leak Detection Market, By Technology, 2019-2028 (USD Million)
TABLE 85 Turkey Leak Detection Market, By Type, 2019-2028 (USD Million)
TABLE 86 Turkey Leak Detection Market, By Product Type, 2019-2028 (USD Million)
TABLE 87 Turkey Leak Detection Market, By Technology, 2019-2028 (USD Million)
TABLE 88 Turkey leak detection Market, By end user, 2019-2028 (USD Million)
TABLE 89 Turkey Oil and Gas in Leak Detection Market, By Location, 2019-2028 (USD Million)
TABLE 90 Turkey Oil and Gas Leak Detection Market, By Medium, 2019-2028 (USD Million)
TABLE 91 Turkey Oil and Gas Leak Detection Market, By Technology, 2019-2028 (USD Million)
TABLE 92 Turkey Chemical Plant Leak Detection Market, By Technology, 2019-2028 (USD Million)
TABLE 93 Turkey Water Treatment Plant Leak Detection Market, By Technology, 2019-2028 (USD Million)
TABLE 94 Turkey Thermal Power Plant Leak Detection Market, By Technology, 2019-2028 (USD Million)
TABLE 95 Turkey Mining and Slurry Leak Detection Market, By Technology, 2019-2028 (USD Million)
TABLE 96 Germany Leak Detection Market, By Type, 2019-2028 (USD Million)
TABLE 97 Germany Leak Detection Market, By Product Type, 2019-2028 (USD Million)
TABLE 98 Germany Leak Detection Market, By Technology, 2019-2028 (USD Million)
TABLE 99 Germany leak detection Market, By end user, 2019-2028 (USD Million)
TABLE 100 Germany Oil and Gas in Leak Detection Market, By Location, 2019-2028 (USD Million)
TABLE 101 Germany Oil and Gas Leak Detection Market, By Medium, 2019-2028 (USD Million)
TABLE 102 Germany Oil and Gas Leak Detection Market, By Technology, 2019-2028 (USD Million)
TABLE 103 Germany Chemical Plant Leak Detection Market, By Technology, 2019-2028 (USD Million)
TABLE 104 Germany Water Treatment Plant Leak Detection Market, By Technology, 2019-2028 (USD Million)
TABLE 105 Germany Thermal Power Plant Leak Detection Market, By Technology, 2019-2028 (USD Million)
TABLE 106 Germany Mining and Slurry Leak Detection Market, By Technology, 2019-2028 (USD Million)
TABLE 107 Netherlands Leak Detection Market, By Type, 2019-2028 (USD Million)
TABLE 108 Netherlands Leak Detection Market, By Product Type, 2019-2028 (USD Million)
TABLE 109 Netherlands Leak Detection Market, By Technology, 2019-2028 (USD Million)
TABLE 110 Netherlands leak detection Market, By end user, 2019-2028 (USD Million)
TABLE 111 Netherlands Oil and Gas in Leak Detection Market, By Location, 2019-2028 (USD Million)
TABLE 112 Netherlands Oil and Gas Leak Detection Market, By Medium, 2019-2028 (USD Million)
TABLE 113 Netherlands Oil and Gas Leak Detection Market, By Technology, 2019-2028 (USD Million)
TABLE 114 Netherlands Chemical Plant Leak Detection Market, By Technology, 2019-2028 (USD Million)
TABLE 115 Netherlands Water Treatment Plant Leak Detection Market, By Technology, 2019-2028 (USD Million)
TABLE 116 Netherlands Thermal Power Plant Leak Detection Market, By Technology, 2019-2028 (USD Million)
TABLE 117 Netherlands Mining and Slurry Leak Detection Market, By Technology, 2019-2028 (USD Million)
TABLE 118 Spain Leak Detection Market, By Type, 2019-2028 (USD Million)
TABLE 119 Spain Leak Detection Market, By Product Type, 2019-2028 (USD Million)
TABLE 120 Spain Leak Detection Market, By Technology, 2019-2028 (USD Million)
TABLE 121 spain leak detection Market, By end user, 2019-2028 (USD Million)
TABLE 122 spain Oil and Gas in Leak Detection Market, By Location, 2019-2028 (USD Million)
TABLE 123 spain Oil and Gas Leak Detection Market, By Medium, 2019-2028 (USD Million)
TABLE 124 spain Oil and Gas Leak Detection Market, By Technology, 2019-2028 (USD Million)
TABLE 125 spain Chemical Plant Leak Detection Market, By Technology, 2019-2028 (USD Million)
TABLE 126 spain Water Treatment Plant Leak Detection Market, By Technology, 2019-2028 (USD Million)
TABLE 127 spain Thermal Power Plant Leak Detection Market, By Technology, 2019-2028 (USD Million)
TABLE 128 spain Mining and Slurry Leak Detection Market, By Technology, 2019-2028 (USD Million)
TABLE 129 france Leak Detection Market, By Type, 2019-2028 (USD Million)
TABLE 130 france Leak Detection Market, By Product Type, 2019-2028 (USD Million)
TABLE 131 france Leak Detection Market, By Technology, 2019-2028 (USD Million)
TABLE 132 france leak detection Market, By end user, 2019-2028 (USD Million)
TABLE 133 france Oil and Gas in Leak Detection Market, By Location, 2019-2028 (USD Million)
TABLE 134 france Oil and Gas Leak Detection Market, By Medium, 2019-2028 (USD Million)
TABLE 135 france Oil and Gas Leak Detection Market, By Technology, 2019-2028 (USD Million)
TABLE 136 france Chemical Plant Leak Detection Market, By Technology, 2019-2028 (USD Million)
TABLE 137 france Water Treatment Plant Leak Detection Market, By Technology, 2019-2028 (USD Million)
TABLE 138 france Thermal Power Plant Leak Detection Market, By Technology, 2019-2028 (USD Million)
TABLE 139 france Mining and Slurry Leak Detection Market, By Technology, 2019-2028 (USD Million)
TABLE 140 belgium Leak Detection Market, By Type, 2019-2028 (USD Million)
TABLE 141 belgium Leak Detection Market, By Product Type, 2019-2028 (USD Million)
TABLE 142 belgium Leak Detection Market, By Technology, 2019-2028 (USD Million)
TABLE 143 belgium leak detection Market, By end user, 2019-2028 (USD Million)
TABLE 144 belgium Oil and Gas in Leak Detection Market, By Location, 2019-2028 (USD Million)
TABLE 145 belgium Oil and Gas Leak Detection Market, By Medium, 2019-2028 (USD Million)
TABLE 146 belgium Oil and Gas Leak Detection Market, By Technology, 2019-2028 (USD Million)
TABLE 147 belgium Chemical Plant Leak Detection Market, By Technology, 2019-2028 (USD Million)
TABLE 148 belgium Water Treatment Plant Leak Detection Market, By Technology, 2019-2028 (USD Million)
TABLE 149 belgium Thermal Power Plant Leak Detection Market, By Technology, 2019-2028 (USD Million)
TABLE 150 belgium Mining and Slurry Leak Detection Market, By Technology, 2019-2028 (USD Million)
TABLE 151 Switzerland Leak Detection Market, By Type, 2019-2028 (USD Million)
TABLE 152 Switzerland Leak Detection Market, By Product Type, 2019-2028 (USD Million)
TABLE 153 Switzerland Leak Detection Market, By Technology, 2019-2028 (USD Million)
TABLE 154 Switzerland leak detection Market, By end user, 2019-2028 (USD Million)
TABLE 155 Switzerland Oil and Gas in Leak Detection Market, By Location, 2019-2028 (USD Million)
TABLE 156 Switzerland Oil and Gas Leak Detection Market, By Medium, 2019-2028 (USD Million)
TABLE 157 Switzerland Oil and Gas Leak Detection Market, By Technology, 2019-2028 (USD Million)
TABLE 158 Switzerland Chemical Plant Leak Detection Market, By Technology, 2019-2028 (USD Million)
TABLE 159 Switzerland Water Treatment Plant Leak Detection Market, By Technology, 2019-2028 (USD Million)
TABLE 160 Switzerland Thermal Power Plant Leak Detection Market, By Technology, 2019-2028 (USD Million)
TABLE 161 Switzerland Mining and Slurry Leak Detection Market, By Technology, 2019-2028 (USD Million)
TABLE 162 Rest of Europe Leak detection MARKET, BY type, 2019-2028 (USD Million)
Список рисунков
FIGURE 1 Europe Leak Detection market: segmentation
FIGURE 2 EUROPE LEAK DETECTION MARKET: data triangulation
FIGURE 3 Europe Leak Detection market: DROC ANALYSIS
FIGURE 4 Europe Leak Detection market: EUROPE VS regional MARKET ANALYSIS
FIGURE 5 EUROPE LEAK DETECTION MARKET: COMPANY RESEARCH ANALYSIS
FIGURE 6 EUROPE LEAK DETECTION MARKET: INTERVIEW DEMOGRAPHICS
FIGURE 7 Europe Leak Detection market: DBMR MARKET POSITION GRID
FIGURE 8 Europe leak detection market: vendor share analysis
FIGURE 9 Europe Leak Detection market: SEGMENTATION
FIGURE 10 increasing growth in oil and gas pipeline and storage plant infrastructure is expected to DRIVe Europe Leak Detection MARKET IN THE FORECAST PERIOD of 2021 to 2028
FIGURE 11 midstream segment is expected to account for the largest share of Europe Leak Detection market in 2021 & 2028
FIGURE 12 DRIVERS, RESTRAINT, OPPORTUNITIES AND CHALLENGES OF EUROPE LEAK DETECTION MARKET
FIGURE 13 Europe leak detection MARKET: BY type, 2020
FIGURE 14 Europe leak detection MARKET: BY product type, 2020
FIGURE 15 Europe leak detection MARKET: BY technology, 2020
FIGURE 16 Europe leak detection MARKET: BY end user, 2020
FIGURE 17 Europe leak detection market: SNAPSHOT (2020)
FIGURE 18 Europe leak detection market: BY COUNTRY (2020)
FIGURE 19 Europe leak detection market: BY COUNTRY (2021& 2028)
FIGURE 20 Europe leak detection market: BY COUNTRY (2020& 2028)
FIGURE 21 Europe leak detection market: BY type (2021-2028)
FIGURE 22 EUROPE LEAK DETECTION market: COMPANY SHARE 2020 (%)
Методология исследования
Сбор данных и анализ базового года выполняются с использованием модулей сбора данных с большими размерами выборки. Этап включает получение рыночной информации или связанных данных из различных источников и стратегий. Он включает изучение и планирование всех данных, полученных из прошлого заранее. Он также охватывает изучение несоответствий информации, наблюдаемых в различных источниках информации. Рыночные данные анализируются и оцениваются с использованием статистических и последовательных моделей рынка. Кроме того, анализ доли рынка и анализ ключевых тенденций являются основными факторами успеха в отчете о рынке. Чтобы узнать больше, пожалуйста, запросите звонок аналитика или оставьте свой запрос.
Ключевой методологией исследования, используемой исследовательской группой DBMR, является триангуляция данных, которая включает в себя интеллектуальный анализ данных, анализ влияния переменных данных на рынок и первичную (отраслевую экспертную) проверку. Модели данных включают сетку позиционирования поставщиков, анализ временной линии рынка, обзор рынка и руководство, сетку позиционирования компании, патентный анализ, анализ цен, анализ доли рынка компании, стандарты измерения, глобальный и региональный анализ и анализ доли поставщика. Чтобы узнать больше о методологии исследования, отправьте запрос, чтобы поговорить с нашими отраслевыми экспертами.
Доступна настройка
Data Bridge Market Research является лидером в области передовых формативных исследований. Мы гордимся тем, что предоставляем нашим существующим и новым клиентам данные и анализ, которые соответствуют и подходят их целям. Отчет можно настроить, включив в него анализ ценовых тенденций целевых брендов, понимание рынка для дополнительных стран (запросите список стран), данные о результатах клинических испытаний, обзор литературы, обновленный анализ рынка и продуктовой базы. Анализ рынка целевых конкурентов можно проанализировать от анализа на основе технологий до стратегий портфеля рынка. Мы можем добавить столько конкурентов, о которых вам нужны данные в нужном вам формате и стиле данных. Наша команда аналитиков также может предоставить вам данные в сырых файлах Excel, сводных таблицах (книга фактов) или помочь вам в создании презентаций из наборов данных, доступных в отчете.