

North America Application Container Market, By Offering (Container Data Management & Orchestration, Container Monitoring & Security, Container Networking, Consultation, and Others), Deployment Mode (Public Cloud, Private Cloud/On Premise, and Hybrid Cloud), Enterprise Size (Small Enterprise, Medium Enterprise, and Large Enterprise), Application (Collaboration, Modernization, Production, and Others), Vertical (IT & Telecommunication, BFSI, Retail & E-commerce, Healthcare & Lifesciences, Education, Media & Entertainment, and Others) Industry Trends and Forecast to 2030.
North America Application Container Market Analysis and Size
An application container is an optional, user-created CDB component that stores data and metadata for one or more application back ends. A CDB includes zero or more application containers. Within an application container, an application is the named, versioned set of common data and metadata stored in the application root. In this context of an application container, the term "application" means "master application definition." For example, the application might include definitions of tables, views, and packages.
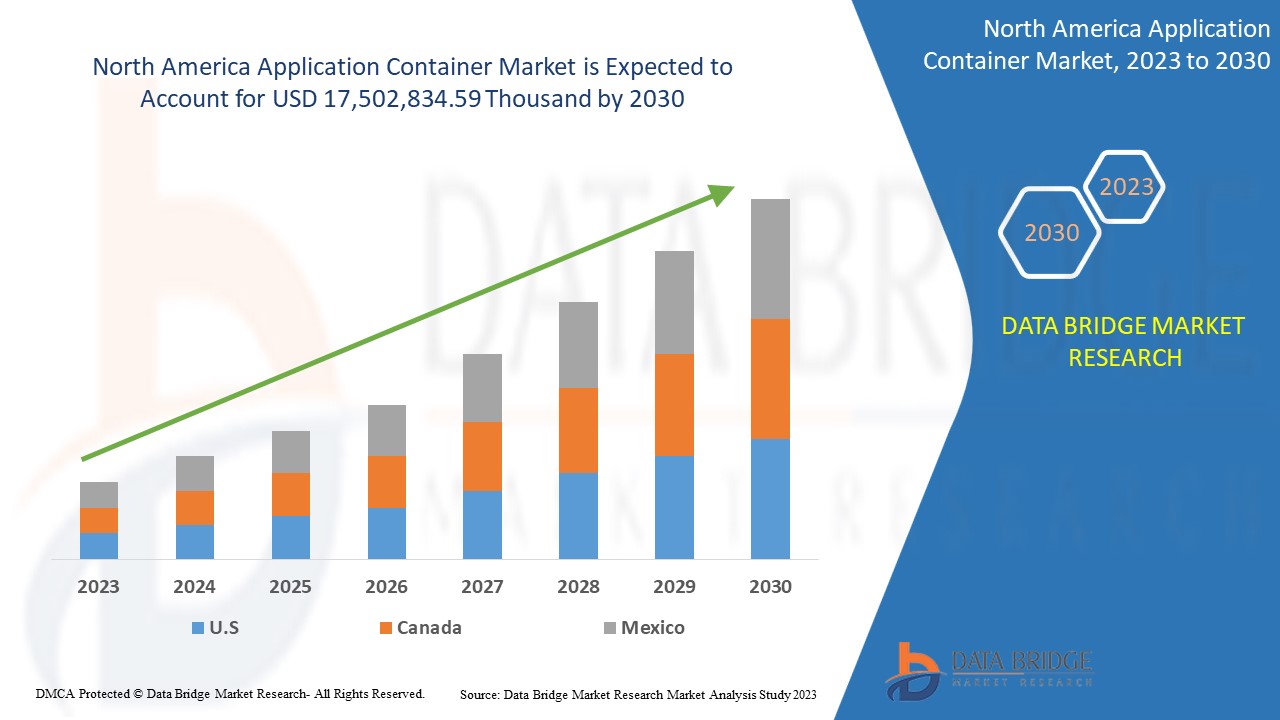
Data Bridge Market Research analyses that the application container market is expected to reach the value of USD 17,502,834.59 thousand by 2030, at a CAGR of 33.2% during the forecast period. "Container Data Management & Orchestration" accounts for the largest offering segment in the application container market due to rapid technological developments to commercialize application containers' use. The application container market report also covers pricing analysis, patent analysis, and technological advancements in depth.
|
Report Metric |
Details |
|
Forecast Period |
2023 to 2030 |
|
Base Year |
2022 |
|
Historic Year |
2021 (Customizable to 2020 - 2015) |
|
Quantitative Units |
Revenue in USD Thousand, Volumes in Thousand Units, Pricing in USD |
|
Segments Covered |
By Offering (Container Data Management & Orchestration, Container Monitoring & Security, Container Networking, Consultation, and Others), Deployment Mode (Public Cloud, Private Cloud/On Premise, and Hybrid Cloud), Enterprise Size (Small Enterprise, Medium Enterprise, and Large Enterprise), Application (Collaboration, Modernization, Production, and Others), Vertical (IT & Telecommunication, BFSI, Retail & E-commerce, Healthcare & Lifesciences, Education, Media & Entertainment, and Others). |
|
Countries Covered |
U.S., Canada, and Mexico. |
|
Market Players Covered |
Amazon Web Services, Inc. (a subsidiary of Amazon.com, Inc), Google LLC, Microsoft, Palo Alto Networks, SUSE, Hewlett Packard Enterprise Development LP, Broadcom, VMware, Inc., Alibaba Group Holding Limited, IBM Corporation, Cisco Systems, Inc., Portworx, Joyent, Portainer, WEAVEWORKS. |
Market Definition
Application container is a stand-alone, all-in-one package for a software application. The software application offers dependency for different business operations, including application binaries and hardware components. The containerized application includes various features such as data management, monitoring, networking, and consultation. These features can be deployed through various deployment modes for collaboration or the modernization of business operations. This software enables end-user organizations to enhance their core competencies such as security, network connectivity, customer relationships, and end-to-end services monitoring, optimizing resource utilization and saving operating costs.
Application Container Market Dynamics
This section deals with understanding the market drivers, advantages, opportunities, restraints, and challenges. All of this is discussed in detail below:
Drivers
- Rise in Volume of Organizational Data
Organizational data describe organizations' central characteristics, including internal processes, structures, corporate actions, employee statistics, and many others. Nowadays, documentation of existing information of an organization is in huge demand. This documentation is not done through traditional methods but in a modern way that is stored in soft copy rather than on paper. The documentation of every organization's process has been common in recent years because it is associated with many benefits for different cases, such as hiring strategy, market intelligence, industry overviews, and many others. Corporate data can also support and inform monitoring efforts by building news feeds of important events and helping spot trends within companies.
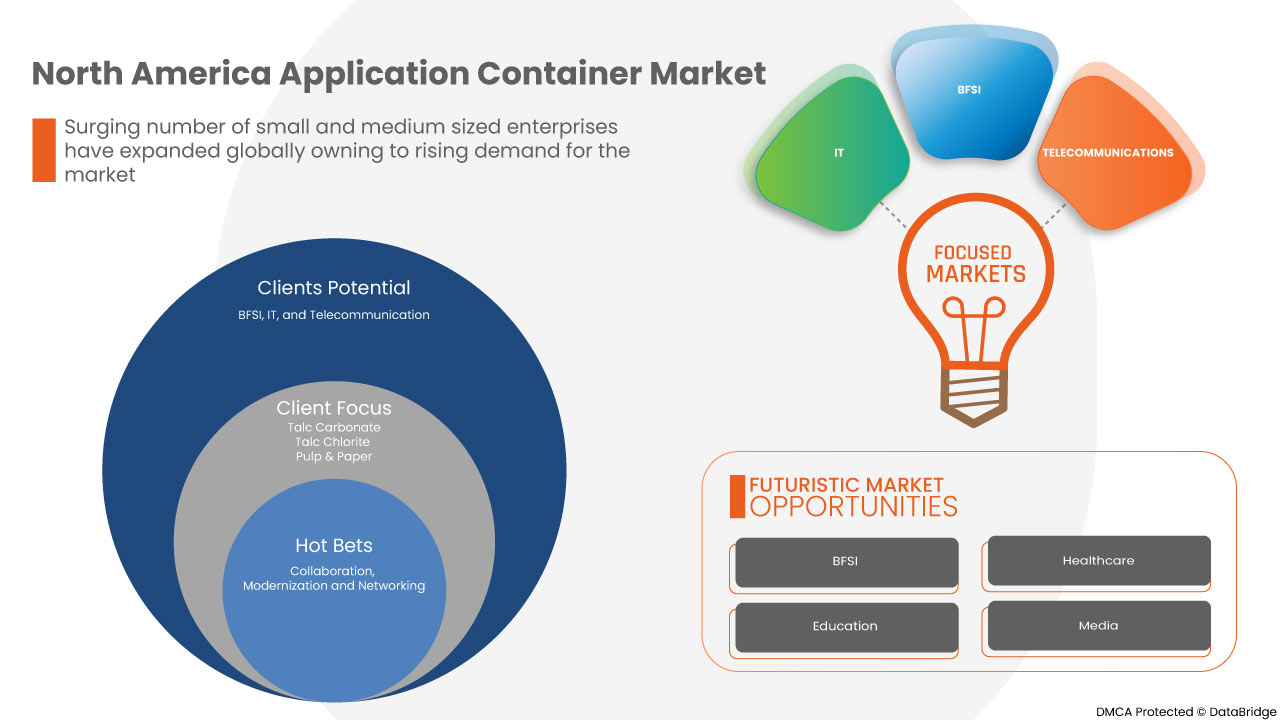
- Surging Number of Small and Medium-Sized Enterprises
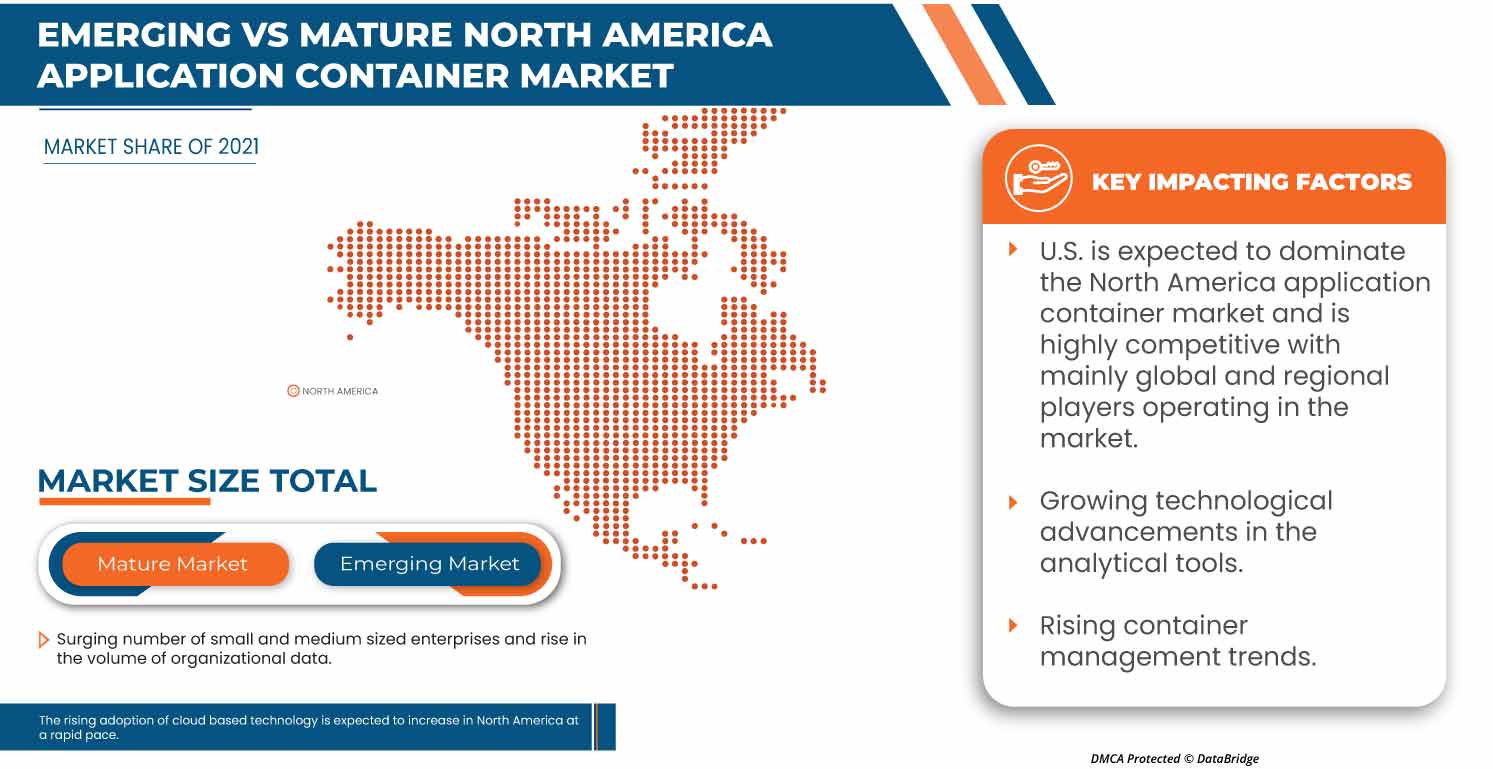
Small and Medium-Sized Enterprises (SMEs) are independent firms with fewer employees and play a major role in economic growth. Moreover, SMEs contribute 60% to 70% of employment in most countries. As larger firms are downsizing and outsourcing, the function has increased revenue growth for SMEs.
Furthermore, these firms have traditionally focused on domestic markets, but others are going to North America. In North America, such SMEs are mostly due to inter-firm linkages and clusters. However, networking allows SMEs to combine with greater organizations, but the data and business operations need to be digital and integrated.
Opportunities
- Rise in Adoption of Cloud-Based Technology
Digitalization is one of the boosting factors for cloud deployment of business operations, which has a wide range of benefits and requires proper maintenance and additional equipment and infrastructure to manage the working system properly. Thus, this process includes managing collected data, saving, processing, analyzing, sharing, and implementing many more operations. However, digitalization simplifies and automates the core working operations of the business but creates a need for advanced technology and infrastructure.
Thus, digitalization is supported through cloud-based application deployment. This has created a huge demand for data management worldwide and a need for data integration and privacy policy. As a result, adopting digitalization gained a prominent role in accelerating the country's economic growth and could empower current and future generations.
- Rise in the Container Management Trends
Container management is associated with various benefits and is operated through IT admins in organizations that can start, stop, and restart the working of the containers. Thus, it includes orchestration and schedulers, security tools, storage, virtual network management systems, and monitoring.
The container management system automates orchestration, log management, monitoring, networking, load balancing, testing, and secrets management. Such benefits will support the organizations' work process as such advantages boost the usage of container management solutions.
Restraint/challenge
- Lack of Skilled Workforce and Technological Expertise
Moreover, the experts must understand the working process and integration technology with business processes. The process improvement through the application container involves data management, inputting the data, and analyzing based on a pre-scheduled set of formulas developed in the software based on users' and project requirements.
The major problem associated with the application container is the proper data management by the user or the professional assigned to manage the application-related data. Managing the software by the user requires a set of skills that helps handle the software's related data properly. Application containerization involves strategic management and planning, critical technical skills that the users need to develop and excel in achieving organizational goals.
Post-COVID-19 Impact on Application Container Market
COVID-19 significantly impacted the application container market as almost every country has opted for the shutdown for every production facility except those producing essential goods. The government has taken some strict actions, such as shutting down the production and sale of non-essential goods, blocking international trade, and many more to prevent the spread of COVID-19. The only business dealing with this pandemic is the essential services allowed to open and run the processes.
The growth of the North America application container market is increasing as automation in the automotive sector has increased the demand for various application container-related products. These services are widely used in data monitoring and storing data on a cloud platform. Hence, growing technological advancements in analytical tools over the forecast period. However, factors such as high chances of emergency for application container sprawl restrain the market growth. The shutdown of production facilities during the pandemic situation has had a significant impact on the market.
Service providers are making various strategic decisions to bounce back post-COVID-19. The players are conducting multiple research and development activities to improve the technology involved in the application container. The companies will bring advanced and accurate controllers to the market.
Recent Developments
- In November 2022, Datadog reported on the rise in Kubernetes container management system adoption. Today, nearly half of container organizations run Kubernetes to deploy and manage containers in a growing ecosystem.
- In March 2022, ABSL found the boom in digitalization and modern technologies, increasing the need for data analytics. Data analytics is often used for technological decisions, finding new market strategies, and growth opportunities for the business.
North America Application Container Market Scope
The North America application container market is segmented based on offering, deployment mode, enterprise size, application, and vertical. The growth amongst these segments will help you analyze major growth segments in the industries and provide the users with a valuable market overview and market insights to help them make strategic decisions for identifying core market applications.
Offering
- Container Data Management & Orchestration
- Container Monitoring & Security
- Container Networking
- Consultation
- Others
On the basis of offering, the North America application container market is segmented into container data management & orchestration, container monitoring & security, container networking, consultation, and others.
Deployment Mode
- Public Cloud
- Private Cloud/On Premise
- Hybrid Cloud
On the basis of deployment mode, the North America application container market has been segmented into public cloud, private cloud/on premise, and hybrid cloud.
Enterprise Size
- Large Enterprise
- Medium Enterprise
- Small Enterprise
On the basis of enterprise size, the North America application container market has been segmented into large enterprise, medium enterprise, and small enterprise.
Application
- Collaboration
- Modernization
- Production
- Others
On the basis of application, the North America application container market has been segmented into collaboration, modernization, production, and others.
Vertical
- IT & Telecommunication
- BFSI
- Retail & E-commerce,
- Healthcare & Lifesciences
- Education
- Media & Entertainment
- Others
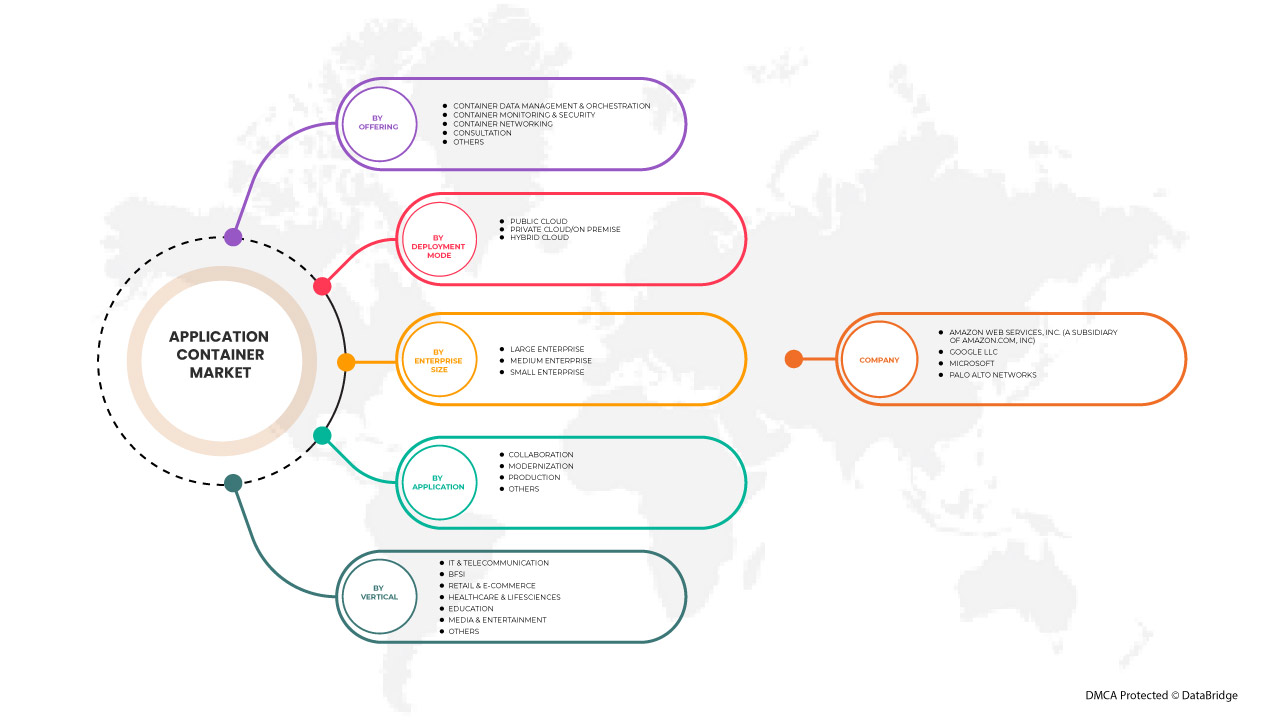
On the basis of vertical, the North America application container market has been segmented into IT & Telecommunication, BFSI, retail & e-commerce, healthcare & lifesciences, education, media & entertainment, and others.
Application Container Market Regional Analysis/Insights
The application container market is analyzed and market size insights and trends are provided by country, offering, deployment mode, enterprise size, application, and vertical, as referenced above.
The countries covered in the North America application container market report are U.S., Canada, and Mexico.
U.S. dominates the North America region due to continuous increases in financial investments in container technology.
The country section of the report also provides individual market-impacting factors and market regulation changes that impact the market's current and future trends. Data points like downstream and upstream value chain analysis, technical trends, porter's five forces analysis, and case studies are some pointers used to forecast the market scenario for individual countries. Also, the presence and availability of North America brands and their challenges faced due to large or scarce competition from local and domestic brands, the impact of domestic tariffs, and trade routes are considered while providing forecast analysis of the country data.
Competitive Landscape and Application Container Market Share Analysis
The North America application container market competitive landscape provides details of competitors. Details included are company overview, company financials, revenue generated, market potential, investment in research and development, new market initiatives, North America presence, production sites and facilities, production capacities, company strengths and weaknesses, product launch, product width and breadth, and application dominance. The above data points provided are only related to the companies focus on the application container market.
Some of the major players operating in the North America application container market are Amazon Web Services, Inc. (a subsidiary of Amazon.com, Inc), Google LLC, Microsoft, Palo Alto Networks, SUSE, Hewlett Packard Enterprise Development LP, Broadcom, VMware, Inc., Alibaba Group Holding Limited, IBM Corporation, Cisco Systems, Inc., Portworx, Joyent, Portainer, and WEAVEWORKS.
SKU-
세계 최초의 시장 정보 클라우드 보고서에 온라인으로 접속하세요

- 대화형 데이터 분석 대시보드
- 높은 성장 잠재력 기회를 위한 회사 분석 대시보드
- 사용자 정의 및 질의를 위한 리서치 분석가 액세스
- 대화형 대시보드를 통한 경쟁자 분석
- 최신 뉴스, 업데이트 및 추세 분석
- 포괄적인 경쟁자 추적을 위한 벤치마크 분석의 힘 활용
목차
1 INTRODUCTION
1.1 OBJECTIVES OF THE STUDY
1.2 MARKET DEFINITION
1.3 OVERVIEW OF NORTH AMERICA APPLICATION CONTAINER MARKET
1.4 CURRENCY AND PRICING
1.5 LIMITATIONS
1.6 MARKETS COVERED
2 MARKET SEGMENTATION
2.1 MARKETS COVERED
2.2 GEOGRAPHICAL SCOPE
2.3 YEARS CONSIDERED FOR THE STUDY
2.4 DBMR TRIPOD DATA VALIDATION MODEL
2.5 PRIMARY INTERVIEWS WITH KEY OPINION LEADERS
2.6 DBMR MARKET POSITION GRID
2.7 VENDOR SHARE ANALYSIS
2.8 MULTIVARIATE MODELING
2.9 OFFERING TIMELINE CURVE
2.1 MARKET APPLICATION GRID
2.11 SECONDARY SOURCES
2.12 ASSUMPTIONS
3 EXECUTIVE SUMMARY
4 PREMIUM INSIGHTS
4.1 TOP WINNING STRATEGIES BY COMPANIES
4.2 PORTER’S FIVE FORCES ANALYSIS
4.3 ECOSYSTEM MARKET MAP
4.4 TECHNOLOGICAL TRENDS
4.5 VALUE CHAIN ANALYSIS
4.6 BRAND ANALYSIS
5 REGIONAL SUMMARY
5.1 SUMMARY WRITE-UP (NORTH AMERICA)
5.2 SUMMARY WRITE-UP (EUROPE)
5.3 SUMMARY WRITE-UP (ASIA-PACIFIC)
5.4 SUMMARY WRITE-UP (MIDDLE EAST AND AFRICA)
5.5 SUMMARY WRITE-UP (SOUTH AMERICA)
6 MARKET OVERVIEW
6.1 DRIVERS
6.1.1 RISE IN VOLUME OF ORGANIZATIONAL DATA
6.1.2 SURGING NUMBER OF SMALL AND MEDIUM-SIZED ENTERPRISES
6.1.3 GROWING TECHNOLOGICAL ADVANCEMENTS IN ANALYTICAL TOOLS
6.1.4 RISE IN NEED FOR BUSINESS AGILITY AND COORDINATION
6.2 RESTRAINTS
6.2.1 HIGH CHANCES OF EMERGENCY FOR APPLICATION CONTAINER SPRAWL
6.2.2 UNRELIABLE INFRASTRUCTURE IN DEVELOPING COUNTRIES
6.3 OPPORTUNITIES
6.3.1 RISING ADOPTION OF CLOUD-BASED TECHNOLOGY
6.3.2 RISING CONTAINER MANAGEMENT TRENDS
6.3.3 UPSURGE IN THE ADOPTION OF SOFTWARE ALGORITHMS
6.4 CHALLENGES
6.4.1 LACK OF SKILLED WORKFORCE AND TECHNOLOGICAL EXPERTISE
6.4.2 LACK OF SECURITY CONCERNS
7 NORTH AMERICA APPLICATION CONTAINER MARKET, BY OFFERING
7.1 OVERVIEW
7.2 CONTAINER DATA MANAGEMENT & ORCHESTRATION
7.3 CONTAINER MONITORING & SECURITY
7.4 CONTAINER NETWORKING
7.5 CONSULTATION
7.6 OTHERS
8 NORTH AMERICA APPLICATION CONTAINER MARKET, BY DEPLOYMENT MODE
8.1 OVERVIEW
8.2 PUBLIC CLOUD
8.3 PRIVATE CLOUD/ON PREMISE
8.4 HYBRID CLOUD
9 NORTH AMERICA APPLICATION CONTAINER MARKET, BY ENTERPRISE SIZE
9.1 OVERVIEW
9.2 LARGE ENTERPRISE
9.3 MEDIUM ENTERPRISE
9.4 SMALL ENTERPRISE
10 NORTH AMERICA APPLICATION CONTAINER MARKET, BY APPLICATION
10.1 OVERVIEW
10.2 COLLABORATION
10.3 MODERNIZATION
10.4 PRODUCTION
10.5 OTHERS
11 NORTH AMERICA APPLICATION CONTAINER MARKET, BY VERTICAL
11.1 OVERVIEW
11.2 IT & TELECOMMUNICATION
11.2.1 CONTAINER DATA MANAGEMENT & ORCHESTRATION
11.2.2 CONTAINER MONITORING & SECURITY
11.2.3 CONTAINER NETWORKING
11.2.4 CONSULTATION
11.2.5 OTHERS
11.3 BFSI
11.3.1 CONTAINER DATA MANAGEMENT & ORCHESTRATION
11.3.2 CONTAINER MONITORING & SECURITY
11.3.3 CONTAINER NETWORKING
11.3.4 CONSULTATION
11.3.5 OTHERS
11.4 RETAIL & E-COMMERCE
11.4.1 CONTAINER DATA MANAGEMENT & ORCHESTRATION
11.4.2 CONTAINER MONITORING & SECURITY
11.4.3 CONTAINER NETWORKING
11.4.4 CONSULTATION
11.4.5 OTHERS
11.5 HEALTHCARE & LIFESCIENCES
11.5.1 CONTAINER DATA MANAGEMENT & ORCHESTRATION
11.5.2 CONTAINER MONITORING & SECURITY
11.5.3 CONTAINER NETWORKING
11.5.4 CONSULTATION
11.5.5 OTHERS
11.6 EDUCATION
11.6.1 CONTAINER DATA MANAGEMENT & ORCHESTRATION
11.6.2 CONTAINER MONITORING & SECURITY
11.6.3 CONTAINER NETWORKING
11.6.4 CONSULTATION
11.6.5 OTHERS
11.7 MEDIA & ENTERTAINMENT
11.7.1 CONTAINER DATA MANAGEMENT & ORCHESTRATION
11.7.2 CONTAINER MONITORING & SECURITY
11.7.3 CONTAINER NETWORKING
11.7.4 CONSULTATION
11.7.5 OTHERS
11.8 OTHERS
11.8.1 CONTAINER DATA MANAGEMENT & ORCHESTRATION
11.8.2 CONTAINER MONITORING & SECURITY
11.8.3 CONTAINER NETWORKING
11.8.4 CONSULTATION
11.8.5 OTHERS
12 NORTH AMERICA APPLICATION CONTAINER MARKET, BY REGION
12.1 NORTH AMERICA
12.1.1 U.S.
12.1.2 CANADA
12.1.3 MEXICO
13 NORTH AMERICA APPLICATION CONTAINER MARKET: COMPANY LANDSCAPE
13.1 COMPANY SHARE ANALYSIS: NORTH AMERICA
14 SWOT ANALYSIS
15 COMPANY PROFILE
15.1 AMAZON WEB SERVICES, INC. (A SUBSIDIARY OF AMAZON.COM, INC.)
15.1.1 COMPANY SNAPSHOT
15.1.2 REVENUE ANALYSIS
15.1.3 COMPANY SHARE ANALYSIS
15.1.4 SERVICE PORTFOLIO
15.1.5 RECENT DEVELOPMENTS
15.2 GOOGLE LLC (A SUBSIDIARY OF ALPHABET INC.)
15.2.1 COMPANY SNAPSHOT
15.2.2 REVENUE ANALYSIS
15.2.3 COMPANY SHARE ANALYSIS
15.2.4 PRODUCT PORTFOLIO
15.2.5 RECENT DEVELOPMENTS
15.3 MICROSOFT
15.3.1 COMPANY SNAPSHOT
15.3.2 REVENUE ANALYSIS
15.3.3 COMPANY SHARE ANALYSIS
15.3.4 SERVICE PORTFOLIO
15.3.5 RECENT DEVELOPMENTS
15.4 PALO ALTO NETWORKS.
15.4.1 COMPANY SNAPSHOT
15.4.2 REVENUE ANALYSIS
15.4.3 COMPANY SHARE ANALYSIS
15.4.4 PRODUCT PORTFOLIO
15.4.5 RECENT DEVELOPMENTS
15.5 SUSE
15.5.1 COMPANY SNAPSHOT
15.5.2 REVENUE ANALYSIS
15.5.3 COMPANY SHARE ANALYSIS
15.5.4 SERVICE PORTFOLIO
15.5.5 RECENT DEVELOPMENTS
15.6 ALIBABA GROUP HOLDING LIMITED
15.6.1 COMPANY SNAPSHOT
15.6.2 REVENUE ANALYSIS
15.6.3 SERVICE PORTFOLIO
15.6.4 RECENT DEVELOPMENTS
15.7 ATOS SE
15.7.1 COMPANY SNAPSHOT
15.7.2 REVENUE ANALYSIS
15.7.3 SERVICE PORTFOLIO
15.7.4 RECENT DEVELOPMENTS
15.8 BROADCOM
15.8.1 COMPANY SNAPSHOT
15.8.2 REVENUE ANALYSIS
15.8.3 SERVICE PORTFOLIO
15.8.4 RECENT DEVELOPMENTS
15.9 CISCO SYSTEMS, INC.
15.9.1 COMPANY SNAPSHOT
15.9.2 REVENUE ANALYSIS
15.9.3 SERVICE PORTFOLIO
15.9.4 RECENT DEVELOPMENTS
15.1 D2IQ, INC.
15.10.1 COMPANY SNAPSHOT
15.10.2 SERVICE PORTFOLIO
15.10.3 RECENT DEVELOPMENTS
15.11 DOCKER INC.
15.11.1 COMPANY SNAPSHOT
15.11.2 SERVICE PORTFOLIO
15.11.3 RECENT DEVELOPMENTS
15.12 HEWLETT PACKARD ENTERPRISE DEVELOPMENT LP
15.12.1 COMPANY SNAPSHOT
15.12.2 REVENUE ANALYSIS
15.12.3 PRODUCT PORTFOLIO
15.12.4 RECENT DEVELOPMENTS
15.13 IBM CORPORATION
15.13.1 COMPANY SNAPSHOT
15.13.2 REVENUE ANALYSIS
15.13.3 SERVICE PORTFOLIO
15.13.4 RECENT DEVELOPMENTS
15.14 JOYENT (ACQUIRED BY SAMSUNG)
15.14.1 COMPANY SNAPSHOT
15.14.2 SERVICE PORTFOLIO
15.14.3 RECENT DEVELOPMENTS
15.15 MIRANTIS, INC.
15.15.1 COMPANY SNAPSHOT
15.15.2 SERVICE PORTFOLIO
15.15.3 RECENT DEVELOPMENTS
15.16 ORACLE
15.16.1 COMPANY SNAPSHOT
15.16.2 REVENUE ANALYSIS
15.16.3 SERVICE PORTFOLIO
15.16.4 RECENT DEVELOPMENTS
15.17 PORTAINER
15.17.1 COMPANY SNAPSHOT
15.17.2 SERVICE PORTFOLIO
15.17.3 RECENT DEVELOPMENTS
15.18 PORTWORX
15.18.1 COMPANY SNAPSHOT
15.18.2 SERVICE PORTFOLIO
15.18.3 RECENT DEVELOPMENTS
15.19 PUPPET, INC. (ACQUIRED BY PREFORCE)
15.19.1 COMPANY SNAPSHOT
15.19.2 SERVICE PORTFOLIO
15.19.3 RECENT DEVELOPMENTS
15.2 TELEFONAKTIEBOLAGET LM ERICSSON
15.20.1 COMPANY SNAPSHOT
15.20.2 REVENUE ANALYSIS
15.20.3 SERVICE PORTFOLIO
15.20.4 RECENT DEVELOPMENTS
15.21 VIRTUOZZO
15.21.1 COMPANY SNAPSHOT
15.21.2 SERVICE PORTFOLIO
15.21.3 RECENT DEVELOPMENTS
15.22 VMWARE, INC.
15.22.1 COMPANY SNAPSHOT
15.22.2 REVENUE ANALYSIS
15.22.3 SERVICE PORTFOLIO
15.22.4 RECENT DEVELOPMENTS
15.23 WEAVEWORKS
15.23.1 COMPANY SNAPSHOT
15.23.2 SERVICE PORTFOLIO
15.23.3 RECENT DEVELOPMENTS
16 QUESTIONNAIRE
17 RELATED REPORTS
표 목록
TABLE 1 THE GIVEN TOP 5 COMPANIES' BRAND ANALYSIS ARE
TABLE 2 NORTH AMERICA APPLICATION CONTAINER MARKET, BY OFFERING, 2021-2030 (USD THOUSAND)
TABLE 3 NORTH AMERICA CONTAINER DATA MANAGEMENT & ORCHESTRATION IN APPLICATION CONTAINER MARKET, BY REGION, 2021-2030 (USD THOUSAND)
TABLE 4 NORTH AMERICA CONTAINER MONITORING & SECURITY IN APPLICATION CONTAINER MARKET, BY REGION, 2021-2030 (USD THOUSAND)
TABLE 5 NORTH AMERICA CONTAINER NETWORKING IN APPLICATION CONTAINER MARKET, BY REGION, 2021-2030 (USD THOUSAND)
TABLE 6 NORTH AMERICA CONSULTATION IN APPLICATION CONTAINER MARKET, BY REGION, 2021-2030 (USD THOUSAND)
TABLE 7 NORTH AMERICA OTHERS IN APPLICATION CONTAINER MARKET, BY REGION, 2021-2030 (USD THOUSAND)
TABLE 8 NORTH AMERICA APPLICATION CONTAINER MARKET, BY DEPLOYMENT MODE, 2021-2030 (USD THOUSAND)
TABLE 9 NORTH AMERICA PUBLIC CLOUD IN APPLICATION CONTAINER MARKET, BY REGION, 2021-2030 (USD THOUSAND)
TABLE 10 NORTH AMERICA PRIVATE CLOUD/ON PREMISE IN APPLICATION CONTAINER MARKET, BY REGION, 2021-2030 (USD THOUSAND)
TABLE 11 NORTH AMERICA HYBRID CLOUD IN APPLICATION CONTAINER MARKET, BY REGION, 2021-2030 (USD THOUSAND)
TABLE 12 NORTH AMERICA APPLICATION CONTAINER MARKET, BY ENTERPRISE SIZE, 2021-2030 (USD THOUSAND)
TABLE 13 NORTH AMERICA LARGE ENTERPRISE IN APPLICATION CONTAINER MARKET, BY REGION, 2021-2030 (USD THOUSAND)
TABLE 14 NORTH AMERICA MEDIUM ENTERPRISE IN APPLICATION CONTAINER MARKET, BY REGION, 2021-2030 (USD THOUSAND)
TABLE 15 NORTH AMERICA SMALL ENTERPRISE IN APPLICATION CONTAINER MARKET, BY REGION, 2021-2030 (USD THOUSAND)
TABLE 16 NORTH AMERICA APPLICATION CONTAINER MARKET, BY APPLICATION, 2021-2030 (USD THOUSAND)
TABLE 17 NORTH AMERICA COLLABORATION IN APPLICATION CONTAINER MARKET, BY REGION, 2021-2030 (USD THOUSAND)
TABLE 18 NORTH AMERICA MODERNIZATION IN APPLICATION CONTAINER MARKET, BY REGION, 2021-2030 (USD THOUSAND)
TABLE 19 NORTH AMERICA PRODUCTION IN APPLICATION CONTAINER MARKET, BY REGION, 2021-2030 (USD THOUSAND)
TABLE 20 NORTH AMERICA OTHERS IN APPLICATION CONTAINER MARKET, BY REGION, 2021-2030 (USD THOUSAND)
TABLE 21 NORTH AMERICA APPLICATION CONTAINER MARKET, BY VERTICAL, 2021-2030 (USD THOUSAND)
TABLE 22 NORTH AMERICA IT & TELECOMMUNICATION IN APPLICATION CONTAINER MARKET, BY REGION, 2021-2030 (USD THOUSAND)
TABLE 23 NORTH AMERICA IT & TELECOMMUNICATION IN APPLICATION CONTAINER MARKET, BY OFFERING, 2021-2030 (USD THOUSAND)
TABLE 24 NORTH AMERICA BFSI IN APPLICATION CONTAINER MARKET, BY REGION, 2021-2030 (USD THOUSAND)
TABLE 25 NORTH AMERICA BFSI IN APPLICATION CONTAINER MARKET, BY OFFERING, 2021-2030 (USD THOUSAND)
TABLE 26 NORTH AMERICA RETAIL & E-COMMERCE IN APPLICATION CONTAINER MARKET, BY REGION, 2021-2030 (USD THOUSAND)
TABLE 27 NORTH AMERICA RETAIL & E-COMMERCE IN APPLICATION CONTAINER MARKET, BY OFFERING, 2021-2030 (USD THOUSAND)
TABLE 28 NORTH AMERICA HEALTHCARE & LIFESCIENCES IN APPLICATION CONTAINER MARKET, BY REGION, 2021-2030 (USD THOUSAND)
TABLE 29 NORTH AMERICA HEALTHCARE & LIFESCIENCES IN APPLICATION CONTAINER MARKET, BY OFFERING, 2021-2030 (USD THOUSAND)
TABLE 30 NORTH AMERICA EDUCATION IN APPLICATION CONTAINER MARKET, BY REGION, 2021-2030 (USD THOUSAND)
TABLE 31 NORTH AMERICA EDUCATION IN APPLICATION CONTAINER MARKET, BY OFFERING, 2021-2030 (USD THOUSAND)
TABLE 32 NORTH AMERICA MEDIA & ENTERTAINMENT IN APPLICATION CONTAINER MARKET, BY REGION, 2021-2030 (USD THOUSAND)
TABLE 33 NORTH AMERICA MEDIA & ENTERTAINMENT IN APPLICATION CONTAINER MARKET, BY OFFERING, 2021-2030 (USD THOUSAND)
TABLE 34 NORTH AMERICA OTHERS IN APPLICATION CONTAINER MARKET, BY REGION, 2021-2030 (USD THOUSAND)
TABLE 35 NORTH AMERICA OTHERS IN APPLICATION CONTAINER MARKET, BY OFFERING, 2021-2030 (USD THOUSAND)
TABLE 36 NORTH AMERICA APPLICATION CONTAINER MARKET, BY COUNTRY, 2021-2030 (USD THOUSAND)
TABLE 37 NORTH AMERICA APPLICATION CONTAINER MARKET, BY OFFERING, 2021-2030 (USD THOUSAND)
TABLE 38 NORTH AMERICA APPLICATION CONTAINER MARKET, BY DEPLOYMENT MODE, 2021-2030 (USD THOUSAND)
TABLE 39 NORTH AMERICA APPLICATION CONTAINER MARKET, BY ENTERPRISE SIZE, 2021-2030 (USD THOUSAND)
TABLE 40 NORTH AMERICA APPLICATION CONTAINER MARKET, BY APPLICATION, 2021-2030 (USD THOUSAND)
TABLE 41 NORTH AMERICA APPLICATION CONTAINER MARKET, BY VERTICAL, 2021-2030 (USD THOUSAND)
TABLE 42 NORTH AMERICA IT & TELECOMMUNICATION IN APPLICATION CONTAINER MARKET, BY OFFERING, 2021-2030 (USD THOUSAND)
TABLE 43 NORTH AMERICA BFSI IN APPLICATION CONTAINER MARKET, BY OFFERING, 2021-2030 (USD THOUSAND)
TABLE 44 NORTH AMERICA RETAIL & E-COMMERCE IN APPLICATION CONTAINER MARKET, BY OFFERING, 2021-2030 (USD THOUSAND)
TABLE 45 NORTH AMERICA HEALTHCARE & LIFESCIENCES IN APPLICATION CONTAINER MARKET, BY OFFERING, 2021-2030 (USD THOUSAND)
TABLE 46 NORTH AMERICA EDUCATION IN APPLICATION CONTAINER MARKET, BY OFFERING, 2021-2030 (USD THOUSAND)
TABLE 47 NORTH AMERICA MEDIA & ENTERTAINMENT IN APPLICATION CONTAINER MARKET, BY OFFERING, 2021-2030 (USD THOUSAND)
TABLE 48 NORTH AMERICA OTHERS IN APPLICATION CONTAINER MARKET, BY OFFERING, 2021-2030 (USD THOUSAND)
TABLE 49 U.S. APPLICATION CONTAINER MARKET, BY OFFERING, 2021-2030 (USD THOUSAND)
TABLE 50 U.S. APPLICATION CONTAINER MARKET, BY DEPLOYMENT MODE, 2021-2030 (USD THOUSAND)
TABLE 51 U.S. APPLICATION CONTAINER MARKET, BY ENTERPRISE SIZE, 2021-2030 (USD THOUSAND)
TABLE 52 U.S. APPLICATION CONTAINER MARKET, BY APPLICATION, 2021-2030 (USD THOUSAND)
TABLE 53 U.S. APPLICATION CONTAINER MARKET, BY VERTICAL, 2021-2030 (USD THOUSAND)
TABLE 54 U.S. IT & TELECOMMUNICATION IN APPLICATION CONTAINER MARKET, BY OFFERING, 2021-2030 (USD THOUSAND)
TABLE 55 U.S. BFSI IN APPLICATION CONTAINER MARKET, BY OFFERING, 2021-2030 (USD THOUSAND)
TABLE 56 U.S. RETAIL & E-COMMERCE IN APPLICATION CONTAINER MARKET, BY OFFERING, 2021-2030 (USD THOUSAND)
TABLE 57 U.S. HEALTHCARE & LIFESCIENCES IN APPLICATION CONTAINER MARKET, BY OFFERING, 2021-2030 (USD THOUSAND)
TABLE 58 U.S. EDUCATION IN APPLICATION CONTAINER MARKET, BY OFFERING, 2021-2030 (USD THOUSAND)
TABLE 59 U.S. MEDIA & ENTERTAINMENT IN APPLICATION CONTAINER MARKET, BY OFFERING, 2021-2030 (USD THOUSAND)
TABLE 60 U.S. OTHERS IN APPLICATION CONTAINER MARKET, BY OFFERING, 2021-2030 (USD THOUSAND)
TABLE 61 CANADA APPLICATION CONTAINER MARKET, BY OFFERING, 2021-2030 (USD THOUSAND)
TABLE 62 CANADA APPLICATION CONTAINER MARKET, BY DEPLOYMENT MODE, 2021-2030 (USD THOUSAND)
TABLE 63 CANADA APPLICATION CONTAINER MARKET, BY ENTERPRISE SIZE, 2021-2030 (USD THOUSAND)
TABLE 64 CANADA APPLICATION CONTAINER MARKET, BY APPLICATION, 2021-2030 (USD THOUSAND)
TABLE 65 CANADA APPLICATION CONTAINER MARKET, BY VERTICAL, 2021-2030 (USD THOUSAND)
TABLE 66 CANADA IT & TELECOMMUNICATION IN APPLICATION CONTAINER MARKET, BY OFFERING, 2021-2030 (USD THOUSAND)
TABLE 67 CANADA BFSI IN APPLICATION CONTAINER MARKET, BY OFFERING, 2021-2030 (USD THOUSAND)
TABLE 68 CANADA RETAIL & E-COMMERCE IN APPLICATION CONTAINER MARKET, BY OFFERING, 2021-2030 (USD THOUSAND)
TABLE 69 CANADA HEALTHCARE & LIFESCIENCES IN APPLICATION CONTAINER MARKET, BY OFFERING, 2021-2030 (USD THOUSAND)
TABLE 70 CANADA EDUCATION IN APPLICATION CONTAINER MARKET, BY OFFERING, 2021-2030 (USD THOUSAND)
TABLE 71 CANADA MEDIA & ENTERTAINMENT IN APPLICATION CONTAINER MARKET, BY OFFERING, 2021-2030 (USD THOUSAND)
TABLE 72 CANADA OTHERS IN APPLICATION CONTAINER MARKET, BY OFFERING, 2021-2030 (USD THOUSAND)
TABLE 73 MEXICO APPLICATION CONTAINER MARKET, BY OFFERING, 2021-2030 (USD THOUSAND)
TABLE 74 MEXICO APPLICATION CONTAINER MARKET, BY DEPLOYMENT MODE, 2021-2030 (USD THOUSAND)
TABLE 75 MEXICO APPLICATION CONTAINER MARKET, BY ENTERPRISE SIZE, 2021-2030 (USD THOUSAND)
TABLE 76 MEXICO APPLICATION CONTAINER MARKET, BY APPLICATION, 2021-2030 (USD THOUSAND)
TABLE 77 MEXICO APPLICATION CONTAINER MARKET, BY VERTICAL, 2021-2030 (USD THOUSAND)
TABLE 78 MEXICO IT & TELECOMMUNICATION IN APPLICATION CONTAINER MARKET, BY OFFERING, 2021-2030 (USD THOUSAND)
TABLE 79 MEXICO BFSI IN APPLICATION CONTAINER MARKET, BY OFFERING, 2021-2030 (USD THOUSAND)
TABLE 80 MEXICO RETAIL & E-COMMERCE IN APPLICATION CONTAINER MARKET, BY OFFERING, 2021-2030 (USD THOUSAND)
TABLE 81 MEXICO HEALTHCARE & LIFESCIENCES IN APPLICATION CONTAINER MARKET, BY OFFERING, 2021-2030 (USD THOUSAND)
TABLE 82 MEXICO EDUCATION IN APPLICATION CONTAINER MARKET, BY OFFERING, 2021-2030 (USD THOUSAND)
TABLE 83 MEXICO MEDIA & ENTERTAINMENT IN APPLICATION CONTAINER MARKET, BY OFFERING, 2021-2030 (USD THOUSAND)
TABLE 84 MEXICO OTHERS IN APPLICATION CONTAINER MARKET, BY OFFERING, 2021-2030 (USD THOUSAND)
그림 목록
FIGURE 1 NORTH AMERICA APPLICATION CONTAINER MARKET: SEGMENTATION
FIGURE 2 NORTH AMERICA APPLICATION CONTAINER MARKET: DATA TRIANGULATION
FIGURE 3 NORTH AMERICA APPLICATION CONTAINER MARKET: DROC ANALYSIS
FIGURE 4 NORTH AMERICA APPLICATION CONTAINER MARKET: NORTH AMERICA VS REGIONAL MARKET ANALYSIS
FIGURE 5 NORTH AMERICA APPLICATION CONTAINER MARKET: COMPANY RESEARCH ANALYSIS
FIGURE 6 NORTH AMERICA APPLICATION CONTAINER MARKET: INTERVIEW DEMOGRAPHICS
FIGURE 7 NORTH AMERICA APPLICATION CONTAINER MARKET: DBMR MARKET POSITION GRID
FIGURE 8 NORTH AMERICA APPLICATION CONTAINER MARKET: VENDOR SHARE ANALYSIS
FIGURE 9 NORTH AMERICA APPLICATION CONTAINER MARKET: MULTIVARIATE MODELING
FIGURE 10 NORTH AMERICA APPLICATION CONTAINER MARKET: OFFERING TIMELINE CURVE
FIGURE 11 NORTH AMERICA APPLICATION CONTAINER MARKET: MARKET APPLICATION COVERAGE GRID
FIGURE 12 NORTH AMERICA APPLICATION CONTAINER MARKET: SEGMENTATION
FIGURE 13 SURGING NUMBER OF SMALL AND MEDIUM-SIZED ENTERPRISES IS BOOSTING THE GROWTH OF THE NORTH AMERICA APPLICATION CONTAINER MARKET IN THE FORECAST PERIOD OF 2023 TO 2030
FIGURE 14 CONTAINER DATA MANAGEMENT & ORCHESTRATION SEGMENT IS EXPECTED TO ACCOUNT FOR THE LARGEST SHARE OF THE NORTH AMERICA APPLICATION CONTAINER MARKET IN THE FORECAST PERIOD OF 2023 TO 2030
FIGURE 15 CONTAINER ECOSYSTEM MARKET MAP
FIGURE 16 DRIVERS, RESTRAINTS, OPPORTUNITIES, AND CHALLENGES OF THE NORTH AMERICA APPLICATION CONTAINER MARKET
FIGURE 17 VOLUME OF DATA CULTURE IN ORGANIZATION ACROSS WORLDWIDE
FIGURE 18 REGISTERED MSME’S IN INDIA IN FY 2022
FIGURE 19 CHANGES IN VARIOUS AGILITY FACTORS FOR ORGANIZATION
FIGURE 20 RATE OF ADOPTION OF PUBLIC CLOUD FOR BUSINESS OPERATIONS
FIGURE 21 AI ADOPTION RATES AROUND THE GLOBE
FIGURE 22 NORTH AMERICA APPLICATION CONTAINER MARKET, BY OFFERING, 2022
FIGURE 23 NORTH AMERICA APPLICATION CONTAINER MARKET, BY DEPLOYMENT MODE, 2022
FIGURE 24 NORTH AMERICA APPLICATION CONTAINER MARKET, BY ENTERPRISE SIZE, 2022
FIGURE 25 NORTH AMERICA APPLICATION CONTAINER MARKET: BY APPLICATION, 2022
FIGURE 26 NORTH AMERICA APPLICATION CONTAINER MARKET: BY VERTICAL, 2022
FIGURE 27 NORTH AMERICA APPLICATION CONTAINER MARKET: SNAPSHOT (2022)
FIGURE 28 NORTH AMERICA APPLICATION CONTAINER MARKET: BY COUNTRY (2022)
FIGURE 29 NORTH AMERICA APPLICATION CONTAINER MARKET: BY COUNTRY (2023 & 2030)
FIGURE 30 NORTH AMERICA APPLICATION CONTAINER MARKET: BY COUNTRY (2022 & 2030)
FIGURE 31 NORTH AMERICA APPLICATION CONTAINER MARKET: BY OFFERING (2023-2030)
FIGURE 32 NORTH AMERICA APPLICATION CONTAINER MARKET: COMPANY SHARE 2022 (%)
연구 방법론
데이터 수집 및 기준 연도 분석은 대규모 샘플 크기의 데이터 수집 모듈을 사용하여 수행됩니다. 이 단계에는 다양한 소스와 전략을 통해 시장 정보 또는 관련 데이터를 얻는 것이 포함됩니다. 여기에는 과거에 수집한 모든 데이터를 미리 검토하고 계획하는 것이 포함됩니다. 또한 다양한 정보 소스에서 발견되는 정보 불일치를 검토하는 것도 포함됩니다. 시장 데이터는 시장 통계 및 일관된 모델을 사용하여 분석하고 추정합니다. 또한 시장 점유율 분석 및 주요 추세 분석은 시장 보고서의 주요 성공 요인입니다. 자세한 내용은 분석가에게 전화를 요청하거나 문의 사항을 드롭하세요.
DBMR 연구팀에서 사용하는 주요 연구 방법론은 데이터 마이닝, 시장에 대한 데이터 변수의 영향 분석 및 주요(산업 전문가) 검증을 포함하는 데이터 삼각 측량입니다. 데이터 모델에는 공급업체 포지셔닝 그리드, 시장 타임라인 분석, 시장 개요 및 가이드, 회사 포지셔닝 그리드, 특허 분석, 가격 분석, 회사 시장 점유율 분석, 측정 기준, 글로벌 대 지역 및 공급업체 점유율 분석이 포함됩니다. 연구 방법론에 대해 자세히 알아보려면 문의를 통해 업계 전문가에게 문의하세요.
사용자 정의 가능
Data Bridge Market Research는 고급 형성 연구 분야의 선두 주자입니다. 저희는 기존 및 신규 고객에게 목표에 맞는 데이터와 분석을 제공하는 데 자부심을 느낍니다. 보고서는 추가 국가에 대한 시장 이해(국가 목록 요청), 임상 시험 결과 데이터, 문헌 검토, 재생 시장 및 제품 기반 분석을 포함하도록 사용자 정의할 수 있습니다. 기술 기반 분석에서 시장 포트폴리오 전략에 이르기까지 타겟 경쟁업체의 시장 분석을 분석할 수 있습니다. 귀하가 원하는 형식과 데이터 스타일로 필요한 만큼 많은 경쟁자를 추가할 수 있습니다. 저희 분석가 팀은 또한 원시 엑셀 파일 피벗 테이블(팩트북)로 데이터를 제공하거나 보고서에서 사용 가능한 데이터 세트에서 프레젠테이션을 만드는 데 도움을 줄 수 있습니다.

