北米カオリン市場、グレード別(焼成、含水、剥離、表面処理、構造化)、プロセス別(水洗浄、エアフロート、焼成、剥離、表面改質および未処理)、用途別(紙、セラミック、塗料およびコーティング、グラスファイバー、プラスチック、ゴム、医薬品および医療、化粧品、その他)、業界動向および2029年までの予測

北米のカオリン市場の分析と洞察
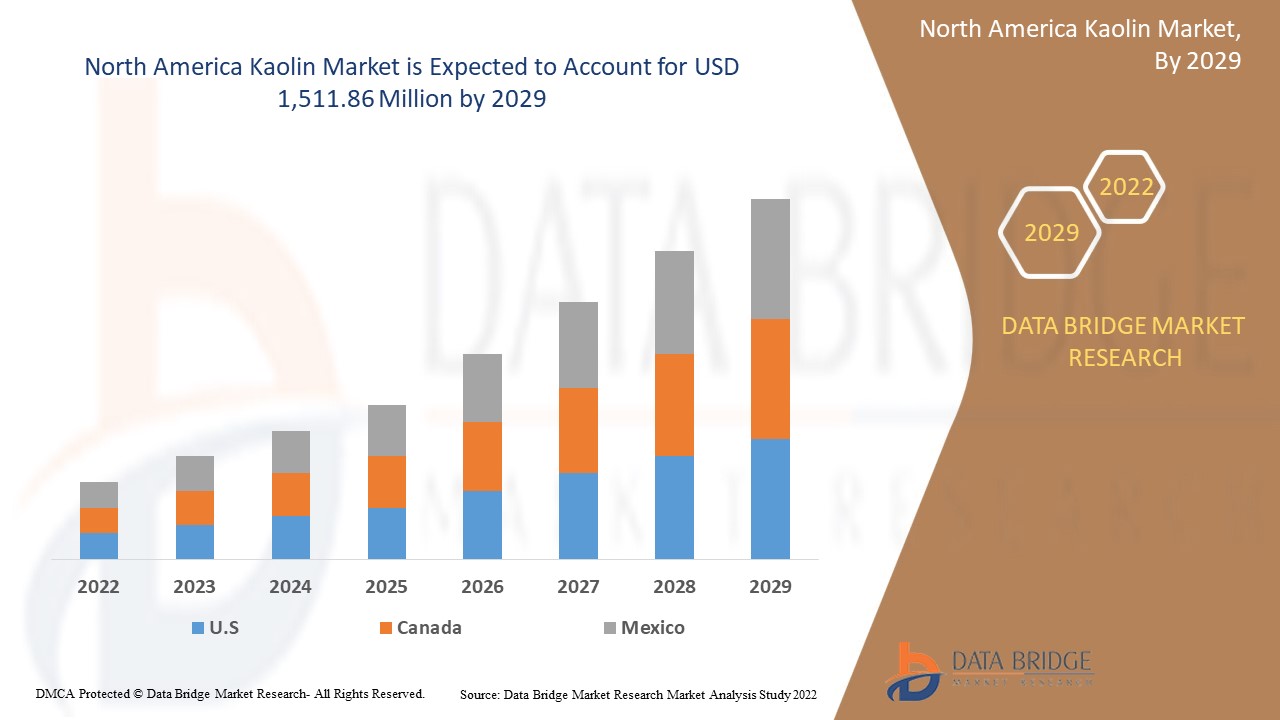
北米のカオリン市場は、2022年から2029年の予測期間に大幅に成長すると予想されています。データブリッジマーケットリサーチは、市場は2022年から2029年の予測期間に4.4%のCAGRで成長し、2029年までに15億1,186万米ドルに達すると分析しています。カオリン市場の成長を牽引する主な要因は、世界中の建設活動の増加、カオリンの好ましい化学的および物理的特性、さまざまな最終用途産業からのカオリン需要の増加、およびコーティング添加剤としてのカオリンの採用率の高さです。


業界では、商業的に重要な医薬品や化粧品の生産のための原料としてカオリンを採用するケースが増えています。さらに、タンパク質、脂質、油を吸着するなどの化学的性質により、洗顔料、顔マスク、泥パック、ボディスクラブ、その他の化粧品の製造にカオリンが使用されるケースが増えています。うがい薬、手術用パッド、乾燥剤、おむつかぶれの一時的保護剤などの医薬品では、その好ましい化学的性質から、カオリンが主要成分として使用されています。したがって、さまざまな用途や業界でカオリンが広く使用されることで、北米のカオリン市場の成長が促進される可能性があります。
北米カオリン市場レポートでは、市場シェア、新開発、国内および現地の市場プレーヤーの影響の詳細を提供し、新たな収益源、市場規制の変更、製品承認、戦略的決定、製品発売、地理的拡大、市場における技術革新の観点から機会を分析します。分析と市場シナリオを理解するには、アナリスト概要についてお問い合わせください。当社のチームは、お客様が希望する目標を達成するための収益影響ソリューションの作成をお手伝いします。
|
レポートメトリック |
詳細 |
|
予測期間 |
2022年から2029年 |
|
基準年 |
2021 |
|
歴史的な年 |
2020 (2019 - 2014 にカスタマイズ可能) |
|
定量単位 |
収益(百万米ドル) |
|
対象セグメント |
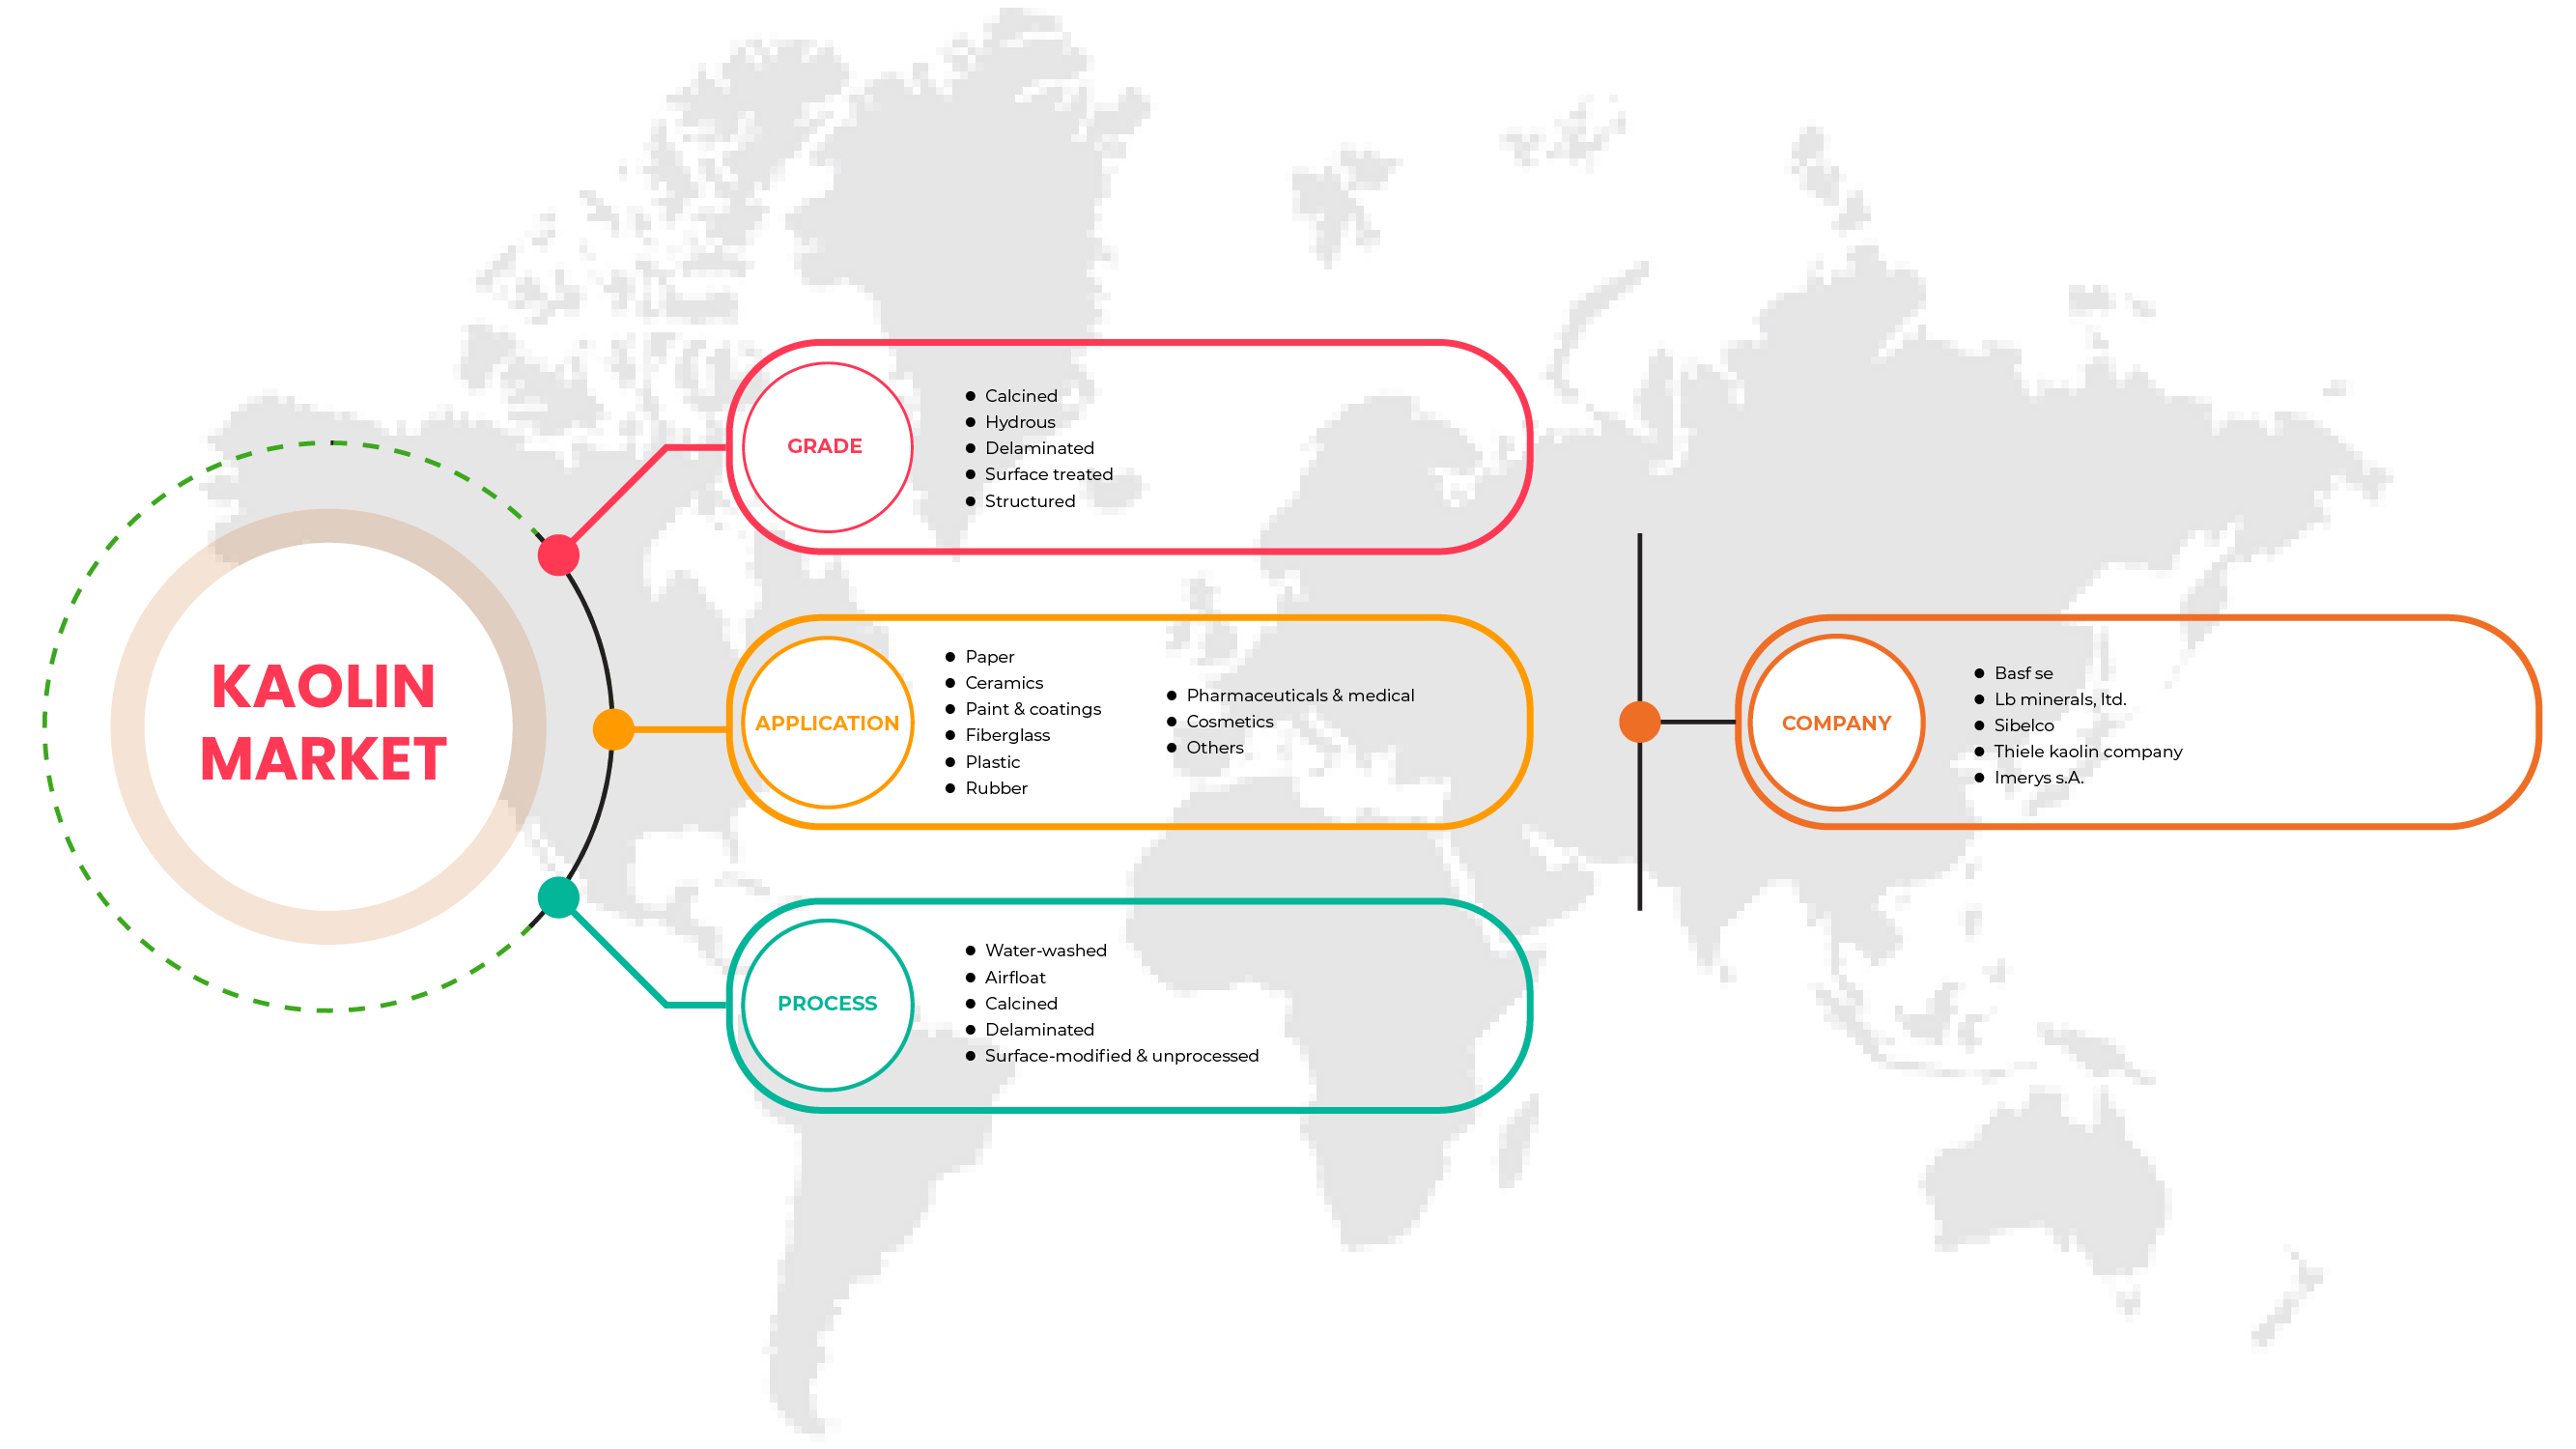
グレード別(焼成、含水、剥離、表面処理、構造化)、プロセス別(水洗浄、エアフロート、焼成、剥離、表面改質および未処理)、用途別(紙、セラミック、塗料およびコーティング、グラスファイバー、プラスチック、ゴム、医薬品および医療、化粧品、その他) |
|
対象国 |
米国、カナダ、メキシコ |
|
対象となる市場プレーヤー |
BASF SE、Imerys SA、SIBELCO、Thiele Kaolin Company、I-Minerals Inc.、KaMin LLC。 / カダム |
市場の定義
カオリンはチャイナ クレイとも呼ばれ、紙、ゴム、化粧品などの製造に必須の成分として使用される柔らかい白土です。カオリンは、紙業界では接着剤とともに充填剤として使用され、紙の外観を改善し、さまざまな光沢、滑らかさ、明るさ、不透明度、印刷適性を与えます。さらに、この製品はインク吸収性、インク顔料の保持性を高め、粗さを増すことで紙の印刷適性を高めます。陶磁器や耐火物の製造にセラミック業界で広く使用されています。カオリンは、ゴム業界で機械的強度と耐摩耗性を向上させます。
北米カオリン市場の動向
このセクションでは、市場の推進要因、制約、機会、課題について理解します。これらについては、以下で詳しく説明します。
ドライバー
- 世界中で建設活動が増加
発展途上国における建設活動の増加は、農村人口の都市部への移住の増加とインフラ開発への投資の増加によって支えられてきました。米国では消費者の関心が木製の床からセラミックタイルへの交換に移りつつあるなど、さまざまな国で住宅リフォームが増えているため、製品需要が高まり、カオリン市場の成長を牽引しています。さらに、北米でも、国内のセラミック生産と消費の増加により、急速な成長が見込まれています。
- カオリンの好ましい化学的および物理的性質
カオリンは、使用時に望ましい好ましい化学的および物理的特性を発揮するため、さまざまな用途および最終用途産業で好まれる金属です。カオリン粘土を使用すると、電気性能、耐久性、強度が向上するため、プラスチック業界ではカオリン粘土の需要が高まっています。さらに、カオリン粘土の不透明性、化学的不活性、非研磨性、および平らな形状により、セラミックの採用が増えています。さらに、カオリン粘土の熱安定性により、コンクリートやモルタルでの使用が増加しています。カオリンのグレードによっては、粒子サイズが細かく、吸着性が高く、懸濁性があります。
- さまざまな最終用途産業からのカオリンの需要増加
カオリンに有利に働く多くの重要な変数と特性、およびカオリンで作られた製品に対する需要の高まりにより、カオリン市場は世界中で着実に成長を続けています。カオリンの最も一般的な用途は製紙分野で、滑らかな質感と適切な不透明度を備えた紙のコーティングとして利用できます。この増加は、包装や印刷などのさまざまな最終用途産業からの紙の需要の増加に起因しています。さらに、この材料は粒子サイズを小さくし、強度を高めるため、ピースの充填やコーティングに広く使用されています。カオリンは、優れたインク受容性、紙の滑らかさ、製紙に最適な不透明度など、さまざまな品質を提供するため、製紙業界で頻繁に使用されています。
- コーティング添加剤としてのカオリンの採用率の高さ
製紙および塗料・コーティング業界は、製品にカオリンを多く使用している業界です。カオリンは、塗料の性能を高めるために使用され、懸濁特性、分散性、耐腐食性、耐水性、粘度の低下などの効果があります。さらに、紙のコーティングで接着剤と組み合わせると、不透明度、色、印刷性を高めるためにコーティング剤や充填剤として使用されます。カオリンは、紙の充填剤やコーティング剤に最も広く使用されている微粒子鉱物です。紙の外観を改善し、光沢、滑らかさ、明るさ、不透明度を高めます。最も重要なのは、印刷性が向上することです。紙には繊維を伸ばすためにカオリンが充填されています。
機会
- 大手企業が実施する主要な戦略的取り組み
北米のカオリン市場は、COVID-19の出現と全国的なロックダウンおよび移動制限により、予想外の悪影響を受けています。そのため、メーカーはさらなる損失を避けるために流動性フローを維持することに重点を置いています。さらに、カオリン市場の主要企業は、主要かつ支配的な市場シェアを獲得し、事業を強化するために、さまざまな戦略的イニシアチブと開発を実施しています。
- カオリンの採掘技術の向上
カオリンの処理技術開発は、本質的には、不要な不純物がすべて除去され、適切なサイズ調整、輝度の向上、表面改質、およびその他の操作によって処理された材料の必要な特性が確保されるように、カオリンを選鉱するための連続フローシートを開発することです。現代のカオリン選鉱方法 (湿式法) では、破砕/磨砕、ブランジング、ふるい分けまたは機械的分級、遠心分離、磁気分離、選択的凝集、フロス浮選、酸化および還元漂白などの技術が使用されます。磨砕/剥離、パギング、焼成、表面改質などの追加技術も、最終製品の特性向上のために採用されています。
制約/課題
- 新型コロナウイルスの出現による製紙業界への悪影響
The COVID-19 outbreak has disrupted kaolin market manufacture and supply, delaying the worldwide industry's expansion. Many kaolin enterprises are employing ways to avoid downtime losses, which are increasingly concerning as the pandemic's effects endure. The performance of kaolin in paper filling applications has been eroded by competition from alternative materials, particularly calcium carbonates. Slow growth in coated paper production will limit advances for kaolin in the future, thus, restraining the development of the North America kaolin market.
- Kaolin mining causes numerous environmental and health hazards
From the environmental point of view, the most significant environmental problem arises because the kaolin extractive operations create surfaces with high susceptibility to runoff and water erosion, with a high potential for on- and off-site environmental effects. Moreover, mining kaolin has long-term negative impacts on the environment, such as environmental and agricultural imbalances, erosion, silting of rivers and lakes, and deforestation. Because of the removal of vegetation for the process of excavation and removal of clay, part of the local soil is unprotected, causing compaction processes in certain situations and leaching. Once the leached soil becomes unsuitable for agriculture, the land used for clay extraction ends up being abandoned by the owners. Therefore, mining kaolin results in the degradation of the environment and human health, which is expected to restrain the growth and development of the North America kaolin market.
- Easy availability of substitutes
Some other easily available substitutes in the market are bentonite clay. Bentonite clay has powerful oil absorption properties and can absorb more than its body mass in water. This makes it an excellent ingredient for people with extremely oily skin and drives its use in cosmetic products. Bentonite clay is composed of montmorillonite, a type of smectite clay. It has high water content and swells when it comes into contact with water. This makes it effective at drawing out impurities from the skin. Another alternative is fuller's earth, which is also used for skin care and detoxification. In addition, rhassoul clay is a clay that is mined in the Atlas Mountains in Morocco. It is rich in minerals, has cleansing and conditioning properties, and is a great alternative to kaolin clay.
- Rise in the price of kaolin
The companies and players operating in the North America kaolin market are focused on increasing kaolin prices to ensure the business's long-term sustainability. These players announced an increase in prices in 2021 for different applications, in which paper was among the key applications. Most companies experienced inflation in various aspects of the business, including inflation in chemicals and freight costs. In addition, the downgrade caused due to the breakout of the pandemic from key application sectors directly impacted the revenue earnings of major market participants.
Recent Development
- In July 2022, Thiele Kaolin Company announced a price increase of 9% for all product categories owing to the current North America economic climate, which has resulted in increased costs to manufacturing operations worldwide. For the company, these cost increases have impacted energy, chemicals, labor, mining, maintenance, and other inputs needed to produce quality products.
- In November 2021, KaMin LLC / CADAM agreed to acquire the kaolin mineral business of BASF SE. The kaolin minerals business is part of BASF's Performance Chemicals division. This greatly strengthens the company's kaolin business across the globe.
North America Kaolin Market Scope
The North America kaolin market is categorized based on grade, process, and application. The growth amongst these segments will help you analyze major growth segments in the industries and provide the users with a valuable market overview and market insights to make strategic decisions to identify core market applications.
Grade
- Calcined
- Hydrous
- Delaminated
- Surface treated
- Structured
Based on grade, the North America kaolin market is classified into five segments namely calcined, hydrous, delaminated, surface treated, and structured.
Process
- Water-washed
- Airfloat
- Calcined
- Delaminated
- Surface-modified & unprocessed
Based on process, the North America kaolin market is classified into five segments water-washed, airfloat, calcined, delaminated, and surface-modified & unprocessed.
Application
- Paper
- Ceramics
- Paint & coatings
- Fiberglass
- Plastic
- Rubber
- Pharmaceuticals & medical
- Cosmetics
- Others

Based on the application, the North America kaolin market is classified into nine segments paper, ceramics, paint & coatings, fiberglass, plastic, rubber, pharmaceuticals & medical, cosmetics, and others.
North America Kaolin Market Regional Analysis/Insights
The North America kaolin market is segmented based on grade, process, and application.
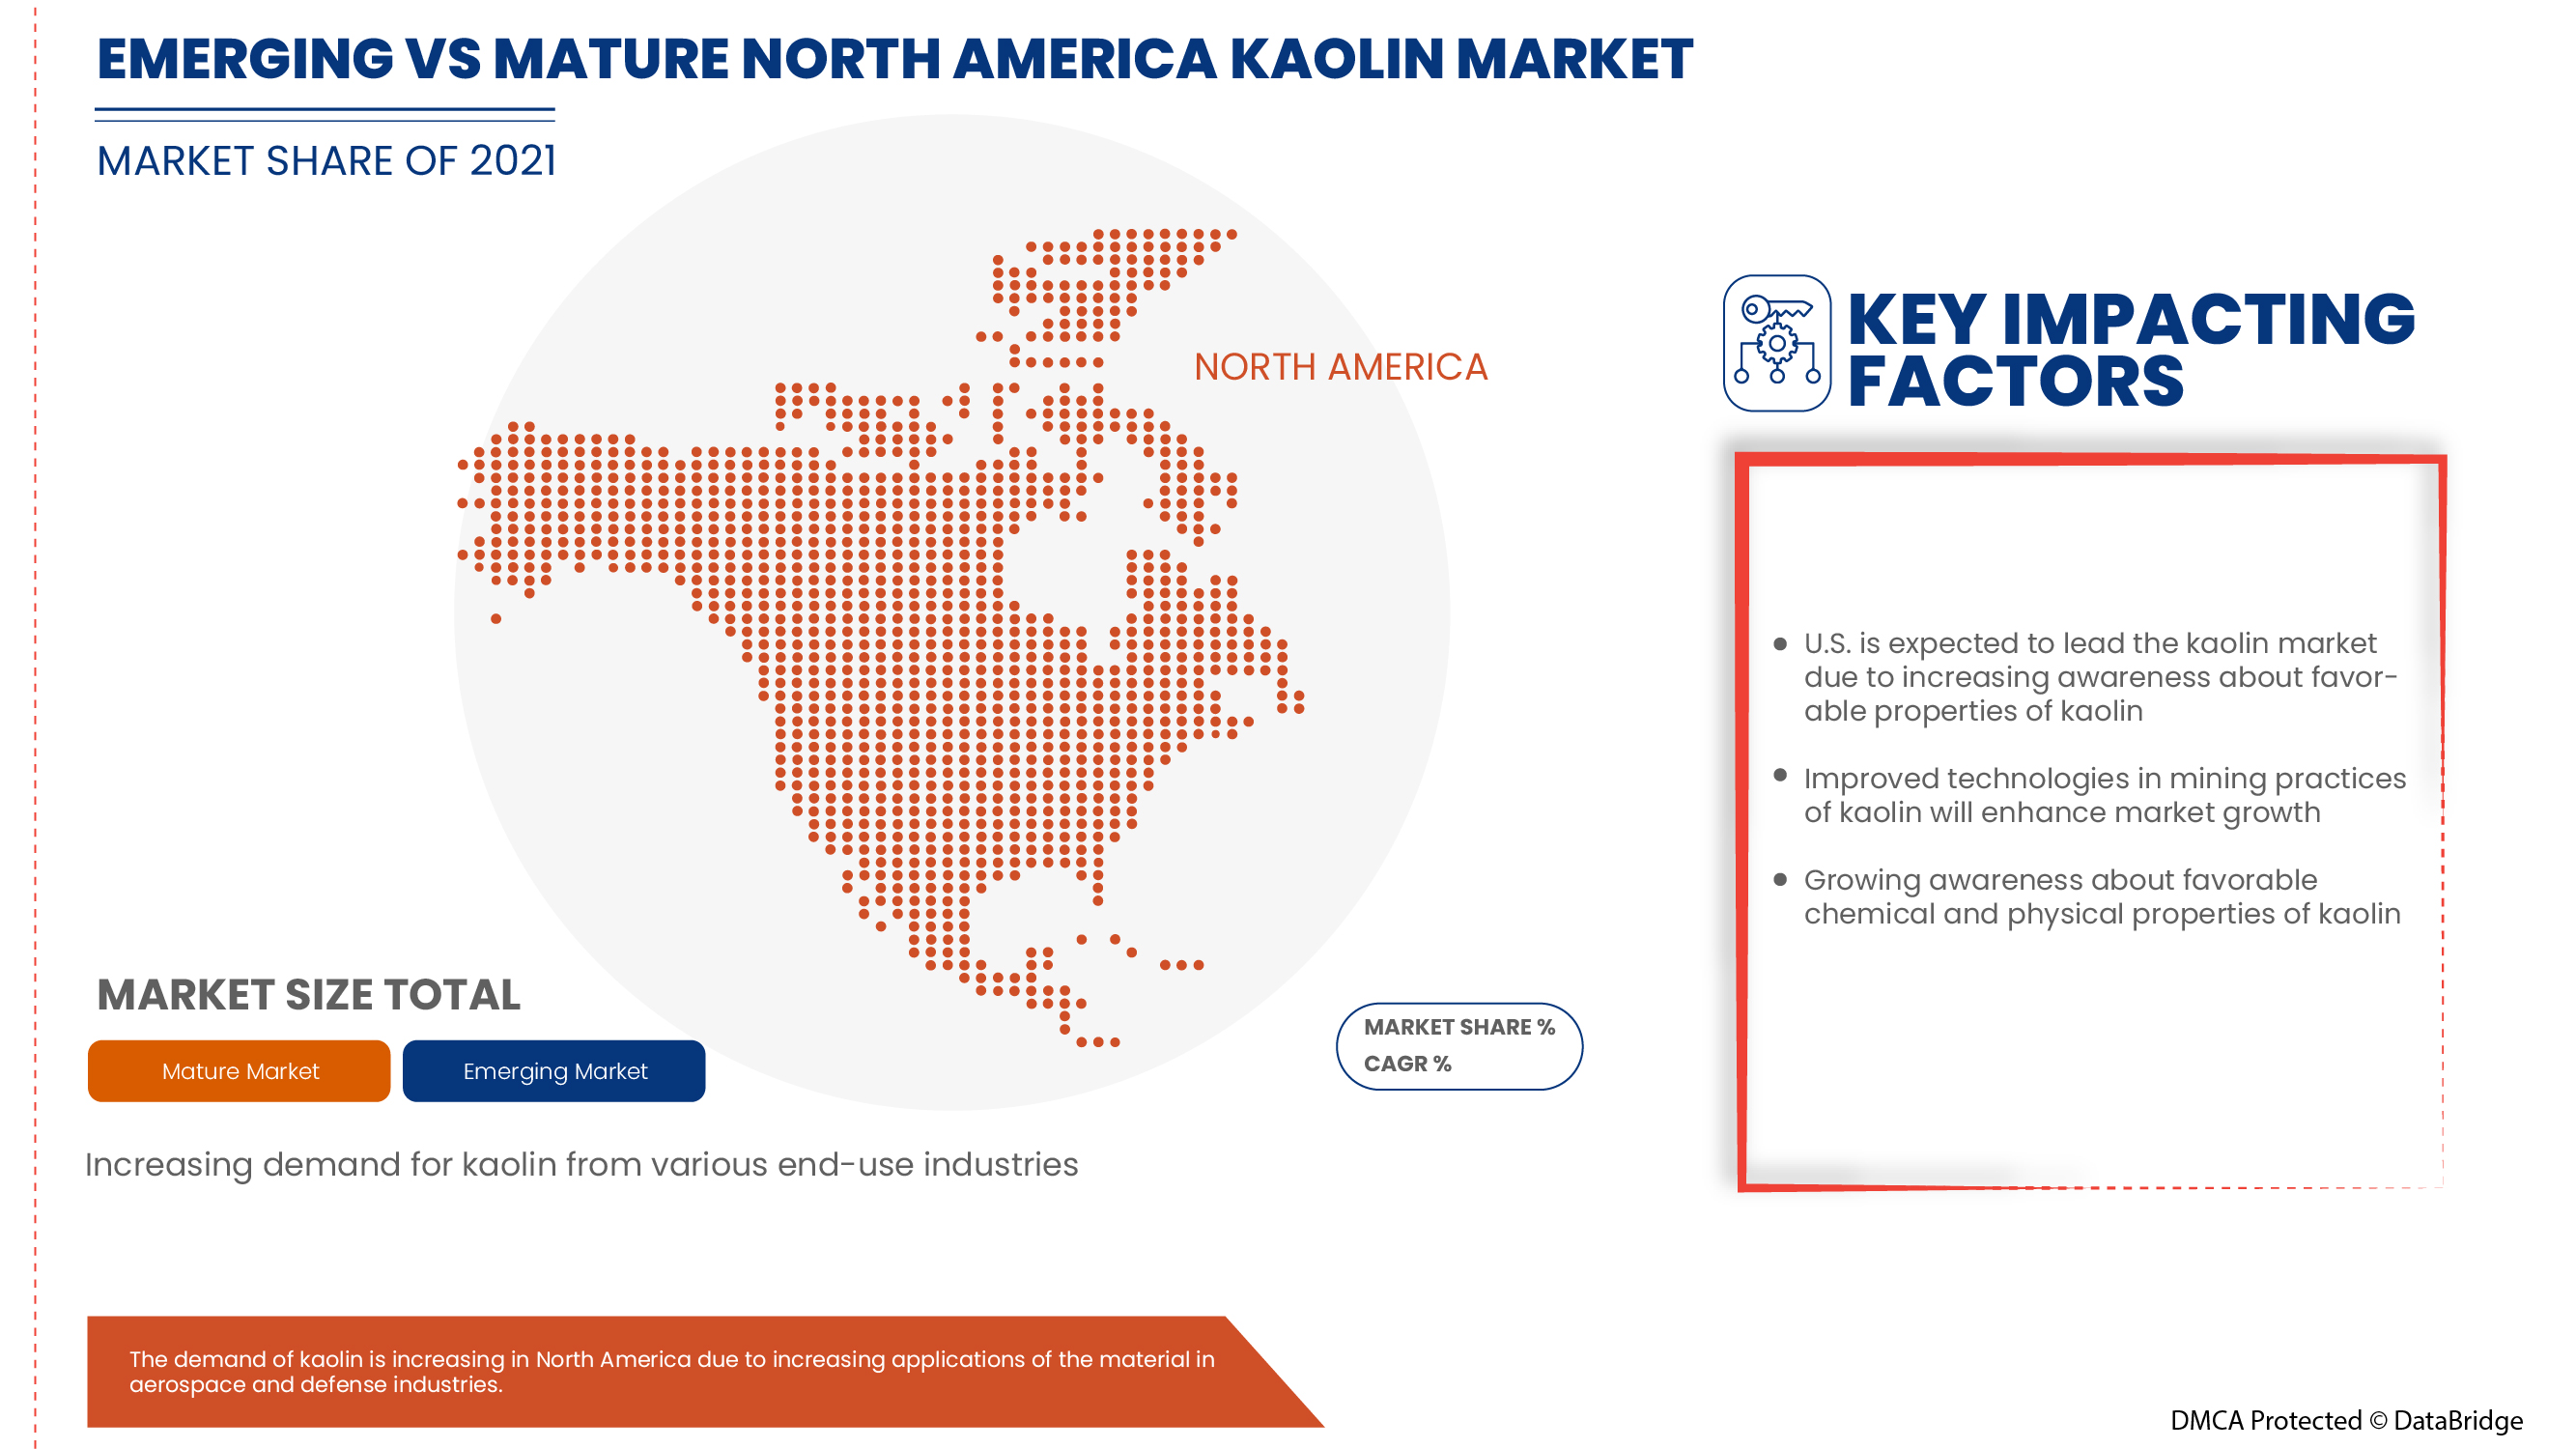
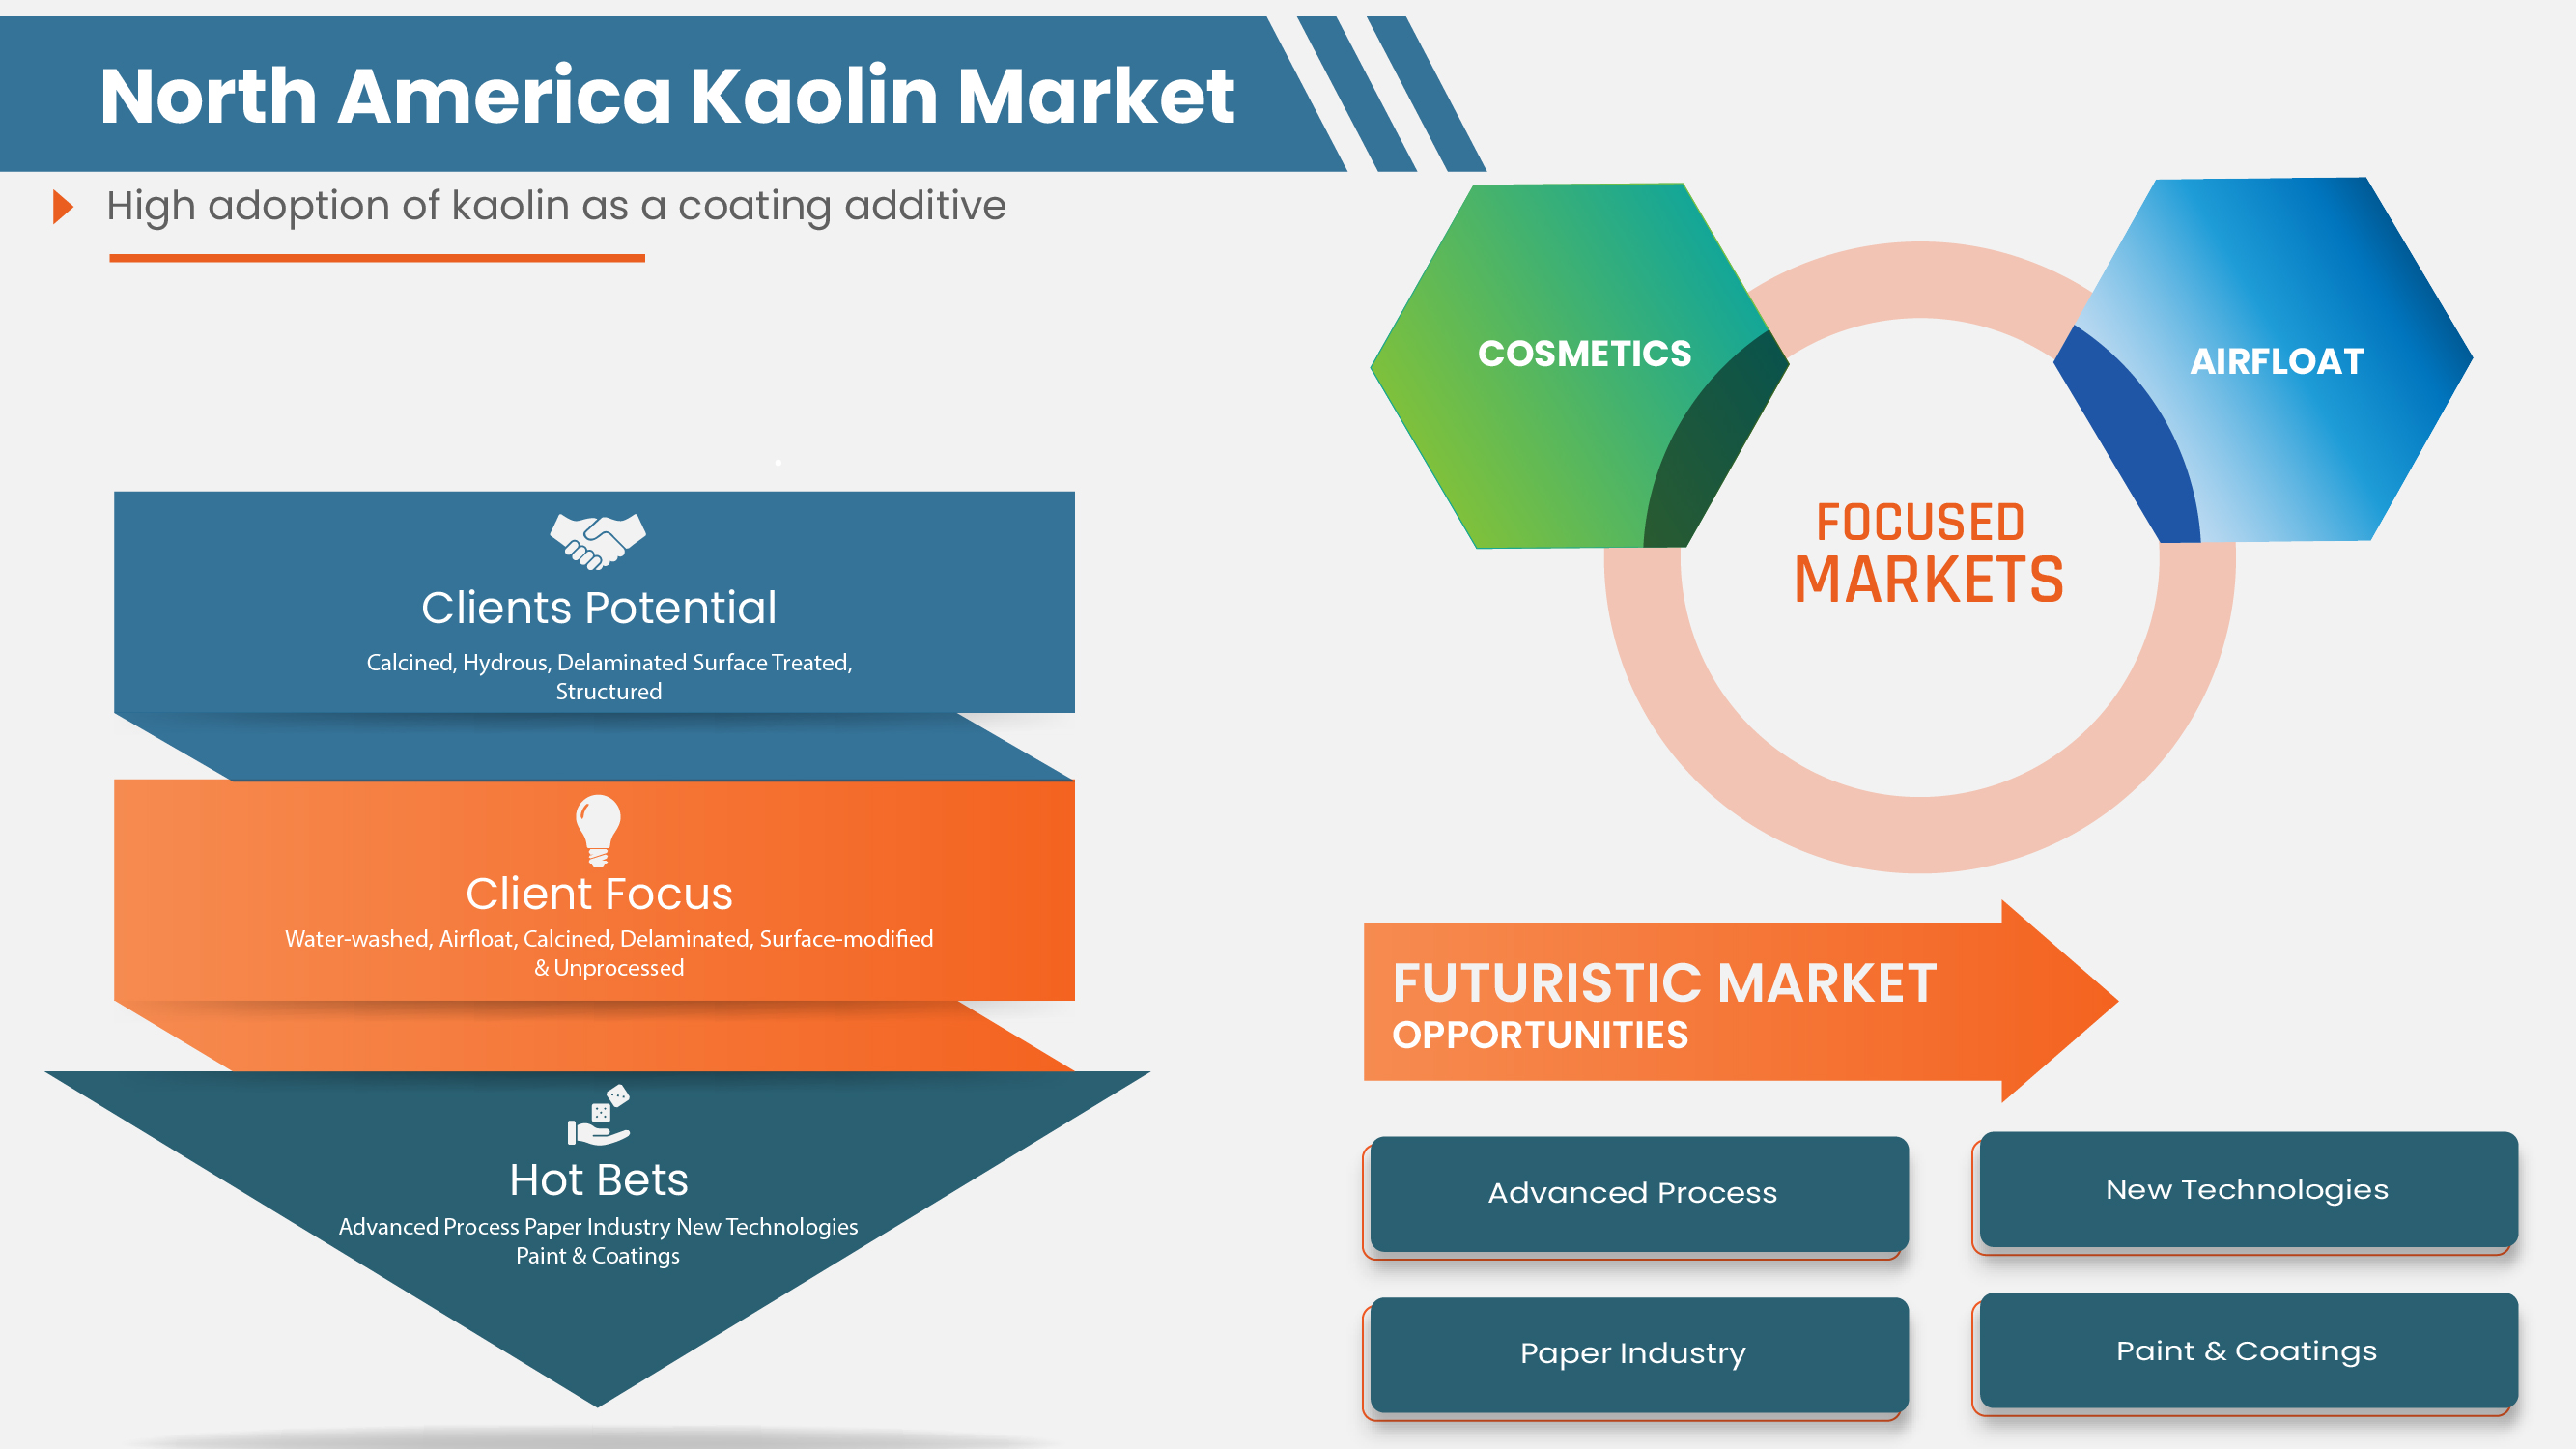
The countries in the North America kaolin market are the U.S., Canada, and Mexico. U.S is dominating the North America kaolin market in terms of market share and market revenue due to the region's high adoption of kaolin as a coating additive.
レポートの国別セクションでは、市場の現在および将来の傾向に影響を与える個別の市場影響要因と市場規制の変更も提供しています。データポイントの下流および上流のバリューチェーン分析、技術動向、ポーターの 5 つの力の分析、およびケーススタディは、個々の国の市場シナリオを予測するために使用されるいくつかの指標です。また、国別データの予測分析を提供する際には、北米ブランドの存在と可用性、および地元および国内ブランドとの競争が激しいか少ないために直面する課題、国内関税の影響、貿易ルートも考慮されます。
競争環境と北米のカオリン市場シェア分析
北米のカオリン市場の競争環境は、競合他社の詳細を提供します。含まれる詳細には、会社概要、会社の財務状況、収益、市場の可能性、研究開発への投資、新しい市場への取り組み、生産拠点と施設、会社の強みと弱み、製品の発売、製品試験パイプライン、製品の承認、特許、製品の幅と広さ、アプリケーションの優位性、技術ライフライン曲線などがあります。提供されている上記のデータ ポイントは、北米のカオリン市場に関連する会社の焦点にのみ関連しています。
北米のカオリン市場で活動している主な企業は次のとおりです。
- BASF SE
- イメリスSA
- シベルコ
- ティーレ・カオリン・カンパニー
- アイミネラルズ株式会社
- カミン合同会社 / CADAM
研究方法
データ収集と基準年分析は、大規模なサンプル サイズのデータ収集モジュールを使用して行われます。市場データは、市場統計モデルとコヒーレント モデルを使用して分析および推定されます。さらに、市場シェア分析と主要トレンド分析は、市場レポートの主要な成功要因です。DBMR 調査チームが使用する主要な調査方法は、データ マイニング、データ変数の市場への影響の分析、および一次 (業界の専門家) 検証を含むデータ三角測量です。データ モデルには、ベンダー ポジショニング グリッド、市場タイムライン分析、市場概要とガイド、企業ポジショニング グリッド、企業市場シェア分析、測定基準、北米と地域、ベンダー シェア分析が含まれます。さらに質問がある場合は、アナリストへの電話をリクエストしてください。
SKU-
世界初のマーケットインテリジェンスクラウドに関するレポートにオンラインでアクセスする
- インタラクティブなデータ分析ダッシュボード
- 成長の可能性が高い機会のための企業分析ダッシュボード
- カスタマイズとクエリのためのリサーチアナリストアクセス
- インタラクティブなダッシュボードによる競合分析
- 最新ニュース、更新情報、トレンド分析
- 包括的な競合追跡のためのベンチマーク分析のパワーを活用
目次
1 INTRODUCTION
1.1 OBJECTIVES OF THE STUDY
1.2 MARKET DEFINITION
1.3 OVERVIEW OF NORTH AMERICA KAOLIN MARKET
1.4 LIMITATIONS
1.5 MARKETS COVERED
2 MARKET SEGMENTATION
2.1 MARKETS COVERED
2.2 GEOGRAPHICAL SCOPE
2.3 YEARS CONSIDERED FOR THE STUDY
2.4 CURRENCY AND PRICING
2.5 DBMR TRIPOD DATA VALIDATION MODEL
2.6 PRODUCT LIFE LINE CURVE
2.7 MULTIVARIATE MODELING
2.8 PRIMARY INTERVIEWS WITH KEY OPINION LEADERS
2.9 DBMR MARKET POSITION GRID
2.1 MARKET APPLICATION COVERAGE GRID
2.11 DBMR MARKET CHALLENGE MATRIX
2.12 DBMR VENDOR SHARE ANALYSIS
2.13 IMPORT-EXPORT DATA
2.14 SECONDARY SOURCES
2.15 ASSUMPTIONS
3 EXECUTIVE SUMMARY
4 PREMIUM INSIGHTS
4.1 PESTLE ANALYSIS
4.1.1 POLITICAL FACTORS
4.1.2 ECONOMIC FACTORS
4.1.3 SOCIAL FACTORS
4.1.4 TECHNOLOGICAL FACTORS
4.1.5 LEGAL FACTORS
4.1.6 ENVIRONMENTAL FACTORS
4.2 PORTER’S FIVE FORCES:
4.2.1 THREAT OF NEW ENTRANTS:
4.2.2 THREAT OF SUBSTITUTES:
4.2.3 CUSTOMER BARGAINING POWER:
4.2.4 SUPPLIER BARGAINING POWER:
4.2.5 INTERNAL COMPETITION (RIVALRY):
4.3 CRITICAL SELECTION CRITERIA FOR BUSINESS DECISION
4.4 IMPORT EXPORT SCENARIO
4.5 MANUFACTURING PROCESS: NORTH AMERICA KAOLIN MARKET
4.6 MARKET CHANGES / CURRENT EVENTS
4.7 PRODUCTION CAPACITY BY MANUFACTURERS: NORTH AMERICA KAOLIN MARKET
4.8 SUPPLY CHAIN ANALYSIS- NORTH AMERICA KAOLIN MARKET
4.8.1 OVERVIEW
4.8.2 LOGISTIC COST SCENARIO
4.8.3 IMPORTANCE OF LOGISTICS SERVICE PROVIDERS
4.9 TECHNOLOGIES OVERVIEW
4.1 VENDOR SELECTION CRITERIA
4.11 PRICE ANALYSIS SCENARIO
4.11.1 RAW MATERIALS PRICE ANALYSIS
4.11.2 CURRENT PRICE STATISTICS
4.11.3 PRICE FORECASTS
4.12 PRODUCTION CONSUMPTION ANALYSIS
4.13 REGULATION COVERAGE
4.14 MANUFACTURING COST SCENARIO AND FUTURE IMPACT
5 MARKET OVERVIEW
5.1 DRIVERS
5.1.1 RISE IN CONSTRUCTION ACTIVITIES ACROSS THE GLOBE
5.1.2 FAVOURABLE CHEMICAL AND PHYSICAL PROPERTIES OF KAOLIN
5.1.3 INCREASE IN DEMAND FOR KAOLIN FROM VARIOUS END-USE INDUSTRIES
5.1.4 HIGH ADOPTION OF KAOLIN AS A COATING ADDITIVE
5.2 RESTRAINTS
5.2.1 NEGATIVE EFFECT ON PAPER INDUSTRY DUE TO EMERGENCE OF COVID-19
5.2.2 KAOLIN MINING CAUSES NUMEROUS ENVIRONMENTAL AND HEALTH HAZARDS
5.3 OPPORTUNITIES
5.3.1 KEY STRATEGIC INITIATIVES IMPLEMENTED BY LEADING COMPANIES
5.3.2 IMPROVED TECHNOLOGIES IN MINING PRACTICES OF KAOLIN
5.4 CHALLENGES
5.4.1 EASY AVAILABILITY OF SUBSTITUTES
5.4.2 RISE IN THE PRICE OF KAOLIN
6 NORTH AMERICA KAOLIN MARKET, BY GRADE
6.1 OVERVIEW
6.2 CALCINED
6.3 HYDROUS
6.4 DELAMINATED
6.5 SURFACE TREATED
6.6 STRUCTURED
7 NORTH AMERICA KAOLIN MARKET, BY PROCESS
7.1 OVERVIEW
7.2 WATER-WASHED
7.3 AIRFLOAT
7.4 CALCINED
7.5 DELAMINATED
7.6 SURFACE-MODIFIED & UNPROCESSED
8 NORTH AMERICA KAOLIN MARKET, BY APPLICATION
8.1 OVERVIEW
8.2 PAPER
8.3 CERAMICS
8.4 PAINT & COATINGS
8.5 FIBERGLASS
8.6 PLASTIC
8.7 RUBBER
8.8 PHARMACEUTICALS & MEDICAL
8.9 COSMETICS
8.1 OTHERS
9 NORTH AMERICA KAOLIN MARKET, BY REGION
9.1 NORTH AMERICA
9.1.1 U.S.
9.1.2 CANADA
9.1.3 MEXICO
10 NORTH AMERICA KAOLIN MARKET: COMPANY LANDSCAPE
10.1 COMPANY SHARE ANALYSIS: NORTH AMERICA
10.2 DISINVESTMENT
10.3 PRICE INCREASE
10.4 ACQUISITION
10.5 FACILITY EXPANSION
11 SWOT ANALYSIS
12 COMPANY PROFILES
12.1 IMERYS S.A.
12.1.1 COMPANY SNAPSHOT
12.1.2 REVENUE ANALYSIS
12.1.3 COMPANY SHARE ANALYSIS
12.1.4 PRODUCT PORTFOLIO
12.1.5 RECENT DEVELOPMENT
12.2 SIBELCO
12.2.1 COMPANY SNAPSHOT
12.2.2 REVENUE ANALYSIS
12.2.3 COMPANY SHARE ANALYSIS
12.2.4 PRODUCT PORTFOLIO
12.2.5 RECENT DEVELOPMENT
12.3 BASF SE
12.3.1 COMPANY SNAPSHOT
12.3.2 REVENUE ANALYSIS
12.3.3 COMPANY SHARE ANALYSIS
12.3.4 PRODUCT PORTFOLIO
12.3.5 RECENT DEVELOPMENT
12.4 KAMIN LLC. / CADAM
12.4.1 COMPANY SNAPSHOT
12.4.2 COMPANY SHARE ANALYSIS
12.4.3 PRODUCT PORTFOLIO
12.4.4 RECENT DEVELOPMENTS
12.5 THIELE KAOLIN COMPANY
12.5.1 COMPANY SNAPSHOT
12.5.2 COMPANY SHARE ANALYSIS
12.5.3 PRODUCT PORTFOLIO
12.5.4 RECENT DEVELOPMENTS
12.6 ASHAPURA GROUP
12.6.1 COMPANY SNAPSHOT
12.6.2 REVENUE ANALYSIS
12.6.3 PRODUCT PORTFOLIO
12.6.4 RECENT DEVELOPMENTS
12.7 EICL
12.7.1 COMPANY SNAPSHOT
12.7.2 REVENUE ANALYSIS
12.7.3 PRODUCT PORTFOLIO
12.7.4 RECENT DEVELOPMENTS
12.8 I-MINERALSINC.
12.8.1 COMPANY SNAPSHOT
12.8.2 REVENUE ANALYSIS
12.8.3 PRODUCT PORTFOLIO
12.8.4 RECENT DEVELOPMENTS
12.9 LB MINERALS, LTD.
12.9.1 COMPANY SNAPSHOT
12.9.2 PRODUCT PORTFOLIO
12.9.3 RECENT DEVELOPMENTS
12.1 QUARTZ WORKS GMBH
12.10.1 COMPANY SNAPSHOT
12.10.2 PRODUCT PORTFOLIO
12.10.3 RECENT DEVELOPMENTS
13 QUESTIONNAIRE
14 RELATED REPORTS
表のリスト
TABLE 1 IMPORT DATA OF KAOLIN AND OTHER KAOLINIC CLAYS, WHETHER OR NOT CALCINED; HS CODE – 2507 (USD THOUSAND)
TABLE 2 EXPORT DATA OF KAOLIN AND OTHER KAOLINIC CLAYS, WHETHER OR NOT CALCINED; HS CODE – 2507 (USD THOUSAND)
TABLE 3 THE FOLLOWING TABLE SHOWS THE PRODUCTION CAPACITIES OF VARIOUS COMPANIES OPERATING IN THE NORTH AMERICA KAOLIN MARKET.
TABLE 4 REGULATORY FRAMEWORK
TABLE 5 NORTH AMERICA KAOLIN MARKET, BY GRADE, 2020-2029 (USD MILLION)
TABLE 6 NORTH AMERICA KAOLIN MARKET, BY GRADE, 2020-2029 (KILO TONS)
TABLE 7 NORTH AMERICA CALCINED IN KAOLIN MARKET, BY REGION, 2020-2029 (USD MILLION)
TABLE 8 NORTH AMERICA CALCINED IN KAOLIN MARKET, BY REGION, 2020-2029 (KILO TONS)
TABLE 9 NORTH AMERICA HYDROUS IN NORTH AMERICA KAOLIN MARKET, BY REGION, 2020-2029 (USD MILLION)
TABLE 10 NORTH AMERICA HYDROUS IN NORTH AMERICA KAOLIN MARKET, BY REGION, 2020-2029 (KILO TONS)
TABLE 11 NORTH AMERICA DELAMINATED IN NORTH AMERICA KAOLIN MARKET, BY REGION, 2020-2029 (USD MILLION)
TABLE 12 NORTH AMERICA DELAMINATED IN NORTH AMERICA KAOLIN MARKET, BY REGION, 2020-2029 (KILO TONS)
TABLE 13 NORTH AMERICA SURFACE TREATED IN NORTH AMERICA KAOLIN MARKET, BY REGION, 2020-2029 (USD MILLION)
TABLE 14 NORTH AMERICA SURFACE TREATED IN NORTH AMERICA KAOLIN MARKET, BY REGION, 2020-2029 (KILO TONS)
TABLE 15 NORTH AMERICA STRUCTURED IN NORTH AMERICA KAOLIN MARKET, BY REGION, 2020-2029 (USD MILLION)
TABLE 16 NORTH AMERICA STRUCTURED IN NORTH AMERICA KAOLIN MARKET, BY REGION, 2020-2029 (KILO TONS)
TABLE 17 NORTH AMERICA KAOLIN MARKET, BY PROCESS, 2020-2029 (USD MILLION)
TABLE 18 NORTH AMERICA KAOLIN MARKET, BY GRADE, 2020-2029 (KILO TONS)
TABLE 19 NORTH AMERICA WATER-WASHED IN KAOLIN MARKET, BY REGION, 2020-2029 (USD MILLION)
TABLE 20 NORTH AMERICA WATER-WASHED IN KAOLIN MARKET, BY REGION, 2020-2029 (KILO TONS)
TABLE 21 NORTH AMERICA AIRFLOAT IN NORTH AMERICA KAOLIN MARKET, BY REGION, 2020-2029 (USD MILLION)
TABLE 22 NORTH AMERICA AIRFLOAT IN NORTH AMERICA KAOLIN MARKET, BY REGION, 2020-2029 (KILO TONS)
TABLE 23 NORTH AMERICA CALCINED IN NORTH AMERICA KAOLIN MARKET, BY REGION, 2020-2029 (USD MILLION)
TABLE 24 NORTH AMERICA CALCINED IN NORTH AMERICA KAOLIN MARKET, BY REGION, 2020-2029 (KILO TONS)
TABLE 25 NORTH AMERICA DELAMINATED IN NORTH AMERICA KAOLIN MARKET, BY REGION, 2020-2029 (USD MILLION)
TABLE 26 NORTH AMERICA DELAMINATED IN NORTH AMERICA KAOLIN MARKET, BY REGION, 2020-2029 (KILO TONS)
TABLE 27 NORTH AMERICA SURFACE-MODIFIED & UNPROCESSED IN NORTH AMERICA KAOLIN MARKET, BY REGION, 2020-2029 (USD MILLION)
TABLE 28 NORTH AMERICA SURFACE-MODIFIED & UNPROCESSED IN NORTH AMERICA KAOLIN MARKET, BY REGION, 2020-2029 (KILO TONS)
TABLE 29 NORTH AMERICA KAOLIN MARKET, BY APPLICATION, 2020-2029 (USD MILLION)
TABLE 30 NORTH AMERICA KAOLIN MARKET, BY APPLICATION, 2020-2029 (KILO TONS)
TABLE 31 NORTH AMERICA PAPER IN KAOLIN MARKET, BY REGION, 2020-2029 (USD MILLION)
TABLE 32 NORTH AMERICA PAPER IN KAOLIN MARKET, BY REGION, 2020-2029 (KILO TONS)
TABLE 33 NORTH AMERICA CERAMICS IN NORTH AMERICA KAOLIN MARKET, BY REGION, 2020-2029 (USD MILLION)
TABLE 34 NORTH AMERICA CERAMICS IN NORTH AMERICA KAOLIN MARKET, BY REGION, 2020-2029 (KILO TONS)
TABLE 35 NORTH AMERICA PAINT & COATINGS IN NORTH AMERICA KAOLIN MARKET, BY REGION, 2020-2029 (USD MILLION)
TABLE 36 NORTH AMERICA PAINT & COATINGS IN NORTH AMERICA KAOLIN MARKET, BY REGION, 2020-2029 (KILO TONS)
TABLE 37 NORTH AMERICA FIBERGLASS IN NORTH AMERICA KAOLIN MARKET, BY REGION, 2020-2029 (USD MILLION)
TABLE 38 NORTH AMERICA FIBERGLASS IN NORTH AMERICA KAOLIN MARKET, BY REGION, 2020-2029 (KILO TONS)
TABLE 39 NORTH AMERICA PLASTIC IN NORTH AMERICA KAOLIN MARKET, BY REGION, 2020-2029 (USD MILLION)
TABLE 40 NORTH AMERICA PLASTIC IN NORTH AMERICA KAOLIN MARKET, BY REGION, 2020-2029 (KILO TONS)
TABLE 41 NORTH AMERICA RUBBER IN NORTH AMERICA KAOLIN MARKET, BY REGION, 2020-2029 (USD MILLION)
TABLE 42 NORTH AMERICA RUBBER IN NORTH AMERICA KAOLIN MARKET, BY REGION, 2020-2029 (KILO TONS)
TABLE 43 NORTH AMERICA PHARMACEUTICALS & MEDICAL IN NORTH AMERICA KAOLIN MARKET, BY REGION, 2020-2029 (USD MILLION)
TABLE 44 NORTH AMERICA PHARMACEUTICALS & MEDICAL IN NORTH AMERICA KAOLIN MARKET, BY REGION, 2020-2029 (KILO TONS)
TABLE 45 NORTH AMERICA COSMETICS IN NORTH AMERICA KAOLIN MARKET, BY REGION, 2020-2029 (USD MILLION)
TABLE 46 NORTH AMERICA COSMETICS IN NORTH AMERICA KAOLIN MARKET, BY REGION, 2020-2029 (KILO TONS)
TABLE 47 NORTH AMERICA OTHERS IN NORTH AMERICA KAOLIN MARKET, BY REGION, 2020-2029 (USD MILLION)
TABLE 48 NORTH AMERICA OTHERS IN NORTH AMERICA KAOLIN MARKET, BY REGION, 2020-2029 (KILO TONS)
TABLE 49 NORTH AMERICA KAOLIN MARKET, BY COUNTRY, 2020-2029 (USD MILLION)
TABLE 50 NORTH AMERICA KAOLIN MARKET, BY COUNTRY, 2020-2029 (KILO TONS)
TABLE 51 NORTH AMERICA KAOLIN MARKET, BY GRADE, 2020-2029 (USD MILLION)
TABLE 52 NORTH AMERICA KAOLIN MARKET, BY GRADE, 2020-2029 (KILO TONS)
TABLE 53 NORTH AMERICA KAOLIN MARKET, BY PROCESS, 2020-2029 (USD MILLION)
TABLE 54 NORTH AMERICA KAOLIN MARKET, BY PROCESS, 2020-2029 (KILO TONS)
TABLE 55 NORTH AMERICA KAOLIN MARKET, BY APPLICATION, 2020-2029 (USD MILLION)
TABLE 56 NORTH AMERICA KAOLIN MARKET, BY APPLICATION, 2020-2029 (KILO TONS)
TABLE 57 U.S. KAOLIN MARKET, BY GRADE, 2020-2029 (USD MILLION)
TABLE 58 U.S. KAOLIN MARKET, BY GRADE, 2020-2029 (KILO TONS)
TABLE 59 U.S. KAOLIN MARKET, BY PROCESS, 2020-2029 (USD MILLION)
TABLE 60 U.S. KAOLIN MARKET, BY PROCESS, 2020-2029 (KILO TONS)
TABLE 61 U.S. KAOLIN MARKET, BY APPLICATION, 2020-2029 (USD MILLION)
TABLE 62 U.S. KAOLIN MARKET, BY APPLICATION, 2020-2029 (KILO TONS)
TABLE 63 CANADA KAOLIN MARKET, BY GRADE, 2020-2029 (USD MILLION)
TABLE 64 CANADA KAOLIN MARKET, BY GRADE, 2020-2029 (KILO TONS)
TABLE 65 CANADA KAOLIN MARKET, BY PROCESS, 2020-2029 (USD MILLION)
TABLE 66 CANADA KAOLIN MARKET, BY PROCESS, 2020-2029 (KILO TONS)
TABLE 67 CANADA KAOLIN MARKET, BY APPLICATION, 2020-2029 (USD MILLION)
TABLE 68 CANADA KAOLIN MARKET, BY APPLICATION, 2020-2029 (KILO TONS)
TABLE 69 MEXICO KAOLIN MARKET, BY GRADE, 2020-2029 (USD MILLION)
TABLE 70 MEXICO KAOLIN MARKET, BY GRADE, 2020-2029 (KILO TONS)
TABLE 71 MEXICO KAOLIN MARKET, BY PROCESS, 2020-2029 (USD MILLION)
TABLE 72 MEXICO KAOLIN MARKET, BY PROCESS, 2020-2029 (KILO TONS)
TABLE 73 MEXICO KAOLIN MARKET, BY APPLICATION, 2020-2029 (USD MILLION)
TABLE 74 MEXICO KAOLIN MARKET, BY APPLICATION, 2020-2029 (KILO TONS)
図表一覧
FIGURE 1 NORTH AMERICA KAOLIN MARKET
FIGURE 2 NORTH AMERICA KAOLIN MARKET: DATA TRIANGULATION
FIGURE 3 NORTH AMERICA KAOLIN MARKET: DROC ANALYSIS
FIGURE 4 NORTH AMERICA KAOLIN MARKET: NORTH AMERICA VS REGIONAL MARKET ANALYSIS
FIGURE 5 NORTH AMERICA KAOLIN MARKET: COMPANY RESEARCH ANALYSIS
FIGURE 6 NORTH AMERICA KAOLIN MARKET: THE PRODUCT LIFE LINE CURVE
FIGURE 7 NORTH AMERICA KAOLIN MARKET: MULTIVARIATE MODELLING
FIGURE 8 NORTH AMERICA KAOLIN MARKET: INTERVIEW DEMOGRAPHICS
FIGURE 9 NORTH AMERICA KAOLIN MARKET: DBMR MARKET POSITION GRID
FIGURE 10 NORTH AMERICA KAOLIN MARKET: MARKET APPLICATION COVERAGE GRID
FIGURE 11 NORTH AMERICA KAOLIN MARKET: THE MARKET CHALLENGE MATRIX
FIGURE 12 NORTH AMERICA KAOLIN MARKET: VENDOR SHARE ANALYSIS
FIGURE 13 NORTH AMERICA KAOLIN MARKET: SEGMENTATION
FIGURE 14 RISE IN CONSTRUCTION ACTIVITIES ACROSS THE GLOBE IS EXPECTED TO DRIVE THE NORTH AMERICA KAOLIN MARKET IN THE FORECAST PERIOD
FIGURE 15 CALCINED SEGMENT IS EXPECTED TO ACCOUNT FOR THE LARGEST SHARE OF THE NORTH AMERICA KAOLIN MARKET IN 2022 & 2029
FIGURE 16 IMPORT-EXPORT SCENARIO (USD THOUSAND)
FIGURE 17 CURRENT PRICE STATISTICS (PER KG)
FIGURE 18 PRICE FORECASTS (PER KG)
FIGURE 19 PRODUCTION CONSUMPTION ANALYSIS
FIGURE 20 DRIVERS, RESTRAINTS, OPPORTUNITIES, AND CHALLENGES OF THE NORTH AMERICA KAOLIN MARKET
FIGURE 21 NORTH AMERICA KAOLIN MARKET: BY GRADE, 2021
FIGURE 22 NORTH AMERICA KAOLIN MARKET: BY PROCESS, 2021
FIGURE 23 NORTH AMERICA KAOLIN MARKET: BY APPLICATION, 2021
FIGURE 24 NORTH AMERICA KAOLIN MARKET: SNAPSHOT (2021)
FIGURE 25 NORTH AMERICA KAOLIN MARKET: BY COUNTRY (2021)
FIGURE 26 NORTH AMERICA KAOLIN MARKET: BY COUNTRY (2022 & 2029)
FIGURE 27 NORTH AMERICA KAOLIN MARKET: BY COUNTRY (2021 & 2029)
FIGURE 28 NORTH AMERICA KAOLIN MARKET: BY GRADE (2022-2029)
FIGURE 29 NORTH AMERICA KAOLIN MARKET: COMPANY SHARE 2021 (%)

調査方法
データ収集と基準年分析は、大規模なサンプル サイズのデータ収集モジュールを使用して行われます。この段階では、さまざまなソースと戦略を通じて市場情報または関連データを取得します。過去に取得したすべてのデータを事前に調査および計画することも含まれます。また、さまざまな情報ソース間で見られる情報の不一致の調査も含まれます。市場データは、市場統計モデルと一貫性モデルを使用して分析および推定されます。また、市場シェア分析と主要トレンド分析は、市場レポートの主要な成功要因です。詳細については、アナリストへの電話をリクエストするか、お問い合わせをドロップダウンしてください。
DBMR 調査チームが使用する主要な調査方法は、データ マイニング、データ変数が市場に与える影響の分析、および一次 (業界の専門家) 検証を含むデータ三角測量です。データ モデルには、ベンダー ポジショニング グリッド、市場タイムライン分析、市場概要とガイド、企業ポジショニング グリッド、特許分析、価格分析、企業市場シェア分析、測定基準、グローバルと地域、ベンダー シェア分析が含まれます。調査方法について詳しくは、お問い合わせフォームから当社の業界専門家にご相談ください。
カスタマイズ可能
Data Bridge Market Research は、高度な形成的調査のリーダーです。当社は、既存および新規のお客様に、お客様の目標に合致し、それに適したデータと分析を提供することに誇りを持っています。レポートは、対象ブランドの価格動向分析、追加国の市場理解 (国のリストをお問い合わせください)、臨床試験結果データ、文献レビュー、リファービッシュ市場および製品ベース分析を含めるようにカスタマイズできます。対象競合他社の市場分析は、技術ベースの分析から市場ポートフォリオ戦略まで分析できます。必要な競合他社のデータを、必要な形式とデータ スタイルでいくつでも追加できます。当社のアナリスト チームは、粗い生の Excel ファイル ピボット テーブル (ファクト ブック) でデータを提供したり、レポートで利用可能なデータ セットからプレゼンテーションを作成するお手伝いをしたりすることもできます。


