中東およびアフリカの液化市場、供給モード別(バンカリング/船舶、パイプライン、トラック、鉄道)、用途別(化学薬品および石油化学製品、発電、工業用原料、その他)、業界動向および2030年までの予測。
中東およびアフリカの液化市場の分析と洞察
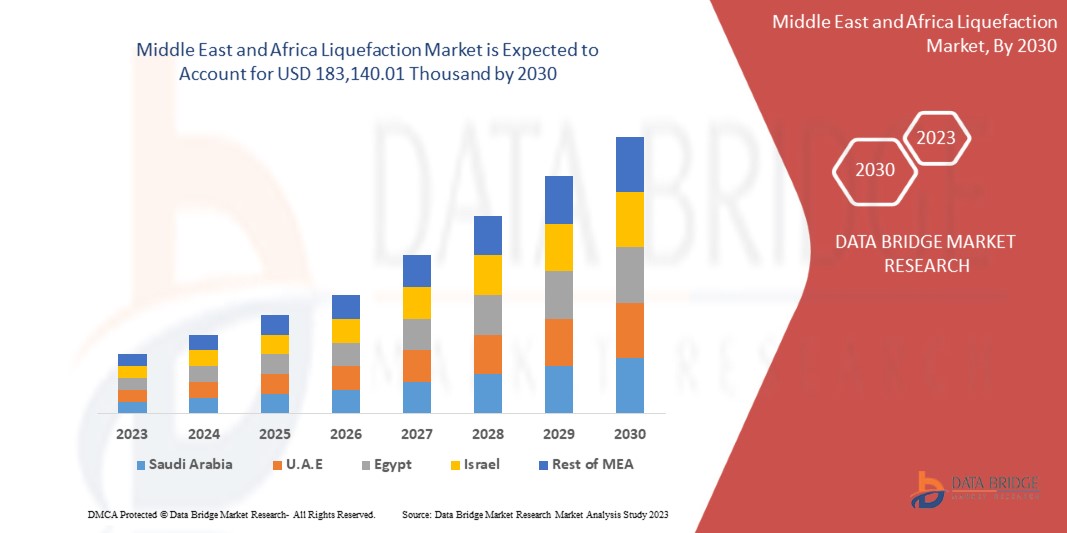
中東およびアフリカの液化市場は、2023年から2030年の予測期間に大幅な成長が見込まれています。データブリッジマーケットリサーチは、市場は2023年から2030年の予測期間に5.3%のCAGRで成長し、2030年までに1億8,314万0,010米ドルに達すると分析しています。市場の成長を牽引する主な要因は、オフショアとオンショアの両方の建設活動の拡大です。
液化とは、気体物質を液体に変えるプロセスです。この変化は、温度、圧力、体積などの物理的変数の変化によって生じます。ガス液化とは、ガスを沸点以下の温度に冷却して、液体の状態で保管および配送できるようにするプロセスです。
中東およびアフリカの液化市場レポートでは、市場シェア、新しい開発、国内および現地の市場プレーヤーの影響、新たな収益源に関する分析機会、市場規制の変更、製品承認、戦略的決定、製品発売、地理的拡大、市場における技術革新などの詳細が提供されています。分析と市場シナリオを理解するには、アナリスト概要についてお問い合わせください。当社のチームが、収益に影響を与えるソリューションを作成し、希望する目標を達成できるようお手伝いします。
|
レポートメトリック |
詳細 |
|
予測期間 |
2023年から2030年 |
|
基準年 |
2022 |
|
歴史的な年 |
2021 (2020 - 2015 にカスタマイズ可能) |
|
定量単位 |
収益(千米ドル) |
|
対象セグメント |
供給モード別(燃料補給/船舶、パイプライン、トラック、鉄道)、用途別(化学薬品および石油化学製品、発電、工業用原料、その他)。 |
|
対象国 |
南アフリカ、エジプト、サウジアラビア、アラブ首長国連邦、イスラエル、その他の中東およびアフリカ。 |
|
対象となる市場プレーヤー |
Linde plc、Air Products and Chemicals、Inc.、Baker Hughes Company、Shell plc、Honeywell International Inc.、Siemens Gas and Power GmbH & Co. KG、ENGIE、Excelerate Energy、Inc.、Eni SpA、Kunlun Energy Company Limited など |
市場の定義
液化は、ガスと固体化合物から液体を生成するプロセスです。これは人工的にも自然にも起こります。たとえば、この液化プロセスの主な商業的応用は空気の液化であり、これにより窒素、酸素、希ガスなどの元素を分離できます。
中東およびアフリカの液化市場の動向
このセクションでは、市場の推進要因、機会、制約、課題について理解します。これらについては、以下で詳しく説明します。
ドライバー
- ディーゼルとガソリンに対する環境意識が高まっている
ディーゼルやガソリンの排出物は、人間の健康、環境、中東およびアフリカの気候、環境正義に影響を与えます。ディーゼル汚染にさらされると、喘息や呼吸器感染症などの重大な健康問題を引き起こすだけでなく、特に子供や高齢者の既存の心臓病や肺疾患を悪化させる可能性があります。ディーゼルエンジンの排出物は地上オゾンの形成につながり、作物、樹木、その他の植物に害を及ぼします。この排出物によって酸性雨も生成され、陸地、湖、川に影響を及ぼし、水を通じて人間の食物連鎖に入り込み、肉や魚を生み出します。
ディーゼルとガソリンの有害な影響により、人々は環境問題を理解し、環境とディーゼルとガソリンの使用に関する意識を高めています。これは、ディーゼルやガソリンよりも環境への影響が少ない燃料を探すのに役立ちます。これにより、企業は環境に優しいソリューションを採用するようになりました。液化天然ガス (LNG) は、最近、ディーゼルとガソリンの代替品として使用されています。これは、顧客にコスト効率の良い代替品を提供するクリーンな燃料です。
- 燃料補給、道路輸送、オフグリッド電力におけるLNG需要の増加
過去 10 年間で産業と都市化が大幅に進み、中東とアフリカでは炭素と温室効果ガスが増加しました。炭素と温室効果ガスの排出を最小限に抑えるため、政府は発電や自動車燃料での天然ガスの使用を奨励しています。
その結果、政府は自動車メーカーや顧客への補助金や減税の提供など、CNG および LNG 駆動車の使用を奨励するさまざまな政策を実施しています。その結果、中東およびアフリカの天然ガス消費量はここ 10 年間で増加しています。その結果、燃料補給、発電、道路輸送における天然ガスの使用が増加しています。
- 研究開発(R&D)活動の拡大
LNG は、天然ガスを遠方の市場に輸送するために利用されています。しかし、生産、輸送、保管のコストが高いため、LNG 技術の拡大は、NG を輸送する他の安価な手段がない特定の状況に限られています。しかし、NG を取り巻く市場や政治的課題により、この代替輸送技術への関心が高まっています。この技術には、売り手にとっては潜在的な市場が拡大し、買い手にとっては潜在的なサプライヤーが拡大するという利点があります。関心が高まった結果、LNG の研究開発費とその用途はますます増加しています。
前処理、酸性ガス除去、脱水、液化は、LNG プラントの 4 つのステップです。R&D 活動は主に液化段階に焦点を当てており、エネルギー消費を最小限に抑え、液化プロセスの効率を高めることができる技術を導入することを目標としています。主要な液化プロセスと発明には、C3-MR 技術、AP-X 法、カスケード法、および二重混合冷媒 (DMR) 法が含まれます。これらの設計はすべて、大量のエネルギーを消費するため (主に冷凍コンプレッサー用)、R&D の取り組みはプロセス最適化に向けられています。主な R&D 活動は、極低温熱交換器の設計と最適化、冷媒コンプレッサーの強化、およびコンプレッサー ドライバーの効率に焦点を当てています。
LNG 輸送技術では、浮体式貯蔵ユニット (FSU) と浮体式貯蔵再ガス化ユニット (FSRU) という 2 つの船舶技術が使用されています。この分野の研究開発は主に FSRU の性能向上と価格低下に重点を置いており、FSRU は小規模市場や新興国にとって魅力的な高速オプションとなっています。
- オフショアとオンショアの建設活動の拡大
現代の世界の海上および陸上の建設事業は、プロジェクト数の増加に伴い発展しています。液化プロジェクトもさらに開発されています。
浮体式液化天然ガス (FLNG) システムは、比較的最近の LNG 産業技術です。陸上での液化には沖合が遠すぎる沖合の油田から生成された天然ガスを液化するために使用されます。FLNG システムは、海底の天然ガス田の上に設置された水上船です。一般的に、FLNG システムは、LNG を生成、処理、液化、保管し、運搬船で中東およびアフリカ市場に、または国内市場にガスを輸送する陸上のインフラストラクチャに輸送します。FSRU は、LNG を収集、保管、蒸発させて、発電用の燃料、工業プロセスの原料、住宅および商業ビルの熱、およびその他の最終用途に供給する特殊な船または沖合船です。
機会
- 液化の新しいプロジェクトの出現
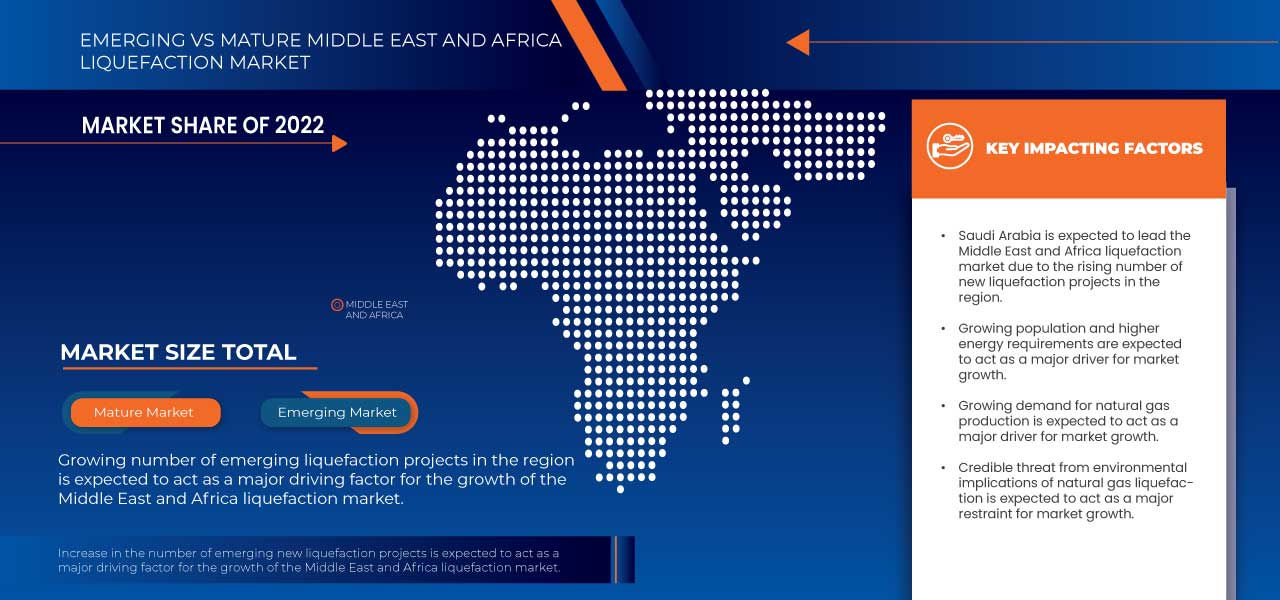
近年、LNG 液化プラントへの投資選択肢が増えており、世界規模でさらに生産能力を拡大する道が開かれています。こうした投資の多くは、開発者がプロジェクトのマイルストーンを以前よりも速いペースで達成できる契約構造のトレンドによって推進されてきました。これは、経済成長による持続的な需要の伸びと、市場参加者の増加によるものです。
Long-term market confidence has been critical in supporting these decisions since a liquefaction project might take ten years or more from early planning to first gas supplies to market. Investment milestones are crucial for projects that have progressed beyond the planning stage if they intend to capture medium-term demand and beyond. Investors have been keen to accelerate activity and authorize projects in a market with several competing projects before this window of opportunity expires.
This significant surge in LNG investment over the last two years has also coincided with a change away from traditional methods of establishing LNG liquefaction plants. Developers take FID under classic offtake models once project offtake is secured through long-term supply contracts with third parties. This traditional technique offers investor trust, but organizing offtake for an entire project with various counterparties is time-consuming and costly for developers.
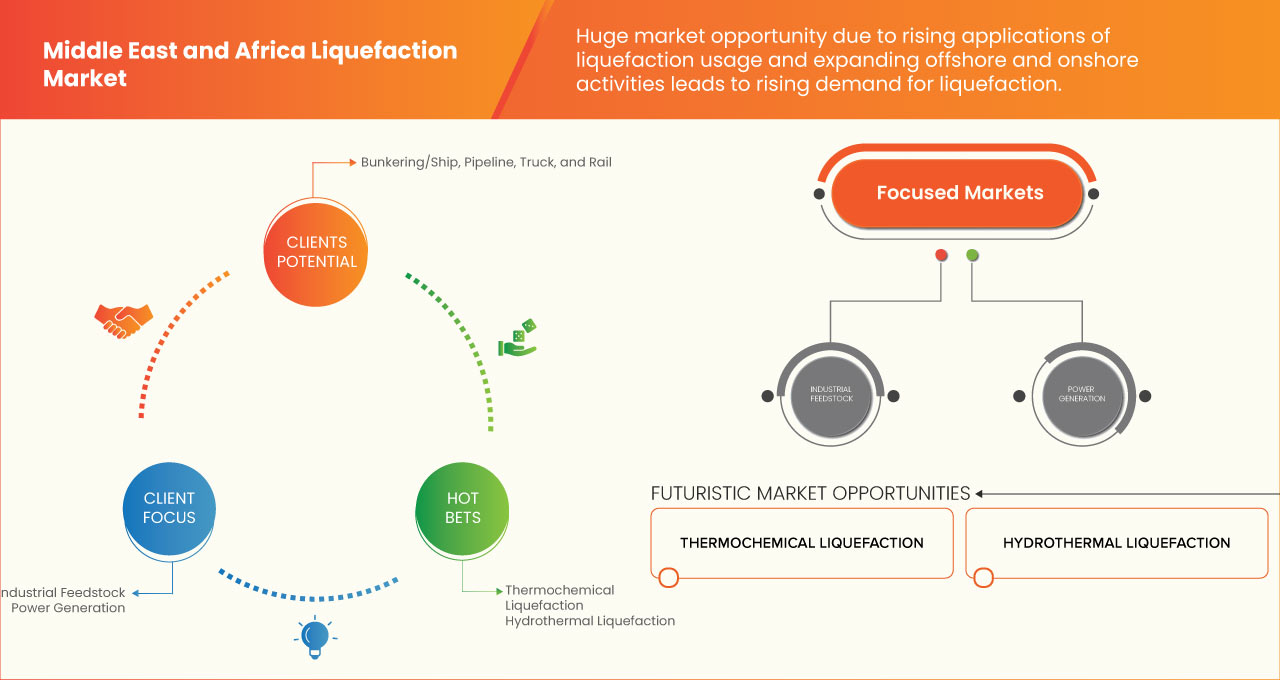
- Rising Applications of Liquefaction
The process of converting a gas to a liquid is known as liquefaction. Liquefaction is a significant economic process since liquid chemicals take up considerably less space than gaseous substances. Liquefied gases are most commonly utilized in the compact storage and transfer of combustible fuels used for heating, cooking, or powering motor vehicles. For this reason, two types of liquefied gases are frequently employed commercially: Liquefied Natural Gas (LNG) and Liquefied Petroleum Gas (LPG). LPG is a liquid-state combination of gases derived from natural gas or petroleum. The combination is kept in containers that can sustain extremely high pressures. LNG is similar to LPG in that practically has every composition such as propane and butane except methane. LNG and LPG have numerous applications in common.
Liquefied gases and liquefaction procedures are employed in a range of operations in various industries such as medicinal, industrial, scientific, and so on. Preservation of Biosamples, such as freezing the sperm using liquid nitrogen, or using liquid oxygen in hospitals to offer patients with respiratory issues a healthier breath. Aqualung devices can employ a mix of liquid oxygen and liquid nitrogen.
Gas liquefaction is utilized in refrigeration systems. Liquid ammonia is used to chill ice plants. The liquid oxygen and hydrogen generated by the gas liquefaction technique are utilized in rocket propellants. Gases may be easily stored and transported using this method. For example, in air conditioning systems where stored liquid gas, such as R-290 or R-600A, is utilized as a refrigerant. In the industrial sector, liquid acetylene and liquid oxygen can be utilized for welding. Liquefaction of gases is also essential in the realm of cryogenics research. Liquid helium is commonly employed in the research of matter's behavior at temperatures near absolute zero, 0 K (zero Kelvin).
Currently, liquefied hydrogen is mostly employed in space applications and the semiconductor sector. While renewable energy applications, such as the automotive sector, presently provide just a tiny portion of this demand, their need may experience a major increase in the coming years, with the requirement for large-scale liquefaction facilities well exceeding the existing plant sizes.
RESTRAINTS/CHALLENGES
- Limited Liquefied Natural Gas (LNG) Receiving
LNG is playing an increasingly essential role in the worldwide natural gas market. Natural gas consumption will rise Middle East and Africa in the next few years. Ships transfer LNG to unloading stations at storage depots. Some LNG evaporates into the gas phase during the storage stages. Boil-off gas is the name given to evaporate LNG (BOG). LNG is kept in cryogenic storage. The evaporation process is influenced by heat flow. It shows that a tiny proportion or portion of LNG is continuously boiling out as a result of heat during the storage procedure. Increased evaporation may have a detrimental impact on the LNG storage process's stability and safety. Due to LNG storage concerns, remote locations, and rising costs, there is a scarcity of LNG-receiving terminal infrastructure.
- Strict Liquefaction Regulations and Standards
The process of converting a gas to a liquid is known as liquefaction. The products of liquefied gases are less harmful to the environment. It is also necessary to consider specific aspects such as how they are manufactured, stored, and transported, as well as the potential harm that liquefied gaseous goods might cause. All of them are carried out by each government or country throughout the world, which has established tight laws, guidelines, and standards for their regulated use without causing harm to the environment or people.
Middle East and Africa Liquefaction Market Scope
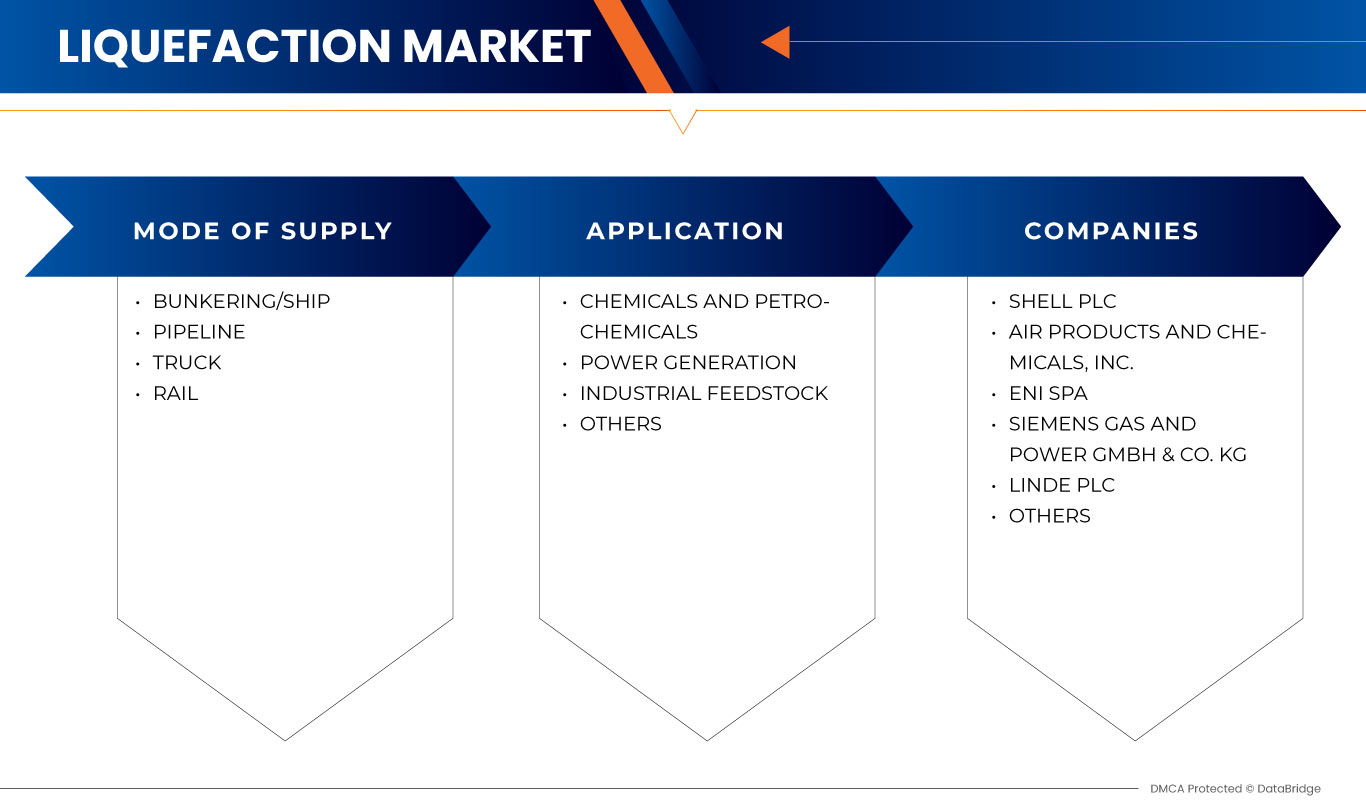
The Middle East and Africa liquefaction market is segmented into two notable segments based on mode of supply and application. The growth amongst these segments will help you analyze major growth segments in the industries and provide the users with a valuable market overview and market insights to make strategic decisions to identify core market applications.
Mode of Supply
- Bunkering/Ship
- Pipeline
- Truck
- Rail
Based on mode of supply, the market is segmented into bunkering/ship, pipeline, truck, and rail.
Application
- Chemicals and Petrochemicals
- Power Generation
- Industrial Feedstock
- Others
Based on application, the market is segmented into chemicals and petrochemicals, power generation, industrial feedstock, and others.
Middle East and Africa Liquefaction Market Regional Analysis/Insights
The Middle East and Africa liquefaction market is segmented into two notable segments based on mode of supply and application.
中東およびアフリカの液化市場に含まれる国は、南アフリカ、エジプト、サウジアラビア、アラブ首長国連邦、イスラエル、およびその他の中東およびアフリカです。サウジアラビアは、オフショアおよびオンショアの建設活動の拡大により、市場シェアと市場収益の面で中東およびアフリカの液化市場を支配しています。
レポートの国別セクションでは、市場の現在および将来の傾向に影響を与える個別の市場影響要因と市場規制の変更も提供しています。下流および上流のバリュー チェーン分析、技術動向、ポーターの 5 つの力の分析、ケース スタディなどのデータ ポイントは、各国の市場シナリオを予測するために使用される指標の一部です。また、中東およびアフリカのブランドの存在と可用性、および地元および国内ブランドとの競争が激しいか少ないために直面する課題、国内関税の影響、貿易ルートも考慮され、国別データの予測分析が提供されます。
競争環境と中東およびアフリカの液化市場シェア分析
中東およびアフリカの液化市場の競争状況は、競合他社の詳細を提供します。含まれる詳細には、会社概要、会社の財務、収益、市場の可能性、研究開発への投資、新しい市場への取り組み、生産拠点と施設、会社の長所と短所、製品の発売、製品の承認、特許、製品の幅と広さ、アプリケーションの優位性、および製品のライフライン曲線が含まれます。提供された上記のデータ ポイントは、市場に関連する会社の焦点にのみ関連しています。
中東およびアフリカの液化市場で活動している主な企業としては、Linde plc、Air Products and Chemicals、Inc.、Baker Hughes Company、Shell plc、Honeywell International Inc.、Siemens Gas and Power GmbH & Co. KG、ENGIE、Excelerate Energy、Inc.、Eni SpA、Kunlun Energy Company Limited などがあります。
SKU-
世界初のマーケットインテリジェンスクラウドに関するレポートにオンラインでアクセスする
- インタラクティブなデータ分析ダッシュボード
- 成長の可能性が高い機会のための企業分析ダッシュボード
- カスタマイズとクエリのためのリサーチアナリストアクセス
- インタラクティブなダッシュボードによる競合分析
- 最新ニュース、更新情報、トレンド分析
- 包括的な競合追跡のためのベンチマーク分析のパワーを活用
目次
1 INTRODUCTION
1.1 OBJECTIVES OF THE STUDY
1.2 MARKET DEFINITION
1.3 OVERVIEW
1.4 LIMITATION
1.5 MARKETS COVERED
2 MARKET SEGMENTATION
2.1 MARKETS COVERED
2.2 GEOGRAPHICAL SCOPE
2.3 YEARS CONSIDERED FOR THE STUDY
2.4 CURRENCY AND PRICING
2.5 DBMR TRIPOD DATA VALIDATION MODEL
2.6 MODE OF SUPPLY LIFELINE CURVE
2.7 MULTIVARIATE MODELING
2.8 PRIMARY INTERVIEWS WITH KEY OPINION LEADERS
2.9 DBMR MARKET POSITION GRID
2.1 MARKET APPLICATION COVERAGE GRID
2.2 DBMR MARKET CHALLENGE MATRIX
2.3 DBMR VENDOR SHARE ANALYSIS
2.4 SECONDARY SOURCES
2.5 ASSUMPTIONS
3 EXECUTIVE SUMMARY
4 PREMIUM INSIGHTS
5 MARKET OVERVIEW
5.1 DRIVERS
5.1.1 PEOPLE ARE BECOMING MORE ENVIRONMENTALLY CONSCIOUS ABOUT DIESEL AND GASOLINE
5.1.2 INCREASING LNG DEMAND IN BUNKERING, ROAD TRANSPORTATION, AND OFF-GRID POWER
5.1.3 EXPANSION OF RESEARCH AND DEVELOPMENT (R&D) ACTIVITIES
5.1.4 EXPANDING BOTH OFFSHORE AND ONSHORE BUILDING ACTIVITY
5.2 RESTRAINTS
5.2.1 LIMITED LIQUEFIED NATURAL GAS (LNG) RECEIVING
5.2.2 ENVIRONMENTAL IMPLICATIONS OF NATURAL GAS LIQUEFACTION
5.3 OPPORTUNITIES
5.3.1 EMERGING NEW PROJECTS OF LIQUEFACTION
5.3.2 RISING APPLICATIONS OF LIQUEFACTION
5.4 CHALLENGES
5.4.1 STRICT LIQUEFACTION REGULATIONS AND STANDARDS
5.4.2 KEY ISSUES AND CHALLENGES OF LIQUEFACTION
6 MIDDLE EAST & AFRICA LIQUEFACTION MARKET, BY MODE OF SUPPLY
6.1 OVERVIEW
6.2 BUNKERING/SHIP
6.3 PIPELINE
6.4 TRUCK
6.5 RAIL
7 MIDDLE EAST & AFRICA LIQUEFACTION MARKET, BY APPLICATION
7.1 OVERVIEW
7.2 CHEMICALS AND PETROCHEMICALS
7.3 POWER GENERATION
7.4 INDUSTRIAL FEEDSTOCK
7.5 OTHERS
8 MIDDLE EAST & AFRICA LIQUEFACTION MARKET, BY REGION
8.1 MIDDLE EAST AND AFRICA
8.1.1 SAUDI ARABIA
8.1.2 SOUTH AFRICA
8.1.3 EGYPT
8.1.4 ISRAEL
8.1.5 UNITED ARAB EMIRATES
8.1.6 REST OF MIDDLE EAST AND AFRICA
9 MIDDLE EAST & AFRICA LIQUEFACTION MARKET: COMPANY LANDSCAPE
9.1 COMPANY SHARE ANALYSIS: MIDDLE EAST & AFRICA
9.2 PRODUCT LAUNCH
9.3 PARTNERSHIP
9.4 COLLABORATIONS
9.5 RECOGNITIONS
9.6 ACHIEVEMENTS
9.7 AGREEMENTS
9.8 INITIATE OPERATIONS
10 SWOT ANALYSIS
11 COMPANY PROFILES
11.1 SHELL PLC
11.1.1 COMPANY SNAPSHOT
11.1.2 REVENUE ANALYSIS
11.1.3 COMPANY SHARE ANALYSIS
11.1.4 PRODUCT PORTFOLIO
11.1.5 RECENT DEVELOPMENT
11.2 AIR PRODUCTS AND CHEMICLAS, INC.
11.2.1 COMPANY SNAPSHOT
11.2.2 REVENUE ANALYSIS
11.2.3 COMPANY SHARE ANALYSIS
11.2.4 PRODUCT PORTFOLIO
11.2.5 RECENT DEVELOPMENTS
11.3 ENI SPA
11.3.1 COMPANY SNAPSHOT
11.3.2 REVENUE ANALYSIS
11.3.3 COMPANY SHARE ANALYSIS
11.3.4 PRODUCT PORTFOLIO
11.3.5 RECENT DEVELOPMENTS
11.4 SIEMENS GAS AND POWER GMBH & CO. KG
11.4.1 COMPANY SNAPSHOT
11.4.2 REVENUE ANALYSIS
11.4.3 COMPANY SHARE ANALYSIS
11.4.4 PRODUCT PORTFOLIO
11.4.5 RECENT DEVELOPMENTS
11.5 LINDE PLC
11.5.1 COMPANY SNAPSHOT
11.5.2 REVENUE ANALYSIS
11.5.3 COMPANY SHARE ANALYSIS
11.5.4 PRODUCT PORTFOLIO
11.5.5 RECENT DEVELOPMENT
11.6 BAKER HUGHES COMPANY
11.6.1 COMPANY SNAPSHOT
11.6.2 REVENUE ANALYSIS
11.6.3 PRODUCT PORTFOLIO
11.6.4 RECENT DEVELOPMENT
11.7 ENGIE
11.7.1 COMPANY SNAPSHOT
11.7.2 REVENUE ANALYSIS
11.7.3 PRODUCT PORTFOLIO
11.7.4 RECENT DEVELOPMENT
11.8 EXCELERATE ENERGY, INC.
11.8.1 COMPANY SNAPSHOT
11.8.2 PRODUCT PORTFOLIO
11.8.3 RECENT DEVELOPMENTS
11.9 HONEYWELL INTERNATIONAL INC. (2022)
11.9.1 COMPANY SNAPSHOT
11.9.2 REVENUE ANALYSIS
11.9.3 PRODUCT PORTFOLIO
11.9.4 RECENT DEVELOPMENT
11.1 KUNLUN ENERGY COMPANY LIMITED
11.10.1 COMPANY SNAPSHOT
11.10.2 REVENUE ANALYSIS
11.10.3 PRODUCT PORTFOLIO
11.10.4 RECENT DEVELOPMENT
12 QUESTIONNAIRE
13 RELATED REPORTS
表のリスト
TABLE 1 MIDDLE EAST & AFRICA LIQUEFACTION MARKET, BY MODE OF SUPPLY, 2021-2030 (USD THOUSAND)
TABLE 2 MIDDLE EAST & AFRICA BUNKERING/SHIP IN LIQUEFACTION MARKET, BY REGION, 2021-2030 (USD THOUSAND)
TABLE 3 MIDDLE EAST & AFRICA PIPELINE IN LIQUEFACTION MARKET, BY REGION, 2021-2030 (USD THOUSAND)
TABLE 4 MIDDLE EAST & AFRICA TRUCK IN LIQUEFACTION MARKET, BY REGION, 2021-2030 (USD THOUSAND)
TABLE 5 MIDDLE EAST & AFRICA RAIL IN LIQUEFACTION MARKET, BY REGION, 2021-2030 (USD THOUSAND)
TABLE 6 MIDDLE EAST & AFRICA LIQUEFACTION MARKET, BY APPLICATION, 2021-2030 (USD THOUSAND)
TABLE 7 MIDDLE EAST & AFRICA CHEMICALS AND PETROCHEMICALS IN LIQUEFACTION MARKET, BY REGION, 2021-2030 (USD THOUSAND)
TABLE 8 MIDDLE EAST & AFRICA POWER GENERATION IN LIQUEFACTION MARKET, BY REGION, 2021-2030 (USD THOUSAND)
TABLE 9 MIDDLE EAST & AFRICA INDUSTRIAL FEEDSTOCK IN LIQUEFACTION MARKET, BY REGION, 2021-2030 (USD THOUSAND)
TABLE 10 MIDDLE EAST & AFRICA OTHERS IN LIQUEFACTION MARKET, BY REGION, 2021-2030 (USD THOUSAND)
TABLE 11 MIDDLE EAST AND AFRICA LIQUEFACTION MARKET, BY COUNTRY, 2021-2030 (USD THOUSAND)
TABLE 12 MIDDLE EAST AND AFRICA LIQUEFACTION MARKET, BY MODE OF SUPPLY, 2021-2030 (USD THOUSAND)
TABLE 13 MIDDLE EAST AND AFRICA LIQUEFACTION MARKET, BY APPLICATION, 2021-2030 (USD THOUSAND)
TABLE 14 SAUDI ARABIA LIQUEFACTION MARKET, BY MODE OF SUPPLY, 2021-2030 (USD THOUSAND)
TABLE 15 SAUDI ARABIA LIQUEFACTION MARKET, BY APPLICATION, 2021-2030 (USD THOUSAND)
TABLE 16 SOUTH AFRICA LIQUEFACTION MARKET, BY MODE OF SUPPLY, 2021-2030 (USD THOUSAND)
TABLE 17 SOUTH AFRICA LIQUEFACTION MARKET, BY APPLICATION, 2021-2030 (USD THOUSAND)
TABLE 18 EGYPT LIQUEFACTION MARKET, BY MODE OF SUPPLY, 2021-2030 (USD THOUSAND)
TABLE 19 EGYPT LIQUEFACTION MARKET, BY APPLICATION, 2021-2030 (USD THOUSAND)
TABLE 20 ISRAEL LIQUEFACTION MARKET, BY MODE OF SUPPLY, 2021-2030 (USD THOUSAND)
TABLE 21 ISRAEL LIQUEFACTION MARKET, BY APPLICATION, 2021-2030 (USD THOUSAND)
TABLE 22 UNITED ARAB EMIRATES LIQUEFACTION MARKET, BY MODE OF SUPPLY, 2021-2030 (USD THOUSAND)
TABLE 23 UNITED ARAB EMIRATES LIQUEFACTION MARKET, BY APPLICATION, 2021-2030 (USD THOUSAND)
TABLE 24 REST OF MIDDLE EAST AND AFRICA LIQUEFACTION MARKET, BY MODE OF SUPPLY, 2021-2030 (USD THOUSAND)
図表一覧
FIGURE 1 MIDDLE EAST & AFRICA LIQUEFACTION MARKET: SEGMENTATION
FIGURE 2 MIDDLE EAST & AFRICA LIQUEFACTION MARKET: DATA TRIANGULATION
FIGURE 3 MIDDLE EAST & AFRICA LIQUEFACTION MARKET: DROC ANALYSIS
FIGURE 4 MIDDLE EAST & AFRICA LIQUEFACTION MARKET: MIDDLE EAST & AFRICA VS REGIONAL MARKET ANALYSIS
FIGURE 5 MIDDLE EAST & AFRICA LIQUEFACTION MARKET: COMPANY RESEARCH ANALYSIS
FIGURE 6 MIDDLE EAST & AFRICA LIQUEFACTION MARKET: THE MODE OF SUPPLY LIFE LINE CURVE
FIGURE 7 MIDDLE EAST & AFRICA LIQUEFACTION MARKET: MULTIVARIATE MODELLING
FIGURE 8 MIDDLE EAST & AFRICA LIQUEFACTION MARKET: INTERVIEW DEMOGRAPHICS
FIGURE 9 MIDDLE EAST & AFRICA LIQUEFACTION MARKET: DBMR MARKET POSITION GRID
FIGURE 10 MIDDLE EAST & AFRICA LIQUEFACTION MARKET: MARKET APPLICATION COVERAGE GRID
FIGURE 11 MIDDLE EAST & AFRICA LIQUEFACTION MARKET: THE MARKET CHALLENGE MATRIX
FIGURE 12 MIDDLE EAST & AFRICA LIQUEFACTION MARKET: VENDOR SHARE ANALYSIS
FIGURE 13 MIDDLE EAST & AFRICA LIQUEFACTION MARKET: SEGMENTATION
FIGURE 14 PEOPLE ARE BECOMING MORE ENVIRONMENTALLY CONSCIOUS ABOUT DIESEL AND GASOLINE, WHICH IS EXPECTED TO DRIVE THE GROWTH OF THE MIDDLE EAST & AFRICA LIQUEFACTION MARKET IN THE FORECAST PERIOD
FIGURE 15 THE BUNKERING/SHIP SEGMENT IS EXPECTED TO ACCOUNT FOR THE LARGEST MARKET SHARE OF THE MIDDLE EAST & AFRICA LIQUEFACTION MARKET IN 2023 AND 2030
FIGURE 16 DRIVERS, RESTRAINTS, OPPORTUNITIES, AND CHALLENGES OF THE MIDDLE EAST & AFRICA LIQUEFACTION MARKET
FIGURE 17 MIDDLE EAST & AFRICA LIQUEFACTION MARKET: BY MODE OF SUPPLY, 2022
FIGURE 18 MIDDLE EAST & AFRICA LIQUEFACTION MARKET: BY APPLICATION, 2022
FIGURE 19 MIDDLE EAST AND AFRICA LIQUEFACTION MARKET, BY SNAPSHOT (2022)
FIGURE 20 MIDDLE EAST AND AFRICA LIQUEFACTION MARKET, BY COUNTRY (2022)
FIGURE 21 MIDDLE EAST AND AFRICA LIQUEFACTION MARKET, BY COUNTRY (2023 & 2030)
FIGURE 22 MIDDLE EAST AND AFRICA LIQUEFACTION MARKET, BY COUNTRY (2022 & 2030)
FIGURE 23 MIDDLE EAST AND AFRICA LIQUEFACTION MARKET, BY MODE OF SUPPLY (2023 - 2030)
FIGURE 24 MIDDLE EAST & AFRICA LIQUEFACTION MARKET: COMPANY SHARE 2022 (%)

調査方法
データ収集と基準年分析は、大規模なサンプル サイズのデータ収集モジュールを使用して行われます。この段階では、さまざまなソースと戦略を通じて市場情報または関連データを取得します。過去に取得したすべてのデータを事前に調査および計画することも含まれます。また、さまざまな情報ソース間で見られる情報の不一致の調査も含まれます。市場データは、市場統計モデルと一貫性モデルを使用して分析および推定されます。また、市場シェア分析と主要トレンド分析は、市場レポートの主要な成功要因です。詳細については、アナリストへの電話をリクエストするか、お問い合わせをドロップダウンしてください。
DBMR 調査チームが使用する主要な調査方法は、データ マイニング、データ変数が市場に与える影響の分析、および一次 (業界の専門家) 検証を含むデータ三角測量です。データ モデルには、ベンダー ポジショニング グリッド、市場タイムライン分析、市場概要とガイド、企業ポジショニング グリッド、特許分析、価格分析、企業市場シェア分析、測定基準、グローバルと地域、ベンダー シェア分析が含まれます。調査方法について詳しくは、お問い合わせフォームから当社の業界専門家にご相談ください。
カスタマイズ可能
Data Bridge Market Research は、高度な形成的調査のリーダーです。当社は、既存および新規のお客様に、お客様の目標に合致し、それに適したデータと分析を提供することに誇りを持っています。レポートは、対象ブランドの価格動向分析、追加国の市場理解 (国のリストをお問い合わせください)、臨床試験結果データ、文献レビュー、リファービッシュ市場および製品ベース分析を含めるようにカスタマイズできます。対象競合他社の市場分析は、技術ベースの分析から市場ポートフォリオ戦略まで分析できます。必要な競合他社のデータを、必要な形式とデータ スタイルでいくつでも追加できます。当社のアナリスト チームは、粗い生の Excel ファイル ピボット テーブル (ファクト ブック) でデータを提供したり、レポートで利用可能なデータ セットからプレゼンテーションを作成するお手伝いをしたりすることもできます。


