

食品用途向けオメガ3の世界市場規模、シェア、トレンド分析レポート
Market Size in USD Billion
CAGR :
% 
 USD
2.34 Billion
USD
4.98 Billion
2025
2033
USD
2.34 Billion
USD
4.98 Billion
2025
2033
| 2026 –2033 | |
| USD 2.34 Billion | |
| USD 4.98 Billion | |
| % | |
|
食品用途向けオメガ3の世界市場区分、タイプ別(α-リノレン酸(ALA)、エイコサペンタエン酸(EPA)、ドコサヘキサエン酸(DHA)、エイコサペンタエン酸(EPA)+ドコサヘキサエン酸(DHA))、供給源別(海洋由来、藻類由来、植物由来)、形態別(油および粉末)、用途別(機能性食品、菓子およびチョコレート製品、スポーツ栄養、栄養補助食品、乳児用調合乳など)、機能別(食品強化、骨および関節の健康、皮膚の健康、髪の健康、爪の健康など) - 2033年までの業界動向および予測
食品用途向けオメガ 3 の世界市場規模と成長率はどれくらいですか?
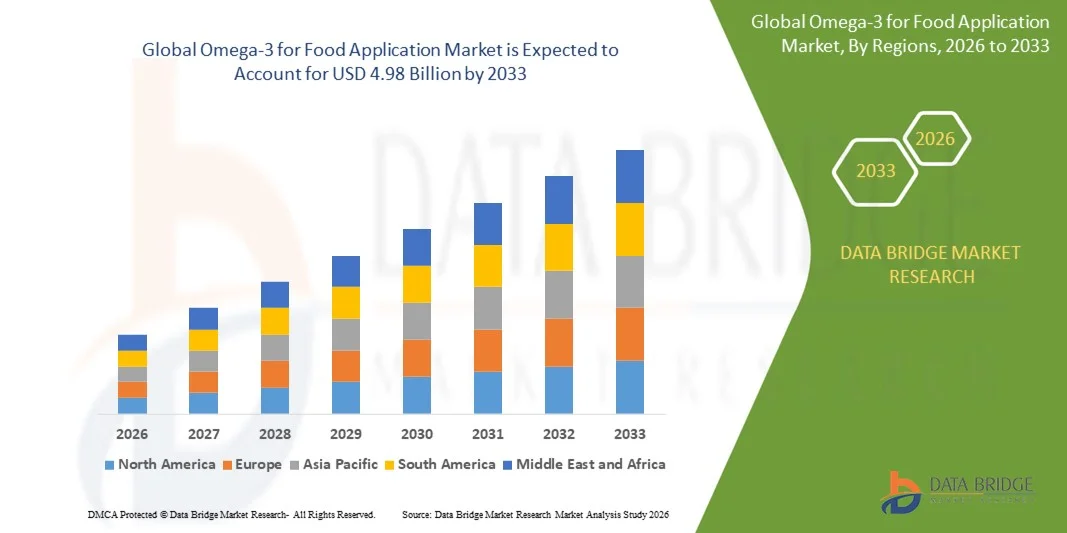
- 食品用途向けオメガ3の世界市場規模は2025年に23億4000万米ドルと評価され、予測期間中に9.9%のCAGRで成長し、2033年までに49億8000万米ドル に達すると予想されています。
- 機能性食品、強化食品、健康志向の食品に対する消費者の需要の高まりが、食品用途向けオメガ3市場の成長を牽引しています。オメガ3脂肪酸の心臓の健康、認知機能サポート、抗炎症効果への認知度向上により、メーカーはこれらの成分をベーカリー、乳製品、飲料、スナック製品に積極的に取り入れています。
- 自然食品やオーガニック食品への嗜好の高まりと、砂糖の摂取、肥満、糖尿病への懸念が相まって、オメガ3強化食品の採用がさらに加速しています。抗炎症作用、心臓保護作用、脳の健康維持といった機能的メリットは、世界的に市場の魅力を高めています。
食品用途市場におけるオメガ 3 の主なポイントは何ですか?
- 消費者の健康意識の高まり、可処分所得の増加、そして食生活の嗜好の変化は、食品用途向けオメガ3市場にプラスの影響を与える重要な要因です。さらに、製品イノベーションと新たな配合戦略は、市場参加者にとって大きな利益をもたらす機会をもたらします。
- オメガ3の原料は従来の代替品に比べて高価であり、さらに安価な人工栄養強化剤が存在することが、成長を阻害する可能性があります。新興地域では、オメガ3の健康効果に関する消費者の認知度が低いため、普及が困難になると予測されます。
- 課題にもかかわらず、進行中の研究開発、製品の多様化、およびマーケティングイニシアチブにより、世界の食品用途向けオメガ3市場の長期的な成長が維持されると予想されます。
- 北米は、米国とカナダ全土における強化食品、栄養補助食品、機能性飲料に対する高い消費者需要に牽引され、2025年には食品用途向けオメガ3市場において36.2%の収益シェアを獲得し、市場をリードしました。
- アジア太平洋地域は、健康意識の高まり、都市化の進展、EPAとDHAを豊富に含む機能性食品の需要増加により、2026年から2033年にかけて7.1%という最も高いCAGRを記録すると予測されています。
- DHAセグメントは、乳児用調製粉乳、強化乳製品、脳の健康飲料、栄養補助食品での広範な使用に支えられ、2025年には41.6%の収益シェアで市場を支配しました。
報告書の範囲と食品用途向けオメガ3市場セグメンテーション
|
特性 |
食品用途向けオメガ3 主要市場インサイト |
|
対象分野 |
|
|
対象国 |
北米
ヨーロッパ
アジア太平洋
中東およびアフリカ
南アメリカ
|
|
主要市場プレーヤー |
|
|
市場機会 |
|
|
付加価値データ情報セット |
データブリッジマーケットリサーチがまとめた市場レポートには、市場価値、成長率、セグメンテーション、地理的範囲、主要プレーヤーなどの市場シナリオに関する洞察に加えて、専門家による詳細な分析、価格設定分析、ブランドシェア分析、消費者調査、人口統計分析、サプライチェーン分析、バリューチェーン分析、原材料/消耗品の概要、ベンダー選択基準、PESTLE分析、ポーター分析、規制の枠組みも含まれています。 |
食品用途向けオメガ 3 市場の主な傾向は何ですか?
栄養強化食品やマルチオメガ3食品原料の需要増加
- 食品用途向けオメガ3市場では、栄養価、味、機能的利点を向上させる植物油、藻類抽出物、食物繊維とのブレンドを含む、栄養価が高く、多機能でクリーンラベルの配合に向けた大きな成長が見られます。
- メーカーは、心臓の健康、認知機能、抗炎症特性をサポートし、パン、乳製品、飲料、乳児用栄養製品など幅広い用途に使用できる多目的オメガ3ソリューションを開発しています。
- 消費者は合成代替品よりも、天然、安全、かつ機能的なオメガ 3 成分を求める傾向が強まっており、食品、飲料、栄養補助食品の分野での採用が進んでいます。
- 例えば、DSM、BASF、Croda、ADM、Aker BioMarineなどの企業は、強化食品や飲料に適したマイクロカプセル化、粉末化、ブレンドオイルを導入することで、オメガ3製品ポートフォリオを拡大しています。
- 心臓血管の健康、乳児の栄養、クリーンラベルの消費に対する意識の高まりが、世界市場での導入を加速させている。
- 消費者の健康、機能性、天然成分への関心が高まるにつれ、食品用途のオメガ3は、食品および栄養補助食品業界全体の製品イノベーションの中心であり続けると予想されます。
食品用途向けオメガ 3 市場の主な推進要因は何ですか?
- 機能性、植物性、海洋性のオメガ3成分の需要の高まりにより、食品用途におけるオメガ3の採用が世界中で急増しています。
- 例えば、2025年には、DSM、BASF、Crodaが強化乳製品、飲料、乳児栄養用途向けにマイクロカプセル化および粉末化されたオメガ3製品を拡充した。
- 心臓の健康、乳児の脳の発達、抗炎症効果、認知サポートに対する意識の高まりにより、米国、ヨーロッパ、アジア太平洋地域で需要が高まっています。
- マイクロカプセル化、抽出、ブレンド技術の進歩により、安定性、味のマスキング、幅広い食品への適用性が向上しました。
- 健康志向と環境意識の高い消費者の牽引により、オーガニック、非遺伝子組み換え、クリーンラベル食品への嗜好が高まり、市場拡大がさらに促進されている。
- 継続的な研究開発、新製品の発売、コラボレーション、世界的な流通の拡大により、食品用途向けオメガ3市場は予測期間中に堅調な成長を維持すると予想されます。
食品用途向けオメガ 3 市場の成長を阻害する要因は何ですか?
- 海洋および植物由来のオメガ3オイルは、抽出、精製、安定化にかかるコストが高いため、価格に敏感な地域では購入が困難です。
- 例えば、2024年から2025年にかけて、魚油や藻類の生産、原材料の入手可能性、エネルギーコストの変動が、いくつかの企業の製造量に影響を与えました。
- 新規食品の承認、食品安全、ラベル遵守に関する厳格な規制要件により、運用上の複雑さが増す
- 新興市場では、心臓血管、認知、乳児の栄養サポートなどオメガ3の利点に関する消費者の認識が限られており、導入が制限されている。
- 亜麻仁油、チアオイル、その他の植物油などの安価な代替品との競争は、価格設定と差別化に圧力をかけている。
- 企業は、コスト効率の高い抽出、安定した配合、規制の整合、消費者教育に重点を置き、食品用途における高品質のオメガ3の採用を世界的に拡大することで、これらの課題に取り組んでいます。
食品用途のオメガ 3 市場はどのようにセグメント化されていますか?
市場は、タイプ、ソース、形式、用途、機能に基づいて分類されています。
- タイプ別
食品用途向けオメガ3市場は、α-リノレン酸(ALA)、エイコサペンタエン酸(EPA)、ドコサヘキサエン酸(DHA)、EPA+DHAに分類されます。DHAセグメントは、乳児用調製粉乳、強化乳製品、脳の健康飲料、栄養補助食品における広範な使用に支えられ、2025年には41.6%の収益シェアで市場を支配しました。DHAは、認知発達、目の健康、神経系のサポートに対する効果が実証されているため、広く好まれています。マイクロカプセル化された形態での高い安定性と、ベーカリー、飲料、粉末製剤との適合性により、産業における採用がさらに拡大しています
EPA+DHAセグメントは、心臓機能向上のための機能性食品、スポーツ栄養、抗炎症製剤における相乗効果のあるブレンドの需要増加に牽引され、2026年から2033年にかけて最も高いCAGRで成長すると予測されています。予防栄養への意識の高まり、心血管疾患の発症率の上昇、そして海洋・藻類由来の製品イノベーションは、世界市場における需要を継続的に加速させるでしょう。
- 供給源別
食品用途向けオメガ3市場は、海洋由来、藻類由来、植物由来に分類されます。海洋由来セグメントは、強化飲料、乳製品、スプレッド、栄養補助食品に使用される魚油、オキアミ油、濃縮海洋性トリグリセリドの供給の好調さに牽引され、2025年には58.3%と最大のシェアを占めました。海洋由来のオメガ3は、EPAとDHAの含有量が高く、世界中の食品業界で広く規制されていることから、依然として最も確立された供給源です
藻類由来セグメントは、乳児用調合乳、機能性飲料、クリーンラベル食品、プレミアム栄養製品に適した植物由来、持続可能、非遺伝子組み換え、ビーガン代替品への関心の高まりを背景に、2026年から2033年にかけて最も高いCAGRを記録すると予想されています。微細藻類発酵、コスト効率の高い生産、環境持続可能性への投資増加は、米国、欧州、アジア太平洋地域における藻類の導入をさらに促進するでしょう。
- フォーム別
市場はオイルとパウダーの2つの形態に分かれています。オイルセグメントは、強化飲料、乳製品、乳児用調合乳、そして料理用途での高い利用率により、2025年には67.2%の収益シェアで市場をリードしました。オイルは優れた吸収性、高い純度、そして従来の食品システム全体への幅広い適用性を備えています。海洋および藻類由来のオメガ3オイルは、特に高級食品や栄養補助食品分野において、EPAおよびDHAの強化における業界標準であり続けています。
粉末セグメントは、焼き菓子、グミ、菓子、ドライミックス、食事代替品、粉末飲料への採用増加に支えられ、2026年から2033年にかけて最も高いCAGRで成長すると予測されています。粉末オメガ3は、優れた安定性、味のマスキング、長い保存期間、そして容易な混合といった特徴を備えており、大規模な産業用途や植物由来食品メーカーに最適です。
- 用途別
食品用途向けオメガ3市場は、機能性食品、菓子・チョコレート製品、スポーツ栄養、栄養補助食品、乳児用調合乳、その他に分類されています。機能性食品セグメントは、心臓に良い食品、脳を活性化させる飲料、強化乳製品代替品、スプレッド、シリアル、健康バーの需要増加に牽引され、2025年には36.4%の収益シェアで市場をリードしました。予防的栄養やライフスタイルに基づいた栄養に対する消費者の嗜好の高まりが、継続的な拡大を支えています
スポーツ栄養セグメントは、抗炎症効果、筋肉の回復、持久力向上、関節の健康サポートへの関心の高まりにより、2026年から2033年にかけて最も高いCAGRで成長すると予測されています。オメガ3を配合したプロテインパウダー、ジェル、ハイドレーションドリンク、パフォーマンスフードの消費量の増加は、北米、欧州、アジア太平洋地域における急速な成長を牽引しています。
- 機能別
市場は、食品栄養強化、骨と関節の健康、皮膚の健康、髪の健康、爪の健康、その他に分類されています。食品栄養強化セグメントは、乳製品、飲料、ベーカリー製品、乳児用調製粉乳、シリアル、栄養スナックへのオメガ3の配合増加に支えられ、2025年には44.8%の収益シェアで市場を支配しました。栄養強化、クリーンラベル製剤、予防的健康への政府の重点化は、産業界における広範な採用を促進しています
スキンヘルス分野は、内側から美しくなる製品、アンチエイジング機能性食品、コラーゲン配合食品、皮膚科医による栄養補助食品への需要の高まりを背景に、2026年から2033年にかけて最も高いCAGRで成長すると予測されています。オメガ3脂肪酸は、水分補給、炎症抑制、皮膚バリア機能の修復に効果があるため、強化スナック、飲料、機能性菓子への活用が加速しています。
食品用途向けオメガ 3 市場で最大のシェアを占めている地域はどこですか?
- 北米は、米国とカナダにおける強化食品、栄養補助食品、機能性飲料への高い消費者需要に牽引され、2025年には食品用途向けオメガ3市場において36.2%の収益シェアを占め、市場をリードしました。心臓の健康、脳の発達、予防栄養に対する強い意識が、乳製品、乳児用調合乳、健康バー、スポーツ栄養におけるオメガ3の幅広い利用を支えています。
- 大手メーカーは、カプセル化、安定化、消臭、そしてより幅広い食品カテゴリーへの統合といった革新を通じて、EPA、DHA、藻類由来のオメガ3製品の提供を拡大しています。健康強調表示、クリーンラベル基準、非遺伝子組み換え認証に関する支援的な規制は、この地域のリーダーシップをさらに強化しています。
- 可処分所得の増加、小売業の浸透率の向上、高品質の栄養成分に対する消費者の嗜好により、複数の食品および栄養補助食品分野での急速な導入が引き続き促進されています。
米国における食品用途向けオメガ3市場の洞察
米国は北米において、オメガ3強化飲料、プロテインスナック、乳製品代替品、シリアル、プレミアム強化食品への旺盛な需要に支えられ、依然として最大の供給国となっています。メーカーは、純度、風味、そしてバイオアベイラビリティの向上を目指し、高度な脂質抽出、藻類発酵、マイクロカプセル化技術に投資しています。eコマースの普及率向上と、パーソナライズされた栄養、機能性食品、心臓に良い食事への関心の高まりは、主流カテゴリーからプレミアムカテゴリーまで、市場の成長を加速させ続けています。
カナダの食品用途向けオメガ3市場に関する洞察
カナダは、天然、オーガニック、そして持続可能な方法で調達されたオメガ3原料への嗜好の高まりにより、市場への大きな貢献を果たしています。食品・飲料メーカーは、強化飲料、インスタントスナック、乳製品、乳児用栄養製品など、ポートフォリオを拡大しています。心血管の健康、オメガを豊富に含む食事、そして予防医療への意識の高まりは、スーパーマーケット、専門店、そしてオンラインチャネルにおけるオメガ3の普及を後押ししています。政府主導の健康促進策と生活習慣病の増加も、市場拡大を後押ししています。
アジア太平洋地域における食品用途向けオメガ3市場に関する洞察
アジア太平洋地域は、健康意識の高まり、都市化の進展、そしてEPAとDHAを豊富に含む機能性食品の需要増加に牽引され、2026年から2033年にかけて7.1%という最も高いCAGRを記録すると予測されています。中国、日本、インド、韓国などの国々では、飲料、ベーカリー製品、栄養補助食品、乳児用調合乳にオメガ3脂肪酸が急速に取り入れられています。eコマースネットワークの拡大、強力なデジタルマーケティングの存在感、そして可処分所得の増加は、多様な消費者層における製品のアクセスと採用を促進しています。
中国における食品用途向けオメガ3市場に関する洞察
中国は、魚油、藻類由来のオメガ3、マイクロカプセル化粉末などの強力な生産能力に支えられ、アジア太平洋地域をリードしています。認知機能や心血管系への効果に対する意識の高まりにより、飲料、乳製品、機能性栄養製品全般の需要は引き続き増加しています。研究開発、発酵技術、持続可能な調達への多額の投資は、国内消費と輸出力を強化しています。
日本における食品用途向けオメガ3市場に関する洞察
日本では、機能性飲料、ダイエット食品、伝統料理などにおける高品質で高純度のオメガ3成分に対する消費者の高い嗜好に支えられ、市場は安定的に成長しています。カプセル化、消臭、無味無臭といった革新的な技術は、健康志向の消費者にとって引き続き魅力的なものとなっています。また、強力な小売インフラと支援的な規制枠組みも、食品およびウェルネス分野全体におけるオメガ3の採用を促進しています。
インドにおける食品用途向けオメガ3市場の洞察
インドは、心血管の健康、認知発達、そして栄養不足への意識の高まりにより、有望な成長市場として台頭しています。オメガ3脂肪酸を豊富に含む飲料、包装食品、栄養補助食品、そして乳児用栄養食品の需要が急速に増加しています。eコマースの成長、可処分所得の増加、そしてクリーンラベル、植物由来、そして栄養強化食品への消費者の関心が、力強い市場拡大を支えています。
韓国における食品用途向けオメガ3市場に関する洞察
韓国は、機能性飲料、栄養強化スナック、ダイエット志向の食品への高い関心に牽引され、この地域の成長に大きく貢献しています。ウェルネストレンド、Kヘルス文化、そしてデジタルメディアの強い影響力により、オメガ3強化製品への移行が加速しています。製品フォーマット、プレミアムパッケージ、そして藻類由来のオメガ3ソリューションにおける継続的なイノベーションは、国内市場と輸出志向の両セグメントにおける市場浸透をさらに加速させています。
食品用途向けオメガ 3 市場のトップ企業はどれですか?
食品用途のオメガ 3 業界は、主に、次のような定評ある企業によって牽引されています。
- DSM(オランダ)
- BASF SE(ドイツ)
- Croda International Plc(英国)
- アーカー・バイオマリン(ノルウェー)
- ADM(アーチャー・ダニエルズ・ミッドランド社)(米国)
- セラナ社(米国)
- 虎台バイオファームリソース株式会社(中国)
- アラスカオメガ(米国)
- キンオメガバイオファーム社(米国)
- Pharma Marine AS(ノルウェー)
- GC Rieber VivoMega AS (ノルウェー)
- サンマークLLC(米国)
- アルジュナ・ナチュラル・プライベート・リミテッド(インド)
- コノオイルズLLC(米国)
- キングダムウェイニュートリション社(中国)
- ポラリス社(米国)
- バイオサーチ・ライフ(スペイン)
食品用途向けオメガ3の世界市場における最近の動向とは?
- 2025年3月、Natacは高品質の魚油を使用し、食品、栄養補助食品、ペット栄養業界向けに開発されたオメガ3スター製品を発表しました。この発売により、拡大するオメガ3ソリューション市場における同社の地位が強化されます。
- 2023年10月、DSMフィルメニッヒは北米市場でライフ社のオメガO3020を発売しました。これは、標準的な魚油の天然EPAとDHAの比率に匹敵し、優れた効能を提供する、藻類由来のオメガ3を初めて単一原料として提供する製品です。この製品は、植物由来のオメガ3代替品の普及を加速させると期待されています。
- 2023年5月、Nuseed Globalは、人間の栄養と栄養補助食品業界の進化するニーズに応えるために特別に設計された、オメガ3を豊富に含む植物性オイル「Nuseed Nutriterra」を発表しました。このイノベーションにより、持続可能な非海洋性オメガ3源の入手しやすさが向上します。
- 2023年3月、Epaxは高濃度オメガ3成分の生産と純度の向上を目的とした分子蒸留技術に4,000万米ドルを投資しました。この投資は、高品質のオメガ3ソリューションの発展に向けた同社のコミットメントを強調するものです。
- 2022年10月、ネイチャーズ・バウンティは、心臓、関節、皮膚の健康をサポートする植物由来のオメガ3サプリメントを新たに発売しました。このサプリメントは、1,000mgの植物性藻類油を配合しています。この製品紹介は、クリーンラベルやヴィーガン向けのオメガ3サプリメントに対する消費者の需要の高まりを浮き彫りにしています。
SKU-
世界初のマーケットインテリジェンスクラウドに関するレポートにオンラインでアクセスする

- インタラクティブなデータ分析ダッシュボード
- 成長の可能性が高い機会のための企業分析ダッシュボード
- カスタマイズとクエリのためのリサーチアナリストアクセス
- インタラクティブなダッシュボードによる競合分析
- 最新ニュース、更新情報、トレンド分析
- 包括的な競合追跡のためのベンチマーク分析のパワーを活用
調査方法
データ収集と基準年分析は、大規模なサンプル サイズのデータ収集モジュールを使用して行われます。この段階では、さまざまなソースと戦略を通じて市場情報または関連データを取得します。過去に取得したすべてのデータを事前に調査および計画することも含まれます。また、さまざまな情報ソース間で見られる情報の不一致の調査も含まれます。市場データは、市場統計モデルと一貫性モデルを使用して分析および推定されます。また、市場シェア分析と主要トレンド分析は、市場レポートの主要な成功要因です。詳細については、アナリストへの電話をリクエストするか、お問い合わせをドロップダウンしてください。
DBMR 調査チームが使用する主要な調査方法は、データ マイニング、データ変数が市場に与える影響の分析、および一次 (業界の専門家) 検証を含むデータ三角測量です。データ モデルには、ベンダー ポジショニング グリッド、市場タイムライン分析、市場概要とガイド、企業ポジショニング グリッド、特許分析、価格分析、企業市場シェア分析、測定基準、グローバルと地域、ベンダー シェア分析が含まれます。調査方法について詳しくは、お問い合わせフォームから当社の業界専門家にご相談ください。
カスタマイズ可能
Data Bridge Market Research は、高度な形成的調査のリーダーです。当社は、既存および新規のお客様に、お客様の目標に合致し、それに適したデータと分析を提供することに誇りを持っています。レポートは、対象ブランドの価格動向分析、追加国の市場理解 (国のリストをお問い合わせください)、臨床試験結果データ、文献レビュー、リファービッシュ市場および製品ベース分析を含めるようにカスタマイズできます。対象競合他社の市場分析は、技術ベースの分析から市場ポートフォリオ戦略まで分析できます。必要な競合他社のデータを、必要な形式とデータ スタイルでいくつでも追加できます。当社のアナリスト チームは、粗い生の Excel ファイル ピボット テーブル (ファクト ブック) でデータを提供したり、レポートで利用可能なデータ セットからプレゼンテーションを作成するお手伝いをしたりすることもできます。

