
ヨーロッパの運用技術市場、コンポーネント別(ハードウェア、ソフトウェア/プラットフォーム、サービス)、導入(オンプレミス、ハイブリッド、クラウド)、組織規模(中小企業、大企業)、接続性(有線、無線)、技術(監視制御およびデータ収集(SCADA)、分散制御システム(DCS)、プロセス制御ドメイン(PCD)、プログラマブルロジックコントローラー(PLC)、安全計装システム(SIS)、ビル管理/自動化システム(BAS))、エンドユーザー(自動車および輸送、ビルおよびインフラストラクチャ、エネルギーおよび公共事業、食品および飲料、ライフサイエンス、海洋および港湾、金属および鉱業、石油およびガス、化学薬品、パルプおよび紙、その他)、国別(ドイツ、英国、フランス、スイス、イタリア、スペイン、オランダ、ロシア、ベルギー、トルコ、その他のヨーロッパ諸国)、2028年までの市場動向および予測
 市場分析と洞察: ヨーロッパの運用技術市場
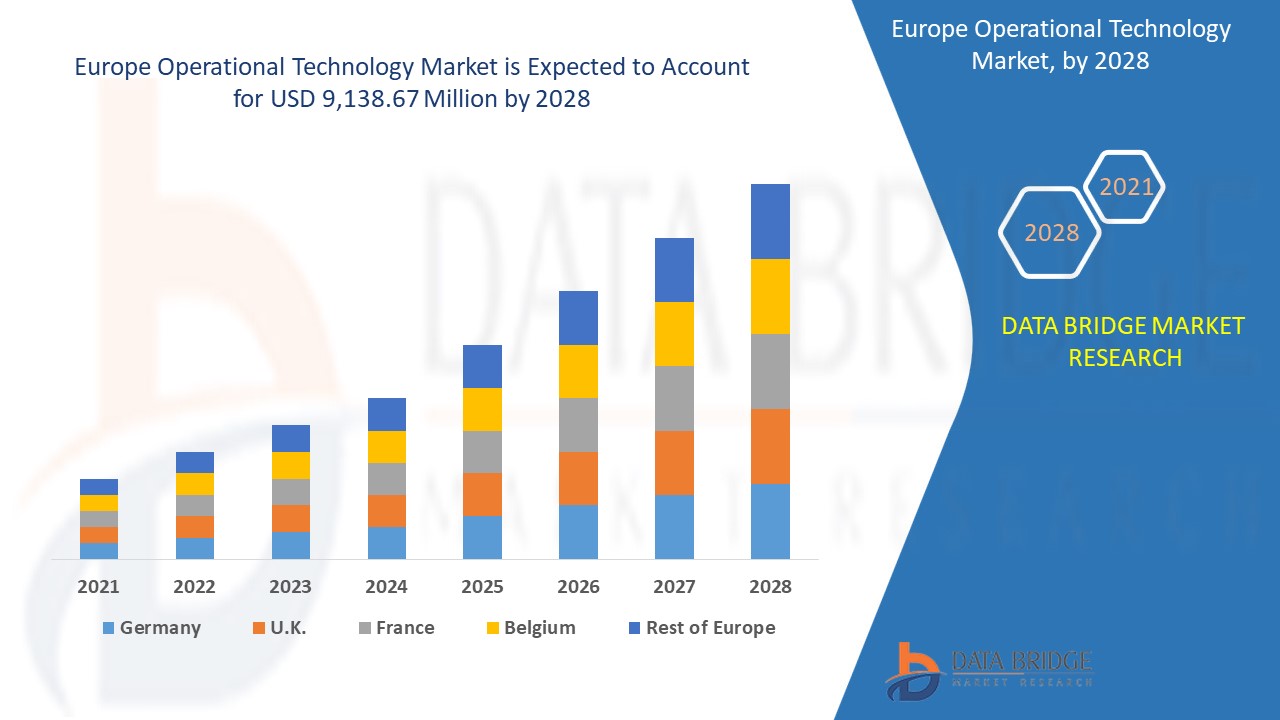
ヨーロッパの運用技術市場は、2021年から2028年の予測期間に大幅な成長が見込まれています。データブリッジマーケットリサーチは、市場は予測期間中に6.7%のCAGRで成長し、2028年までに91億3,867万米ドルに達すると分析しています。制御および監視機器の人気の高まりは、市場の成長を促進する主な要因です。
運用技術システムは、物理デバイスを使用して直接監視することで変化の原因を検出するハードウェアとソフトウェアです。運用技術 (OT) は、監視制御およびデータ収集 (SCADA)、分散制御システム (DCS)、プロセス制御ドメイン (PCD)、プログラマブル ロジック コントローラー (PLC) などのさまざまなテクノロジを使用してアプリケーションを実行します。これは、発電所、製紙業界など、どこにでも導入できる産業用制御システムで広く使用されています。最近では、運用技術と情報技術 (IT) システムの統合または収束により、産業用モノのインターネット (IIOT) が開発されています。
市場を牽引している要因としては、スマート自動化ソリューションの需要の高まりと、OT システムと IT システムの統合の増加が挙げられます。ただし、データ プラットフォーム上の OT システムのセキュリティ リスクは、抑制要因になる可能性があります。ヨーロッパの運用技術市場は、建物やインフラ業界での運用技術の導入が増加しているため、成長が加速しており、これは市場にとってチャンスになる可能性があります。OT システムの重要な機能の障害は、この地域の市場成長にとって大きな課題となる可能性があります。
この運用技術市場レポートでは、市場シェア、新開発、製品パイプライン分析、国内および現地の市場プレーヤーの影響の詳細を提供し、新たな収益源、市場規制の変更、製品承認、戦略的決定、製品発売、地理的拡大、市場における技術革新の観点からの機会を分析します。分析と市場シナリオを理解するには、アナリスト概要についてお問い合わせください。当社のチームが、希望する目標を達成するための収益影響ソリューションの作成をお手伝いします。
 欧州の運用技術市場の範囲と市場規模
ヨーロッパの運用技術市場は、コンポーネント、展開、組織規模、接続性、テクノロジー、エンドユーザーに基づいてセグメント化されています。セグメント間の成長は、ニッチな成長分野と市場にアプローチするための戦略を分析し、コアアプリケーション領域とターゲット市場の違いを決定するのに役立ちます。
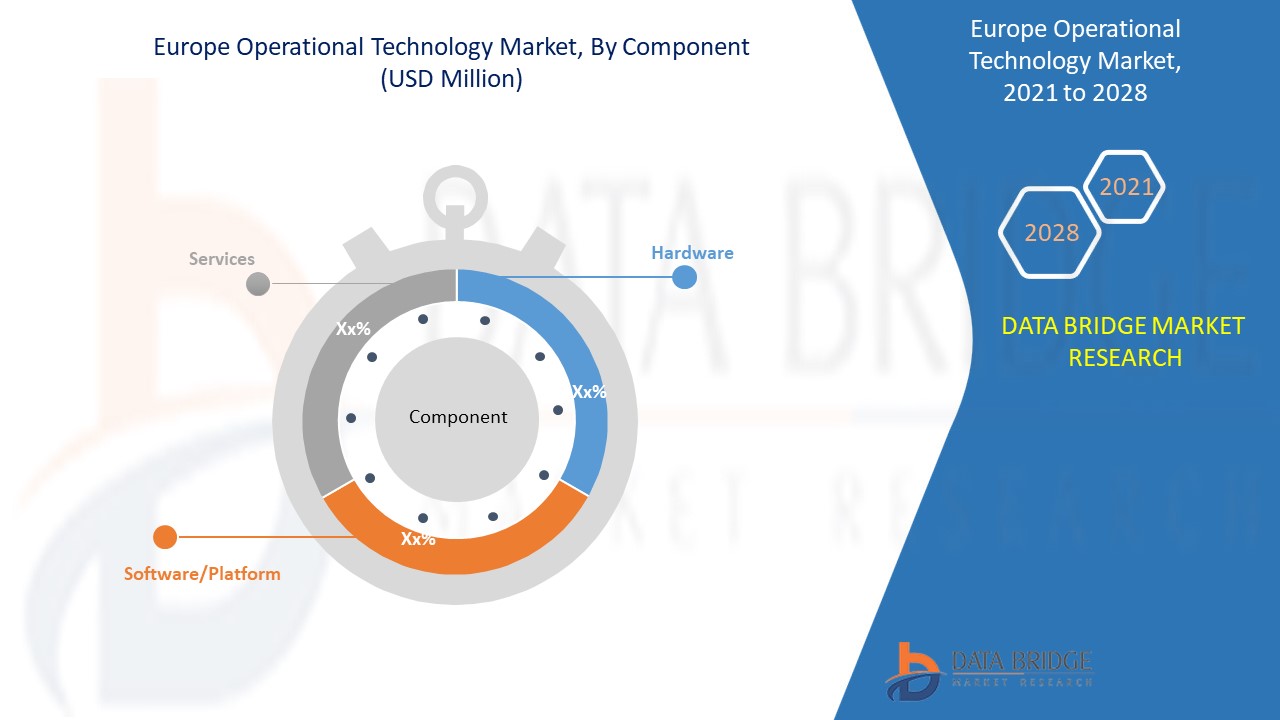
- コンポーネントに基づいて、ヨーロッパの運用技術市場は、ハードウェア、ソフトウェア/プラットフォーム、およびサービスに分類されます。ヨーロッパ全土の業界でスマート自動化ソリューションの需要が高まっているため、ハードウェアセグメントは2021年に市場で最大のシェアを占めると予想されています。
- 導入に基づいて、ヨーロッパの運用技術市場はオンプレミス、ハイブリッド、クラウドに分類されます。クラウドセグメントは、2021年に市場で最大のシェアを占めると予想されています。この成長は、ヨーロッパ諸国の製造、ライフサイエンス、パルプおよび製紙などのさまざまな業界で、セキュリティの強化、生産効率の向上、解決時間の短縮に対する需要の高まりに起因しています。
- 組織規模に基づいて、ヨーロッパの運用技術市場は中小企業と大企業に分かれています。大企業セグメントは、2021年に市場で最大のシェアを占めると予想されています。これは主に、ヨーロッパ全土の業界でスマート自動化ソリューションの需要が高まり、セキュリティが強化され、生産効率が向上したためです。
- 接続性に基づいて、ヨーロッパの運用技術市場は有線と無線に分かれています。監視と制御に非常に効率的であることが証明されているスマートな自動化ソリューションの需要が高まっているため、無線セグメントは2021年に市場で最大のシェアを占めると予想されています。
- 技術に基づいて、ヨーロッパの運用技術市場は、監視制御およびデータ収集 (SCADA)、分散制御システム (DCS)、プロセス制御ドメイン (PCD)、プログラマブルロジックコントローラー (PLC)、安全計装システム (SIS)、およびビル管理/自動化システム (BAS) に分類されます。SCADA セグメントは、運用技術と情報技術の融合に対する需要の高まりにより、2021 年に市場で最大のシェアを占めると予想されています。これは、非常に正確で効率的であり、業界の生産性を大幅に向上させるのに役立ちます。
- エンドユーザーに基づいて、ヨーロッパの運用技術市場は、自動車および輸送、建物およびインフラ、エネルギーおよび公共事業、食品および飲料、ライフサイエンス、海洋および港湾、金属および鉱業、石油およびガス、化学品、パルプおよび紙、その他に分類されます。新興経済における急速な工業化と、生産性向上のための既存システムのアップグレードの必要性の高まりにより、石油およびガス部門は2021年に市場で最大のシェアを占めると予想されています。
ヨーロッパの運用技術 市場の国別分析
ヨーロッパの運用技術市場が分析され、コンポーネント、展開、組織規模、接続性、テクノロジー、エンドユーザー別に市場規模情報が提供されます。
ヨーロッパの運用技術市場レポートで取り上げられている国は、英国、ドイツ、フランス、スイス、イタリア、スペイン、オランダ、ロシア、ベルギー、トルコ、およびその他のヨーロッパ諸国です。
英国は、地域のさまざまな業界で制御および監視機器の人気が高まっているため、運用技術市場を支配しています。
レポートの国別セクションでは、市場の現在および将来の傾向に影響を与える国内市場における個別の市場影響要因と規制の変更も提供しています。新規販売、交換販売、国の人口統計、規制行為、輸出入関税などのデータ ポイントは、各国の市場シナリオを予測するために使用される主要な指標の一部です。また、国別データの予測分析を提供する際には、ヨーロッパ ブランドの存在と可用性、地元および国内ブランドとの激しい競争により直面する課題、販売チャネルの影響も考慮されます。
運用技術の需要の高まり
ヨーロッパの運用技術市場では、売上、コンポーネント売上、運用技術の技術開発の影響、市場へのサポートを伴う規制シナリオの変化など、各国の産業成長に関する詳細な市場分析も提供しています。データは 2019 年の履歴期間について利用可能です。
競争環境とヨーロッパの運用技術市場シェア分析
ヨーロッパの運用技術市場の競争状況では、競合他社ごとに詳細が提供されます。含まれる詳細には、会社概要、会社の財務状況、収益、市場の可能性、研究開発への投資、新しい市場への取り組み、ヨーロッパでのプレゼンス、生産拠点と施設、会社の強みと弱み、製品の発売、製品試験パイプライン、製品の承認、特許、製品の幅と広さ、アプリケーションの優位性、および技術ライフライン曲線が含まれます。提供されている上記のデータ ポイントは、ヨーロッパの運用技術市場に対する会社の重点にのみ関連しています。
レポートで取り上げられている主な企業は、Honeywell International Inc.、ABB、SCADAfence、Forcepoint、General Electric、Rockwell Automation、Inc.、Fortinet、Inc.、IBM Corporation、Advantech Co.、Ltd.、Emerson Electric Co.、Wipro Limited、Schneider Electric、SAP SE、Cisco Systems、Inc.、Accenture、Yokogawa Electric Corporation、Huawei Technologies Co.、Ltd.、Oracle Corporationなどです。 DBMRアナリストは競争上の強みを理解しており、各競合他社の競合分析を個別に提供しています。 世界中の企業によってさまざまな製品開発も開始されており、これもヨーロッパの運用技術市場の成長を加速させています。
例えば、
- 2021 年 5 月、ロックウェル・オートメーション社はシスコ社と提携しました。この提携は主に同社の脅威検出サービスの拡大に焦点を当てています。この提携の主な特徴は、情報技術と運用技術向けのサイバービジョンシステムを使用した脅威検出の改善です。これは、両社が市場と顧客基盤を拡大するための戦略的な動きでした。
- 2020年2月、シュナイダーエレクトリックは、アップグレードされた新しいEcoStruxure Power SCADAオペレーションソフトウェアを発売しました。この新製品の主な特徴は、タイムリーな対応のためのリアルタイムのビジョンと制御です。サイバーセキュリティの問題とグラフィックスのカスタマイズの問題の増加により、アップグレードされています。このソフトウェアは安全性、信頼性、コンプライアンスも提供しており、同社の市場シェア拡大に役立ちます。
パートナーシップ、ジョイントベンチャー、その他の戦略により、カバレッジとプレゼンスが拡大し、企業の市場シェアが高まります。また、組織は規模の拡大を通じて、ヨーロッパの運用技術市場への提供内容を改善できるというメリットも得られます。
SKU-
世界初のマーケットインテリジェンスクラウドに関するレポートにオンラインでアクセスする

- インタラクティブなデータ分析ダッシュボード
- 成長の可能性が高い機会のための企業分析ダッシュボード
- カスタマイズとクエリのためのリサーチアナリストアクセス
- インタラクティブなダッシュボードによる競合分析
- 最新ニュース、更新情報、トレンド分析
- 包括的な競合追跡のためのベンチマーク分析のパワーを活用
目次
- introduction
- OBJECTIVES OF THE STUDY
- MARKET DEFINITION
- OVERVIEW OF EUROPE operational technology MARKET
- Currency and Pricing
- LIMITATIONS
- MARKETS COVERED
- MARKET SEGMENTATION
- MARKETS COVERED
- geographicAL scope
- years considered for the study
- DBMR TRIPOD DATA VALIDATION MODEL
- primary interviews with key opinion leaders
- DBMR MARKET POSITION GRID
- vendor share analysis
- Multivariate Modeling
- component timeline curve
- MARKET END-USER COVERAGE GRID
- secondary sourcEs
- assumptions
- EXECUTIVE SUMMARY
- premium insights
- TECHNOLOGY LANDSCAPE
- Supervisory Control and Data Acquisition (SCADA)
- Distributed Control Systems (DCS)
- Process Control Domains (PCD)
- Programmable Logic Controllers (PLC)
- Safety Instrumented Systems (SIS)
- Building Management/ Automation Systems (BAS)
- Computer Numerical Control (CNC)
- market overview
- drivers
- Rising demand for merging Operational Technology (OT) & Information Technology (IT)
- Growing demand for Smart Automated Solutions
- Rapid industrialization in emerging economies
- Increasing popularity of controlling and monitoring equipment
- Quick resolution time and cost effectiveness of operational technology
- RESTRAINTS
- security risk in ot over data platform.
- Multi-level dependency involved in Operational Technology (OT)
- Issues related to interoperability while connecting new system with earlier installed systems
- OPPORTUNITIES
- Growing demand in food, pulp & paper industries for Operational Technology
- Increase in Operational Technology deployments in Buildings and Infrastructure industries
- Operational Technology as a Service for rapidly growing Life Sciences industry
- Growing demand in Oil & Gas Industry for Operational Technology
- CHALLENGES
- Upgradation of OT systems with zero production loss
- Failures in Critical Functioning of OT systems
- Lack of skilled work force for Operational Technology Systems
- IMPACT OF COVID-19 on Europe Operational technology Market
- ANALYSIS ON IMPACT OF COVID-19 ON OPERATIONAL TECHNOLOGY MARKET
- IMPACT ON PRICE
- IMPACT ON DEMAND AND SUPPLY CHAIN
- AFTERMATH OF COVID-19 AND GOVERNMENT INITIATIVE TO BOOST THE MARKET
- STRATEGIC DECISIONS FOR MANUFACTURERS AFTER COVID-19 TO GAIN COMPETITIVE MARKET SHARE
- CONCLUSION
- Europe Operational Technology MARKET, BY component
- overview
- hardware
- Software/Platform
- Incident Response
- Anomaly Detection
- OT Endpoint Security
- OT Network Segmentation
- Others
- services
- Professional Services
- Managed Services
- Europe operational technology MARKET, BY Deployment
- overview
- Cloud
- Hybrid
- On-Premise
- Europe operational technology MARKET, BY Organization Size
- overview
- Large Enterprise
- Small & Medium Size Business
- Europe operational technology MARKET, BY Connectivity
- overview
- Wireless
- Whart
- ISA 100
- WIFI
- Bluetooth
- Zigbee
- Satellite Technologies
- Cellular Technologies
- Wired
- Ethernet
- Profinet
- Modbus
- Foundation Fieldbus
- Others
- Europe operational technology MARKET, BY TECHNOLOGY
- overview
- Supervisory Control and Data Acquisition (SCADA)
- Programmable Logic Controllers (PLC)
- Safety Instrumented Systems (SIS)
- Distributed Control Systems (DCS)
- Building Management / Automation Systems (BAS)
- Process Control Domains (PCD)
- Europe operational technology MARKET, BY End-User
- overview
- Oil & Gas
- Hardware
- Software/Platform
- Services
- Chemicals
- Hardware
- Software/Platform
- Services
- Marine & Ports
- Hardware
- Software/Platform
- Services
- Energy & Utilities
- Hardware
- Software/Platform
- Services
- Metals and Mining
- Hardware
- Software/Platform
- Services
- Automotive and Transportation
- Hardware
- Software/Platform
- Services
- Pulp and Paper
- Hardware
- Software/Platform
- Services
- Food & Beverage
- Hardware
- Software/Platform
- Services
- Life Sciences
- Hardware
- Software/Platform
- Services
- Buildings and Infrastructure
- Hardware
- Software/Platform
- Services
- Others
- Hardware
- Software/Platform
- Services
- Europe Operational technology market, by region
- Europe
- Germany
- U.K.
- France
- Italy
- Spain
- Netherlands
- Switzerland
- Russia
- Turkey
- Belgium
- rest of Europe
- EUROPE Operational Technology market: COMPANY landscape
- company share analysis: EUROPE
- swot analysis
- company profile
- Honeywell International Inc.
- COMPANY snapshot
- REVENUE ANALYSIS
- company share analysis
- product & service PORTFOLIO
- recent DEVELOPMENTS
- ABB
- COMPANY snapshot
- REVENUE ANALYSIS
- company share analysis
- product PORTFOLIO
- recent DEVELOPMENT
- Emerson Electric Co.
- COMPANY snapshot
- REVENUE ANALYSIS
- company share analysis
- Product PORTFOLIO
- recent DEVELOPMENTS
- Schneider Electric
- COMPANY snapshot
- REVENUE ANALYSIS
- company share analysis
- Product PORTFOLIO
- recent DEVELOPMENT
- Rockwell Automation, Inc.
- COMPANY snapshot
- REVENUE ANALYSIS
- company share analysis
- product PORTFOLIO
- recent DEVELOPMENTS
- General Electric
- COMPANY snapshot
- REVENUE ANALYSIS
- Solution & service PORTFOLIO
- recent DEVELOPMENT
- Advantech Co., Ltd.
- COMPANY snapshot
- REVENUE ANALYSIS
- Product PORTFOLIO
- recent DEVELOPMENT
- Accenture
- COMPANY snapshot
- REVENUE ANALYSIS
- Solution/ Service PORTFOLIO
- recent DEVELOPMENTS
- Cisco Systems, Inc.
- COMPANY snapshot
- REVENUE ANALYSIS
- product PORTFOLIO
- recent DEVELOPMENTS
- Forcepoint
- COMPANY snapshot
- Industrial solutioN PORTFOLIO
- recent DEVELOPMENT
- Fortinet, Inc.
- COMPANY snapshot
- REVENUE ANALYSIS
- Solution PORTFOLIO
- recent DEVELOPMENTS
- GrayMatter
- COMPANY snapshot
- solution PORTFOLIO
- recent DEVELOPMENT
- Huawei Technologies Co., Ltd.
- COMPANY snapshot
- Product PORTFOLIO
- recent DEVELOPMENTS
- IBM Corporation
- COMPANY snapshot
- REVENUE ANALYSIS
- Solution PORTFOLIO
- recent DEVELOPMENTS
- Oracle
- COMPANY snapshot
- REVENUE ANALYSIS
- Solution PORTFOLIO
- recent DEVELOPMENT
- SAP SE
- COMPANY snapshot
- REVENUE ANALYSIS
- Product PORTFOLIO
- recent DEVELOPMENTS
- SCADAfence
- COMPANY snapshot
- product & Solution PORTFOLIO
- recent DEVELOPMENT
- Wipro Limited
- COMPANY snapshot
- REVENUE ANALYSIS
- Product PORTFOLIO
- recent DEVELOPMENTS
- Wunderlich-Malec Engineering, Inc
- COMPANY snapshot
- Solution PORTFOLIO
- recent DEVELOPMENT
- Yokogawa Electric Corporation
- COMPANY snapshot
- REVENUE ANALYSIS
- Product/ Solution PORTFOLIO
- recent DEVELOPMENT
- questionnaire
- related reports
表のリスト
TABLE 1 Europe OPERATIONAL TECHNOLOGY Market, By component, 2019-2028 (USD million)
TABLE 2 Europe hardware in operational technology Market, By Region, 2019-2028 (USD MILLION)
TABLE 3 Europe Software/Platform in OPERATIONAL TECHNOLOGY Market, By Region, 2019-2028 (USD MILLION)
TABLE 4 Europe Software/Platform in operational technology Market, By component, 2019-2028 (USD million)
TABLE 5 Europe SERVICES in OPERATIONAL TECHNOLOGY Market, By Region, 2019-2028 (USD MILLION)
TABLE 6 Europe SERVICES in operational technology Market, By component, 2019-2028 (USD million)
TABLE 7 Europe operational technology Market, By Deployment,2019-2028 (USD million)
TABLE 8 Europe CLOUD IN OPERATIONAL technology Market, By region, 2019-2028 (USD million)
TABLE 9 Europe HYBRID in OPERATIONAL technology market, By region, 2019-2028 (USD million)
TABLE 10 Europe On-Premise in operational technology market, By region, 2019-2028 (USD million)
TABLE 11 Europe operational technology Market, By organization size, 2019-2028 (USD million)
TABLE 12 Europe Large Enterprise in operational technology Market, By REGION, 2019-2028 (USD MILLION)
TABLE 13 Europe Small & Medium Size Business in operational technology Market, By REGION, 2019-2028 (USD MILLION)
TABLE 14 Europe operational technology Market, By CONNECTIVITY, 2019-2028 (USD million)
TABLE 15 Europe Wireless in operational technology market, By region, 2019-2028 (USD million)
TABLE 16 Europe Wireless in Operational Technology Market, By Connectivity, 2019-2028 (USD million)
TABLE 17 Europe Wired in Operational Technology Market, By Connectivity, 2019-2028 (USD million)
TABLE 18 Europe Wired in Operational Technology Market, By Connectivity, 2019-2028 (USD million)
TABLE 19 Europe operational technology Market, By TECHNOLOGY, 2019-2028 (USD million)
TABLE 20 Europe Supervisory Control and Data Acquisition (SCADA) in operational technology market, By region, 2019-2028 (USD million)
TABLE 21 Europe Programmable Logic Controllers (PLC) in Operational Technology Market, By TECHNOLOGY, 2019-2028 (USD million)
TABLE 22 Europe Safety Instrumented Systems (SIS) in Operational Technology Market, By TECHNOLOGY, 2019-2028 (USD million)
TABLE 23 Europe Distributed Control Systems (DCS) in Operational Technology Market, By TECHNOLOGY, 2019-2028 (USD million)
TABLE 24 Europe Building Management / Automation Systems (BAS) in Operational Technology Market, By TECHNOLOGY, 2019-2028 (USD million)
TABLE 25 Europe Process Control Domains (PCD) in Operational Technology Market, By TECHNOLOGY, 2019-2028 (USD million)
TABLE 26 Europe operational technology Market, By End-User, 2019-2028 (USD million)
TABLE 27 Europe Oil & Gas in operational technology market, By region, 2019-2028 (USD million)
TABLE 28 Europe Oil & Gas in Operational Technology Market, By Component, 2019-2028 (USD million)
TABLE 29 Europe Chemicals in operational technology market, By region, 2019-2028 (USD million)
TABLE 30 Europe Chemicals in Operational Technology Market, By component, 2019-2028 (USD million)
TABLE 31 Europe Marine & Ports in operational technology market, By region, 2019-2028 (USD million)
TABLE 32 Europe Marine & Ports in Operational Technology Market, By component, 2019-2028 (USD million)
TABLE 33 Europe Energy & Utilities in operational technology market, By region, 2019-2028 (USD million)
TABLE 34 Europe Energy & Utilities in Operational Technology Market, By component, 2019-2028 (USD million)
TABLE 35 Europe Metals and Mining in operational technology market, By region, 2019-2028 (USD million)
TABLE 36 Europe Metals and Mining in Operational Technology Market, By component, 2019-2028 (USD million)
TABLE 37 Europe Automotive and Transportation in operational technology market, By region, 2019-2028 (USD million)
TABLE 38 Europe Automotive and Transportation in Operational Technology Market, By component, 2019-2028 (USD million)
TABLE 39 Europe Pulp and Paper in operational technology market, By region, 2019-2028 (USD million)
TABLE 40 Europe Pulp and Paper in Operational Technology Market, By component, 2019-2028 (USD million)
TABLE 41 Europe Food & Beverage in operational technology market, By region, 2019-2028 (USD million)
TABLE 42 Europe Food & Beverage in Operational Technology Market, By component, 2019-2028 (USD million)
TABLE 43 Europe Life Sciences in operational technology market, By region, 2019-2028 (USD million)
TABLE 44 Europe Life Sciences in Operational Technology Market, By component, 2019-2028 (USD million)
TABLE 45 Europe Buildings and Infrastructure in operational technology market, By region, 2019-2028 (USD million)
TABLE 46 Europe Buildings and Infrastructure in Operational Technology Market, By component, 2019-2028 (USD million)
TABLE 47 Europe Others in operational technology market, By region, 2019-2028 (USD million)
TABLE 48 Europe Others in Operational Technology Market, By component, 2019-2028 (USD million)
TABLE 49 Europe Operational technology market, By Country, 2019-2028 (USD Million)
TABLE 50 EUROPE Operational technology market, By Component, 2019-2028 (USD Million)
TABLE 51 EUROPE software/platform in Operational technology market, By component, 2019-2028 (USD Million)
TABLE 52 EUROPE services in Operational technology market, By component, 2019-2028 (USD Million)
TABLE 53 EUROPE Operational technology market, By deployment, 2019-2028 (USD Million)
TABLE 54 EUROPE Operational technology market, By organization size, 2019-2028 (USD Million)
TABLE 55 EUROPE Operational technology market, By connectivity, 2019-2028 (USD Million)
TABLE 56 EUROPE wireless in Operational technology market, By connectivity, 2019-2028 (USD Million)
TABLE 57 EUROPE wired in Operational technology market, By connectivity, 2019-2028 (USD Million)
TABLE 58 Europe Operational technology market, By technology, 2019-2028 (USD Million)
TABLE 59 Europe Operational technology market, By end-user, 2019-2028 (USD Million)
TABLE 60 EUROPE oil & gas in Operational technology market, By Component, 2019-2028 (USD Million)
TABLE 61 EUROPE chemicals in Operational technology market, By Component, 2019-2028 (USD Million)
TABLE 62 EUROPE marine and ports in Operational technology market, By Component, 2019-2028 (USD Million)
TABLE 63 EUROPE energy & utilities in Operational technology market, By Component, 2019-2028 (USD Million)
TABLE 64 EUROPE metals and mining in Operational technology market, By Component, 2019-2028 (USD Million)
TABLE 65 EUROPE automotive and transportation in Operational technology market, By Component, 2019-2028 (USD Million)
TABLE 66 EUROPE pulp and paper in Operational technology market, By Component, 2019-2028 (USD Million)
TABLE 67 EUROPE food and beverage in Operational technology market, By Component, 2019-2028 (USD Million)
TABLE 68 EUROPE life sciences in Operational technology market, By Component, 2019-2028 (USD Million)
TABLE 69 EUROPE Building and Infrastructure in Operational technology market, By Component, 2019-2028 (USD Million)
TABLE 70 EUROPE others in Operational technology market, By Component, 2019-2028 (USD Million)
TABLE 71 GERMANY Operational technology market, By Component, 2019-2028 (USD Million)
TABLE 72 GERMANY software/platform in Operational technology market, By component, 2019-2028 (USD Million)
TABLE 73 GERMANY services in Operational technology market, By component, 2019-2028 (USD Million)
TABLE 74 GERMANY Operational technology market, By deployment, 2019-2028 (USD Million)
TABLE 75 GERMANY Operational technology market, By organization size, 2019-2028 (USD Million)
TABLE 76 GERMANY Operational technology market, By connectivity, 2019-2028 (USD Million)
TABLE 77 GERMANY wireless in Operational technology market, By connectivity, 2019-2028 (USD Million)
TABLE 78 GERMANY wired in Operational technology market, By connectivity, 2019-2028 (USD Million)
TABLE 79 Germany Operational technology market, By technology, 2019-2028 (USD Million)
TABLE 80 Germany Operational technology market, By end-user, 2019-2028 (USD Million)
TABLE 81 GERMANY oil & gas in Operational technology market, By Component, 2019-2028 (USD Million)
TABLE 82 GERMANY chemicals in Operational technology market, By Component, 2019-2028 (USD Million)
TABLE 83 GERMANY marine and ports in Operational technology market, By Component, 2019-2028 (USD Million)
TABLE 84 GERMANY energy & utilities in Operational technology market, By Component, 2019-2028 (USD Million)
TABLE 85 GERMANY metals and mining in Operational technology market, By Component, 2019-2028 (USD Million)
TABLE 86 GERMANY automotive and transportation in Operational technology market, By Component, 2019-2028 (USD Million)
TABLE 87 GERMANY pulp and paper in Operational technology market, By Component, 2019-2028 (USD Million)
TABLE 88 GERMANY food and beverage in Operational technology market, By Component, 2019-2028 (USD Million)
TABLE 89 GERMANY life sciences in Operational technology market, By Component, 2019-2028 (USD Million)
TABLE 90 GERMANY Building and Infrastructure in Operational technology market, By Component, 2019-2028 (USD Million)
TABLE 91 GERMANY others in Operational technology market, By Component, 2019-2028 (USD Million)
TABLE 92 U.K. Operational technology market, By Component, 2019-2028 (USD Million)
TABLE 93 U.K. software/platform in Operational technology market, By component, 2019-2028 (USD Million)
TABLE 94 U.K. services in Operational technology market, By component, 2019-2028 (USD Million)
TABLE 95 U.K. Operational technology market, By deployment, 2019-2028 (USD Million)
TABLE 96 U.K. Operational technology market, By organization size, 2019-2028 (USD Million)
TABLE 97 U.K. Operational technology market, By connectivity, 2019-2028 (USD Million)
TABLE 98 U.K. wireless in Operational technology market, By connectivity, 2019-2028 (USD Million)
TABLE 99 U.K. wired in Operational technology market, By connectivity, 2019-2028 (USD Million)
TABLE 100 U.K. Operational technology market, By technology, 2019-2028 (USD Million)
TABLE 101 U.K. Operational technology market, By end-user, 2019-2028 (USD Million)
TABLE 102 U.K. oil & gas in Operational technology market, By Component, 2019-2028 (USD Million)
TABLE 103 U.K. chemicals in Operational technology market, By Component, 2019-2028 (USD Million)
TABLE 104 U.K. marine and ports in Operational technology market, By Component, 2019-2028 (USD Million)
TABLE 105 U.K. energy & utilities in Operational technology market, By Component, 2019-2028 (USD Million)
TABLE 106 U.K. metals and mining in Operational technology market, By Component, 2019-2028 (USD Million)
TABLE 107 U.K. automotive and transportation in Operational technology market, By Component, 2019-2028 (USD Million)
TABLE 108 U.K. pulp and paper in Operational technology market, By Component, 2019-2028 (USD Million)
TABLE 109 U.K. food and beverage in Operational technology market, By Component, 2019-2028 (USD Million)
TABLE 110 U.K. life sciences in Operational technology market, By Component, 2019-2028 (USD Million)
TABLE 111 U.K. Building and Infrastructure in Operational technology market, By Component, 2019-2028 (USD Million)
TABLE 112 U.K. others in Operational technology market, By Component, 2019-2028 (USD Million)
TABLE 113 FRANCE Operational technology market, By Component, 2019-2028 (USD Million)
TABLE 114 FRANCE software/platform in Operational technology market, By component, 2019-2028 (USD Million)
TABLE 115 FRANCE services in Operational technology market, By component, 2019-2028 (USD Million)
TABLE 116 FRANCE Operational technology market, By deployment, 2019-2028 (USD Million)
TABLE 117 FRANCE Operational technology market, By organization size, 2019-2028 (USD Million)
TABLE 118 FRANCE Operational technology market, By connectivity, 2019-2028 (USD Million)
TABLE 119 FRANCE wireless in Operational technology market, By connectivity, 2019-2028 (USD Million)
TABLE 120 FRANCE wired in Operational technology market, By connectivity, 2019-2028 (USD Million)
TABLE 121 FRANCE Operational technology market, By technology, 2019-2028 (USD Million)
TABLE 122 FRANCE Operational technology market, By end-user, 2019-2028 (USD Million)
TABLE 123 FRANCE oil & gas in Operational technology market, By Component, 2019-2028 (USD Million)
TABLE 124 FRANCE chemicals in Operational technology market, By Component, 2019-2028 (USD Million)
TABLE 125 FRANCE marine and ports in Operational technology market, By Component, 2019-2028 (USD Million)
TABLE 126 FRANCE energy & utilities in Operational technology market, By Component, 2019-2028 (USD Million)
TABLE 127 FRANCE metals and mining in Operational technology market, By Component, 2019-2028 (USD Million)
TABLE 128 FRANCE automotive and transportation in Operational technology market, By Component, 2019-2028 (USD Million)
TABLE 129 FRANCE pulp and paper in Operational technology market, By Component, 2019-2028 (USD Million)
TABLE 130 FRANCE food and beverage in Operational technology market, By Component, 2019-2028 (USD Million)
TABLE 131 FRANCE life sciences in Operational technology market, By Component, 2019-2028 (USD Million)
TABLE 132 FRANCE Building and Infrastructure in Operational technology market, By Component, 2019-2028 (USD Million)
TABLE 133 FRANCE others in Operational technology market, By Component, 2019-2028 (USD Million)
TABLE 134 ITALY Operational technology market, By Component, 2019-2028 (USD Million)
TABLE 135 ITALY software/platform in Operational technology market, By component, 2019-2028 (USD Million)
TABLE 136 ITALY services in Operational technology market, By component, 2019-2028 (USD Million)
TABLE 137 ITALY Operational technology market, By deployment, 2019-2028 (USD Million)
TABLE 138 ITALY Operational technology market, By organization size, 2019-2028 (USD Million)
TABLE 139 ITALY Operational technology market, By connectivity, 2019-2028 (USD Million)
TABLE 140 ITALY wireless in Operational technology market, By connectivity, 2019-2028 (USD Million)
TABLE 141 ITALY wired in Operational technology market, By connectivity, 2019-2028 (USD Million)
TABLE 142 ITALY Operational technology market, By technology, 2019-2028 (USD Million)
TABLE 143 ITALY Operational technology market, By end-user, 2019-2028 (USD Million)
TABLE 144 ITALY oil & gas in Operational technology market, By Component, 2019-2028 (USD Million)
TABLE 145 ITALY chemicals in Operational technology market, By Component, 2019-2028 (USD Million)
TABLE 146 iTALY marine and ports in Operational technology market, By Component, 2019-2028 (USD Million)
TABLE 147 ITALY energy & utilities in Operational technology market, By Component, 2019-2028 (USD Million)
TABLE 148 ITALY metals and mining in Operational technology market, By Component, 2019-2028 (USD Million)
TABLE 149 ITALY automotive and transportation in Operational technology market, By Component, 2019-2028 (USD Million)
TABLE 150 ITALY pulp and paper in Operational technology market, By Component, 2019-2028 (USD Million)
TABLE 151 ITALY food and beverage in Operational technology market, By Component, 2019-2028 (USD Million)
TABLE 152 ITALY life sciences in Operational technology market, By Component, 2019-2028 (USD Million)
TABLE 153 ITALY Building and Infrastructure in Operational technology market, By Component, 2019-2028 (USD Million)
TABLE 154 ITALY others in Operational technology market, By Component, 2019-2028 (USD Million)
TABLE 155 SPAIN Operational technology market, By Component, 2019-2028 (USD Million)
TABLE 156 SPAIN software/platform in Operational technology market, By component, 2019-2028 (USD Million)
TABLE 157 SPAIN services in Operational technology market, By component, 2019-2028 (USD Million)
TABLE 158 SPAIN Operational technology market, By deployment, 2019-2028 (USD Million)
TABLE 159 SPAIN Operational technology market, By organization size, 2019-2028 (USD Million)
TABLE 160 SPAIN Operational technology market, By connectivity, 2019-2028 (USD Million)
TABLE 161 SPAIN wireless in Operational technology market, By connectivity, 2019-2028 (USD Million)
TABLE 162 SPAIN wired in Operational technology market, By connectivity, 2019-2028 (USD Million)
TABLE 163 SPAIN Operational technology market, By technology, 2019-2028 (USD Million)
TABLE 164 SPAIN Operational technology market, By end-user, 2019-2028 (USD Million)
TABLE 165 SPAIN oil & gas in Operational technology market, By Component, 2019-2028 (USD Million)
TABLE 166 SPAIN chemicals in Operational technology market, By Component, 2019-2028 (USD Million)
TABLE 167 SPAIN marine and ports in Operational technology market, By Component, 2019-2028 (USD Million)
TABLE 168 SPAIN energy & utilities in Operational technology market, By Component, 2019-2028 (USD Million)
TABLE 169 SPAIN metals and mining in Operational technology market, By Component, 2019-2028 (USD Million)
TABLE 170 SPAIN automotive and transportation in Operational technology market, By Component, 2019-2028 (USD Million)
TABLE 171 SPAIN pulp and paper in Operational technology market, By Component, 2019-2028 (USD Million)
TABLE 172 SPAIN food and beverage in Operational technology market, By Component, 2019-2028 (USD Million)
TABLE 173 SPAIN life sciences in Operational technology market, By Component, 2019-2028 (USD Million)
TABLE 174 SPAIN Building and Infrastructure in Operational technology market, By Component, 2019-2028 (USD Million)
TABLE 175 SPAIN others in Operational technology market, By Component, 2019-2028 (USD Million)
TABLE 176 NETHERLANDS Operational technology market, By Component, 2019-2028 (USD Million)
TABLE 177 NETHERLANDS software/platform in Operational technology market, By component, 2019-2028 (USD Million)
TABLE 178 NETHERLANDS services in Operational technology market, By component, 2019-2028 (USD Million)
TABLE 179 NETHERLANDS Operational technology market, By deployment, 2019-2028 (USD Million)
TABLE 180 NETHERLANDS Operational technology market, By organization size, 2019-2028 (USD Million)
TABLE 181 NETHERLANDS Operational technology market, By connectivity, 2019-2028 (USD Million)
TABLE 182 NETHERLANDS wireless in Operational technology market, By connectivity, 2019-2028 (USD Million)
TABLE 183 NETHERLANDS wired in Operational technology market, By connectivity, 2019-2028 (USD Million)
TABLE 184 NETHERLANDS Operational technology market, By technology, 2019-2028 (USD Million)
TABLE 185 NETHERLANDS Operational technology market, By end-user, 2019-2028 (USD Million)
TABLE 186 NETHERLANDS oil & gas in Operational technology market, By Component, 2019-2028 (USD Million)
TABLE 187 NETHERLANDS chemicals in Operational technology market, By Component, 2019-2028 (USD Million)
TABLE 188 NETHERLANDS marine and ports in Operational technology market, By Component, 2019-2028 (USD Million)
TABLE 189 NETHERLANDS energy & utilities in Operational technology market, By Component, 2019-2028 (USD Million)
TABLE 190 NETHERLANDS metals and mining in Operational technology market, By Component, 2019-2028 (USD Million)
TABLE 191 NETHERLANDS automotive and transportation in Operational technology market, By Component, 2019-2028 (USD Million)
TABLE 192 NETHERLANDS pulp and paper in Operational technology market, By Component, 2019-2028 (USD Million)
TABLE 193 NETHERLANDS food and beverage in Operational technology market, By Component, 2019-2028 (USD Million)
TABLE 194 NETHERLANDS life sciences in Operational technology market, By Component, 2019-2028 (USD Million)
TABLE 195 NETHERLANDS Building and Infrastructure in Operational technology market, By Component, 2019-2028 (USD Million)
TABLE 196 NETHERLANDS others in Operational technology market, By Component, 2019-2028 (USD Million)
TABLE 197 SWITZERLAND Operational technology market, By Component, 2019-2028 (USD Million)
TABLE 198 SWITZERLAND software/platform in Operational technology market, By component, 2019-2028 (USD Million)
TABLE 199 SWITZERLAND services in Operational technology market, By component, 2019-2028 (USD Million)
TABLE 200 SWITZERLAND Operational technology market, By deployment, 2019-2028 (USD Million)
TABLE 201 SWITZERLAND Operational technology market, By organization size, 2019-2028 (USD Million)
TABLE 202 SWITZERLAND Operational technology market, By connectivity, 2019-2028 (USD Million)
TABLE 203 SWITZERLAND wireless in Operational technology market, By connectivity, 2019-2028 (USD Million)
TABLE 204 SWITZERLAND wired in Operational technology market, By connectivity, 2019-2028 (USD Million)
TABLE 205 SWITZERLAND Operational technology market, By technology, 2019-2028 (USD Million)
TABLE 206 SWITZERLAND Operational technology market, By end-user, 2019-2028 (USD Million)
TABLE 207 SWITZERLAND oil & gas in Operational technology market, By Component, 2019-2028 (USD Million)
TABLE 208 SWITZERLAND chemicals in Operational technology market, By Component, 2019-2028 (USD Million)
TABLE 209 SWITZERLAND marine and ports in Operational technology market, By Component, 2019-2028 (USD Million)
TABLE 210 SWITZERLAND energy & utilities in Operational technology market, By Component, 2019-2028 (USD Million)
TABLE 211 SWITZERLAND metals and mining in Operational technology market, By Component, 2019-2028 (USD Million)
TABLE 212 SWITZERLAND automotive and transportation in Operational technology market, By Component, 2019-2028 (USD Million)
TABLE 213 SWITZERLAND pulp and paper in Operational technology market, By Component, 2019-2028 (USD Million)
TABLE 214 SWITZERLAND food and beverage in Operational technology market, By Component, 2019-2028 (USD Million)
TABLE 215 SWITZERLAND life sciences in Operational technology market, By Component, 2019-2028 (USD Million)
TABLE 216 SWITZERLAND Building and Infrastructure in Operational technology market, By Component, 2019-2028 (USD Million)
TABLE 217 SWITZERLAND others in Operational technology market, By Component, 2019-2028 (USD Million)
TABLE 218 RUSSIA Operational technology market, By Component, 2019-2028 (USD Million)
TABLE 219 RUSSIA software/platform in Operational technology market, By component, 2019-2028 (USD Million)
TABLE 220 RUSSIA services in Operational technology market, By component, 2019-2028 (USD Million)
TABLE 221 RUSSIA Operational technology market, By deployment, 2019-2028 (USD Million)
TABLE 222 RUSSIA Operational technology market, By organization size, 2019-2028 (USD Million)
TABLE 223 RUSSIA Operational technology market, By connectivity, 2019-2028 (USD Million)
TABLE 224 RUSSIA wireless in Operational technology market, By connectivity, 2019-2028 (USD Million)
TABLE 225 RUSSIA wired in Operational technology market, By connectivity, 2019-2028 (USD Million)
TABLE 226 RUSSIA Operational technology market, By technology, 2019-2028 (USD Million)
TABLE 227 RUSSIA Operational technology market, By end-user, 2019-2028 (USD Million)
TABLE 228 RUSSIA oil & gas in Operational technology market, By Component, 2019-2028 (USD Million)
TABLE 229 RUSSIA chemicals in Operational technology market, By Component, 2019-2028 (USD Million)
TABLE 230 RUSSIA marine and ports in Operational technology market, By Component, 2019-2028 (USD Million)
TABLE 231 RUSSIA energy & utilities in Operational technology market, By Component, 2019-2028 (USD Million)
TABLE 232 RUSSIA metals and mining in Operational technology market, By Component, 2019-2028 (USD Million)
TABLE 233 RUSSIA automotive and transportation in Operational technology market, By Component, 2019-2028 (USD Million)
TABLE 234 RUSSIA pulp and paper in Operational technology market, By Component, 2019-2028 (USD Million)
TABLE 235 RUSSIA food and beverage in Operational technology market, By Component, 2019-2028 (USD Million)
TABLE 236 RUSSIA life sciences in Operational technology market, By Component, 2019-2028 (USD Million)
TABLE 237 RUSSIA Building and Infrastructure in Operational technology market, By Component, 2019-2028 (USD Million)
TABLE 238 RUSSIA others in Operational technology market, By Component, 2019-2028 (USD Million)
TABLE 239 TURKEY Operational technology market, By Component, 2019-2028 (USD Million)
TABLE 240 TURKEY software/platform in Operational technology market, By component, 2019-2028 (USD Million)
TABLE 241 TURKEY services in Operational technology market, By component, 2019-2028 (USD Million)
TABLE 242 TURKEY Operational technology market, By deployment, 2019-2028 (USD Million)
TABLE 243 TURKEY Operational technology market, By organization size, 2019-2028 (USD Million)
TABLE 244 TURKEY Operational technology market, By connectivity, 2019-2028 (USD Million)
TABLE 245 TURKEY wireless in Operational technology market, By connectivity, 2019-2028 (USD Million)
TABLE 246 TURKEY wired in Operational technology market, By connectivity, 2019-2028 (USD Million)
TABLE 247 TURKEY Operational technology market, By technology, 2019-2028 (USD Million)
TABLE 248 TURKEY Operational technology market, By end-user, 2019-2028 (USD Million)
TABLE 249 TURKEY oil & gas in Operational technology market, By Component, 2019-2028 (USD Million)
TABLE 250 TURKEY chemicals in Operational technology market, By Component, 2019-2028 (USD Million)
TABLE 251 TURKEY marine and ports in Operational technology market, By Component, 2019-2028 (USD Million)
TABLE 252 TURKEY energy & utilities in Operational technology market, By Component, 2019-2028 (USD Million)
TABLE 253 TURKEY metals and mining in Operational technology market, By Component, 2019-2028 (USD Million)
TABLE 254 TURKEY automotive and transportation in Operational technology market, By Component, 2019-2028 (USD Million)
TABLE 255 TURKEY pulp and paper in Operational technology market, By Component, 2019-2028 (USD Million)
TABLE 256 TURKEY food and beverage in Operational technology market, By Component, 2019-2028 (USD Million)
TABLE 257 TURKEY life sciences in Operational technology market, By Component, 2019-2028 (USD Million)
TABLE 258 TURKEY Building and Infrastructure in Operational technology market, By Component, 2019-2028 (USD Million)
TABLE 259 TURKEY others in Operational technology market, By Component, 2019-2028 (USD Million)
TABLE 260 BELGIUM Operational technology market, By Component, 2019-2028 (USD Million)
TABLE 261 BELGIUM software/platform in Operational technology market, By component, 2019-2028 (USD Million)
TABLE 262 BELGIUM services in Operational technology market, By component, 2019-2028 (USD Million)
TABLE 263 BELGIUM Operational technology market, By deployment, 2019-2028 (USD Million)
TABLE 264 BELGIUM Operational technology market, By organization size, 2019-2028 (USD Million)
TABLE 265 BELGIUM Operational technology market, By connectivity, 2019-2028 (USD Million)
TABLE 266 BELGIUM wireless in Operational technology market, By connectivity, 2019-2028 (USD Million)
TABLE 267 BELGIUM wired in Operational technology market, By connectivity, 2019-2028 (USD Million)
TABLE 268 BELGIUM Operational technology market, By technology, 2019-2028 (USD Million)
TABLE 269 BELGIUM Operational technology market, By end-user, 2019-2028 (USD Million)
TABLE 270 BELGIUM oil & gas in Operational technology market, By Component, 2019-2028 (USD Million)
TABLE 271 BELGIUM chemicals in Operational technology market, By Component, 2019-2028 (USD Million)
TABLE 272 BELGIUM marine and ports in Operational technology market, By Component, 2019-2028 (USD Million)
TABLE 273 BELGIUM energy & utilities in Operational technology market, By Component, 2019-2028 (USD Million)
TABLE 274 BELGIUM metals and mining in Operational technology market, By Component, 2019-2028 (USD Million)
TABLE 275 BELGIUM automotive and transportation in Operational technology market, By Component, 2019-2028 (USD Million)
TABLE 276 BELGIUM pulp and paper in Operational technology market, By Component, 2019-2028 (USD Million)
TABLE 277 BELGIUM food and beverage in Operational technology market, By Component, 2019-2028 (USD Million)
TABLE 278 BELGIUM life sciences in Operational technology market, By Component, 2019-2028 (USD Million)
TABLE 279 BELGIUM Building and Infrastructure in Operational technology market, By Component, 2019-2028 (USD Million)
TABLE 280 BELGIUM others in Operational technology market, By Component, 2019-2028 (USD Million)
TABLE 281 rest of europe Operational technology market, By Component, 2019-2028 (USD Million)
図表一覧
FIGURE 1 EUROPE OPERATIONAL TECHNOLOGY MARKET: segmentation
FIGURE 2 Europe OPERATIONAL TECHNOLOGY market: data triangulation
FIGURE 3 Europe operational technology market: DROC ANALYSIS
FIGURE 4 Europe operational technology market: EUROPE VS REGIONAL MARKET ANALYSIS
FIGURE 5 Europe operational technology market: COMPANY RESEARCH ANALYSIS
FIGURE 6 Europe operational technology market: INTERVIEW DEMOGRAPHICS
FIGURE 7 Europe operational technology market: DBMR MARKET POSITION GRID
FIGURE 8 Europe operational technology market: vendor share analysis
FIGURE 9 EUROPE operational technology Market: MARKET END-USER COVERAGE GRID
FIGURE 10 Europe operational technology market: SEGMENTATION
FIGURE 11 THE RisE IN demand for merging operational technology (OT) & information technology (IT) is EXPECTED TO DRIVE THE EUROPE OPERATIONAL TECHNOLOGY MARKET IN THE FORECAST PERIOD OF 2021 TO 2028
FIGURE 12 hardware COMPONENT segment is expected to account for the largest share of THE Europe OPERATIONAL TECHNOLOGY market in 2021 & 2028
FIGURE 13 DRIVERS, RESTRAINTS, OPPORTUNITIES AND CHALLENGES OF Europe operational technologyMarket
FIGURE 14 Europe Operational Technology MARKET, BY Component, 2020
FIGURE 15 Europe operational technology MARKET, BY Deployment, 2020
FIGURE 16 Europe operational technology MARKET, BY organization size, 2020
FIGURE 17 Europe operational technology MARKET, BY CONNECTIVITY, 2020
FIGURE 18 Europe operational technology MARKET, BY TECHNOLOGY, 2020
FIGURE 19 Europe operational technology MARKET: BY, End-User 2020
FIGURE 20 Europe operational technology market : SNAPSHOT (2020)
FIGURE 21 Europe operational technology market : by Country (2020)
FIGURE 22 Europe operational technology market : by Country (2021 & 2028)
FIGURE 23 Europe operational technology market : by Country (2020 & 2028)
FIGURE 24 Europe operational technology market : by component (2021-2028)
FIGURE 25 Europe Operational Technology Market: company share 2020 (%)
調査方法
データ収集と基準年分析は、大規模なサンプル サイズのデータ収集モジュールを使用して行われます。この段階では、さまざまなソースと戦略を通じて市場情報または関連データを取得します。過去に取得したすべてのデータを事前に調査および計画することも含まれます。また、さまざまな情報ソース間で見られる情報の不一致の調査も含まれます。市場データは、市場統計モデルと一貫性モデルを使用して分析および推定されます。また、市場シェア分析と主要トレンド分析は、市場レポートの主要な成功要因です。詳細については、アナリストへの電話をリクエストするか、お問い合わせをドロップダウンしてください。
DBMR 調査チームが使用する主要な調査方法は、データ マイニング、データ変数が市場に与える影響の分析、および一次 (業界の専門家) 検証を含むデータ三角測量です。データ モデルには、ベンダー ポジショニング グリッド、市場タイムライン分析、市場概要とガイド、企業ポジショニング グリッド、特許分析、価格分析、企業市場シェア分析、測定基準、グローバルと地域、ベンダー シェア分析が含まれます。調査方法について詳しくは、お問い合わせフォームから当社の業界専門家にご相談ください。
カスタマイズ可能
Data Bridge Market Research は、高度な形成的調査のリーダーです。当社は、既存および新規のお客様に、お客様の目標に合致し、それに適したデータと分析を提供することに誇りを持っています。レポートは、対象ブランドの価格動向分析、追加国の市場理解 (国のリストをお問い合わせください)、臨床試験結果データ、文献レビュー、リファービッシュ市場および製品ベース分析を含めるようにカスタマイズできます。対象競合他社の市場分析は、技術ベースの分析から市場ポートフォリオ戦略まで分析できます。必要な競合他社のデータを、必要な形式とデータ スタイルでいくつでも追加できます。当社のアナリスト チームは、粗い生の Excel ファイル ピボット テーブル (ファクト ブック) でデータを提供したり、レポートで利用可能なデータ セットからプレゼンテーションを作成するお手伝いをしたりすることもできます。

