ヨーロッパのガスバリア膜市場、製品別(ラドンバリア膜、自己接着性ガス膜、液体ガス膜など)、用途別(産業用、住宅用、商業用)、業界動向および 2030 年までの予測。
ヨーロッパのガスバリア膜市場の分析と洞察
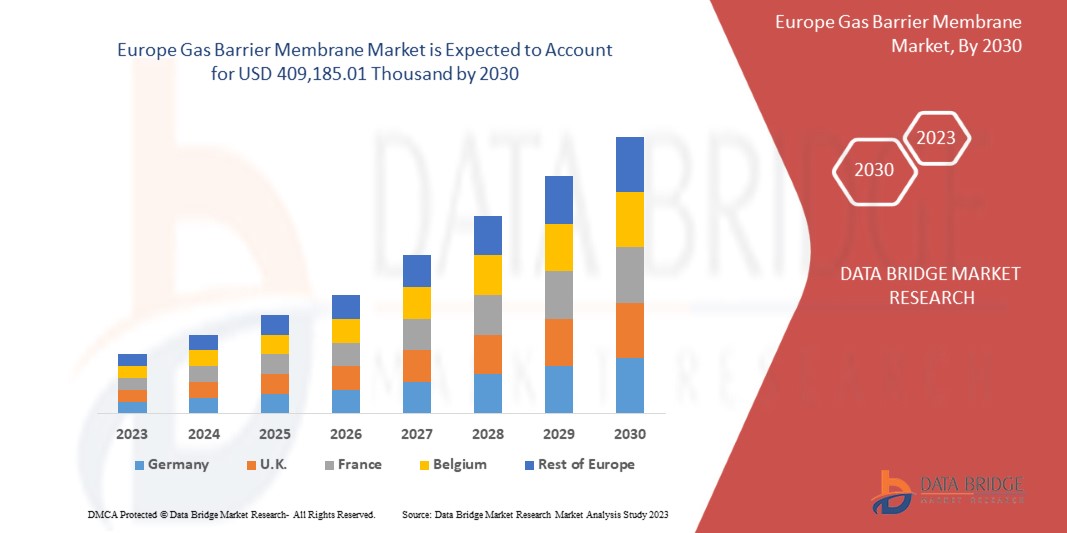
ヨーロッパのガスバリア膜市場は、2023年から2030年の予測期間に大幅な成長が見込まれています。データブリッジマーケットリサーチは、市場は2023年から2030年の予測期間に4.3%のCAGRで成長し、2030年までに409,185.01千米ドルに達すると分析しています。市場の成長を牽引する主な要因は、ヨーロッパ諸国の建設業界の増加と、新しいインフラプロジェクトへの政府投資の増加です。
ガスバリア膜は、床の建設や、ラドン、二酸化炭素、メタンなどの有害な地中ガスの特性の維持と保全に使用されます。これらは、石油およびガス産業におけるガス分離にも使用されます。これに加えて、食品および飲料、製薬、鉱業、化学処理などの産業でも使用されます。ガスバリア膜は、汚染された土地から放出される有害ガスに対するバリアとして開発されています。適用モードに基づいて、ラドンガスバリア膜、自己接着性ガス膜、液体ガス膜など、さまざまな種類のガスバリア膜があります。これらのうち、ラドンガスバリア膜は広く使用されている膜です。
ヨーロッパのガスバリア膜市場レポートでは、市場シェア、新しい開発、国内および現地の市場プレーヤーの影響の詳細を提供し、新たな収益源、市場規制の変更、製品承認、戦略的決定、製品発売、地理的拡大、市場における技術革新の観点から機会を分析します。分析と市場シナリオを理解するには、アナリスト概要についてお問い合わせください。当社のチームが、希望する目標を達成するための収益影響ソリューションの作成をお手伝いします。
|
レポートメトリック |
詳細 |
|
予測期間 |
2023年から2030年 |
|
基準年 |
2022 |
|
歴史的な年 |
2021 (2020~2016年にカスタマイズ可能) |
|
定量単位 |
収益(千米ドル) |
|
対象セグメント |
製品別(ラドンバリア膜、自己接着ガス膜、液体ガス膜など)、用途別(工業用、住宅用、商業用) |
|
対象国 |
ドイツ、イギリス、フランス、イタリア、スペイン、ロシア、トルコ、ベルギー、オランダ、スイス、その他のヨーロッパ諸国。 |
|
対象となる市場プレーヤー |
Delta Membranes、Industrial Textiles & Plastics Ltd、Permagard Products Limited、Monarflex sro、A. Proctor Group Ltd、Newton Waterproofing、RIW Ltd、CETCO、Gas Membrane Solutions Pty Ltd.、BS SPECIALIST PRODUCTS、Berry Global Inc.、Cavity Trays Ltd。 |
市場の定義
ガスバリア膜は、ラドン、二酸化炭素、メタンなどの有害な地中ガスに対するバリアとして開発された膜技術の一種です。これらは、床の建設や商業ビルや住宅ビルの保護に広く使用されています。これらは、ポリアミドやセルロースアセテートなどのポリマーでできています。ガスバリアは多層保護を提供し、汚染された土地から放出される有害なガスから建物を守るのに役立ちます。産業用、商業用、住宅用など、さまざまな用途に使用されるさまざまな種類のガスバリア膜があります。ガスバリア膜は現代の建築規制の一部となり、床の建設や財産保護に広く使用されています。
欧州のガスバリア膜市場の動向
このセクションでは、市場の推進要因、利点、機会、制約、課題について理解します。これらについては、以下で詳しく説明します。
ドライバー
- 有害な地中ガスから建物構造物を保護することへの懸念が高まる
ヨーロッパのガスバリア膜市場は、建物構造物を有害な地中ガスから保護することへの関心の高まりにより、近い将来、大幅な成長が見込まれています。目に見えない有害なガスが住宅や商業施設に侵入するのを防ぐため、ガスの浸透を防ぐこれらの膜の需要が増加すると予想されます。汚染された土地は、地表からラドンや二酸化炭素ガスなどを放出し、人間の健康に悪影響を与える可能性があるため、現代の住宅にはこれらを防ぐバリア保護が必要です。これは、これらの構造物におけるガスバリア保護の需要増加に役立つと予想されます。
- 汚染された土地や工業用地での建設活動の増加
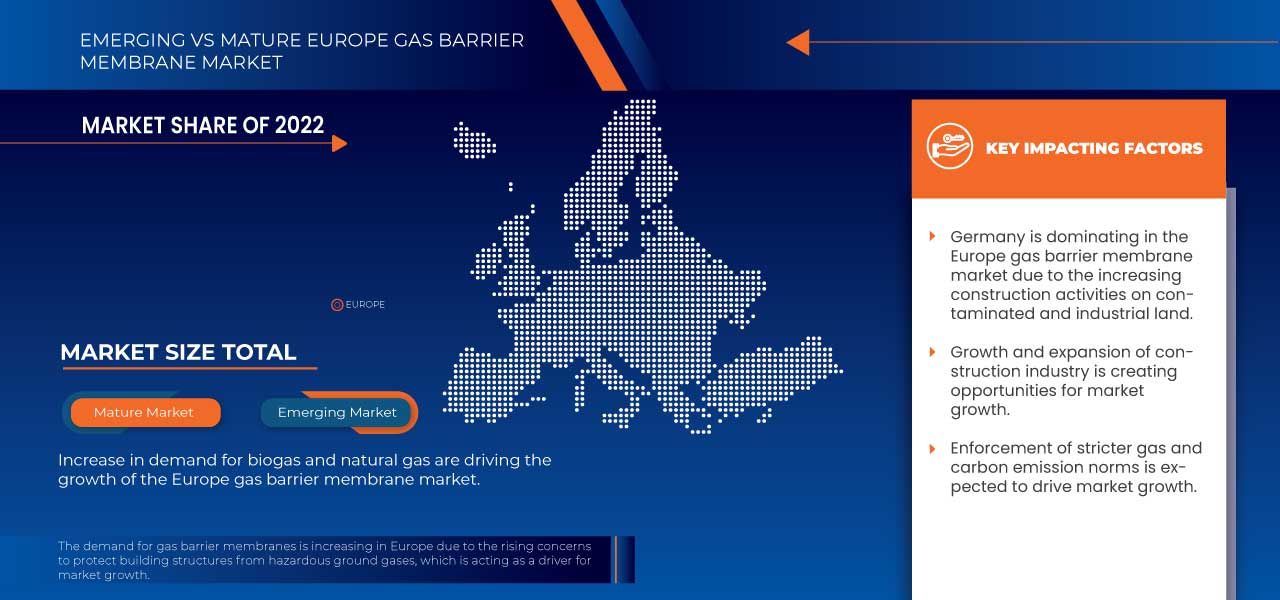
ヨーロッパ全域で、都市人口は着実に増加しており、土地需要は急速に高まっています。工業用地や汚染された土地の再生と修復は、持続可能な都市開発と新しい住宅および商業ビルの建設の機会を提供し、手つかずの土地資源への圧力を軽減します。汚染された土地の再開発にはさまざまな課題があり、汚染リスクが適切に管理または修復されなければ、環境と健康に継続的な影響を及ぼす可能性があります。都市部は、雇用機会、より高い生活水準の見通し、活気のある都市生活を提供することで、田舎からの移住を促します。都市人口の増加とそれに伴う都市の無秩序な拡大は、都市計画者と地方自治体にいくつかの課題をもたらします。
- バイオガスと天然ガスの需要増加
ガスバリア膜の最も重要な用途の 1 つは、ガス流から二酸化炭素を分離することです。これは、ガスの脱硫、石油回収の改善、およびバイオガスの精製に使用されます。ガスバリア膜の最も一般的な用途は、天然ガスからの二酸化炭素の除去であり、石油回収の改善がそれに続きます。二酸化炭素は、天然ガスに高濃度で含まれる酸性ガスです。二酸化炭素が水と混ざると、非常に腐食性が高くなり、パイプラインや機器を腐食します。また、天然ガスの発熱量とパイプラインの容量にも影響します。したがって、低温チラーが凍結するのを防ぐために、液化天然ガス (LNG) プラントから二酸化炭素を排除する必要があります。二酸化炭素の除去は、天然ガスの伝送と処理を向上させるための重要な分離手順になります。
機会
- 建設業界の成長と拡大
建築および建設部門におけるガスバリア膜の需要増加により、欧州市場の成長率が上昇しています。汚染された土地での建設は、メタン、二酸化炭素、ラドン、一酸化炭素などの有害ガスの排出を引き起こします。そのため、ガスバリア膜は、有害ガスから人間の健康と環境を保護するのに役立つため、ガスバリア保護として使用されます。したがって、欧州諸国の建設業界の成長は、近い将来、市場の成長の大きな機会を生み出す可能性があります。
- ガス膜製造技術の進歩
ガスバリア膜市場のメーカーは、他の技術進歩の中でも、有害ガスからの保護と防水性を同時に実現するなど、多機能を備えたガス膜の導入に注力しています。製品の技術開発により、強化ポリマーと一体型アルミホイルを使用したバリア膜が導入され、重量のある床材用途に耐えられるよう強度が強化されています。
さらに、ガス分離膜の効率向上を目的とした研究開発の増加により、市場は拡大すると予想されます。
- より厳しいガスおよび炭素排出基準の施行
ガスバリア膜は、適切な実施基準に従って設置すると、自然発生および汚染された土地から発生するさまざまなガスや化学物質から建物を保護する安全なソリューションを提供します。この製品は多層構造、高強度、設置の容易さが評価され、欧州市場で人気を博しています。これらのバリア膜は、新築物件の床基礎に設置されます。
The early structural planning of the construction site complying with building standards and regulations and the use of barrier membranes can prevent harmful gases and chemicals from entering the interior of the property. Thus, builders nowadays are focusing on the installation of gas barriers for residential and commercial construction specifically for precast concrete slabs, suspended beam-and-block concrete floors, and reinforced cast-in-situ concrete floors.
RESTRAINTS/CHALLENGES
- Lack of Awareness Regarding Gas Barrier Membranes
Installation of gas barrier membranes additionally adds up to the construction costs of a building or any other space. Moreover, there is a lack of awareness regarding the installation of gas barrier membranes among end-users and consumers as not all constructors are aware of the application of gas barrier membranes as well as are not skilled in their installation. Moreover, there are several other technologies for the removal of gases such as the amine guard process, cryogenic process, pressure swing adsorption, thermal swing adsorption, and many others, which add up to the challenge to the market growth. Further, these barrier membrane techniques are widely employed in the chemical, petrochemical, and other manufacturing industries for the separation of gases. Therefore, there is awareness regarding these membranes among end-users from the residential sector. This lack of awareness regarding the benefits of gas barrier membranes is expected to act as a major challenge to the growth and development of the market.
- Upscaling and Commercializing New Membranes
Most of the gas barrier and separation membranes are created and developed in the laboratory under controlled conditions. Upscaling of new membrane technology will ensure reliability and durability. Upscaling also ensures the safe design and operation of the membrane in real operating conditions. However, testing these newly developed gas barrier membranes in the pilot plant and analyzing their performance is highly time-consuming and needs high installation and construction costs. Therefore, most of the membranes developed in recent times or years are not fully tested and are yet to be tested under real conditions, which leads to delays in their commercialization and incur huge loss to the manufacturers. The high costs and time consumption associated with the upscaling and commercializing of new gas barrier membrane products in the market pose a major challenge for the market players operating in the market.
- Lack of Skilled Workforce Required to Install These Membranes
The installation of gas barrier membranes requires a skilled workforce and detailing to achieve effective sealing across the space. Moreover, the lack of awareness about the product and its benefits along with the lack of a skilled workforce is likely to hamper its demand for gas barrier membranes.
Moreover, these membranes are available in different forms such as radon barrier membranes, self-adhesive gas membranes, liquid gas membranes, and others. Specialized membrane products are available for protection against CO2, methane, and hydrocarbons. Further, the installation of these membranes requires special components including joint tapes, top hat units, detailing tapes, drainage & venting map, heavy-duty protection board, and other equipment, which add to the cost of installation and complete gas barrier membrane set-up.
Recent Development
- In June, A. Proctor Group was awarded BBA certification for Radon 400 high-performance radon barrier membrane. In the year 2020, Newton Waterproofing was awarded National Building and Construction award. This award increased morale and improved the reputation of the organization by highlighting its achievements.
Europe Gas Barrier Membrane Market Scope
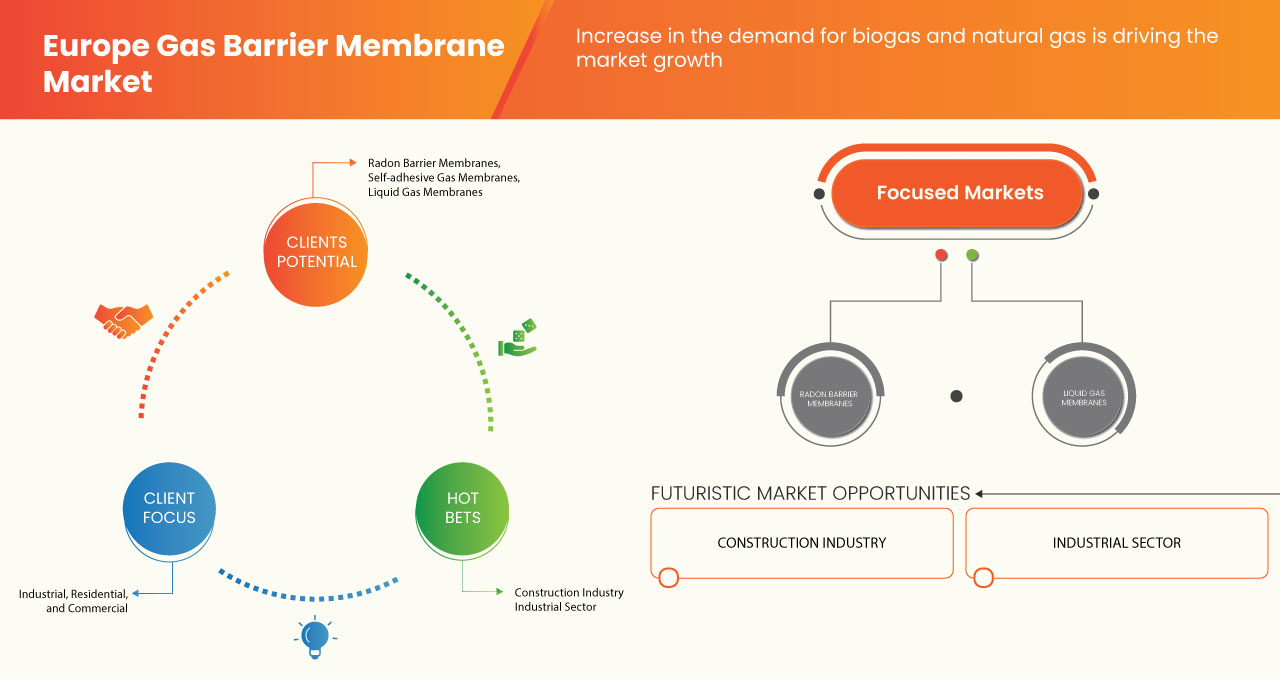
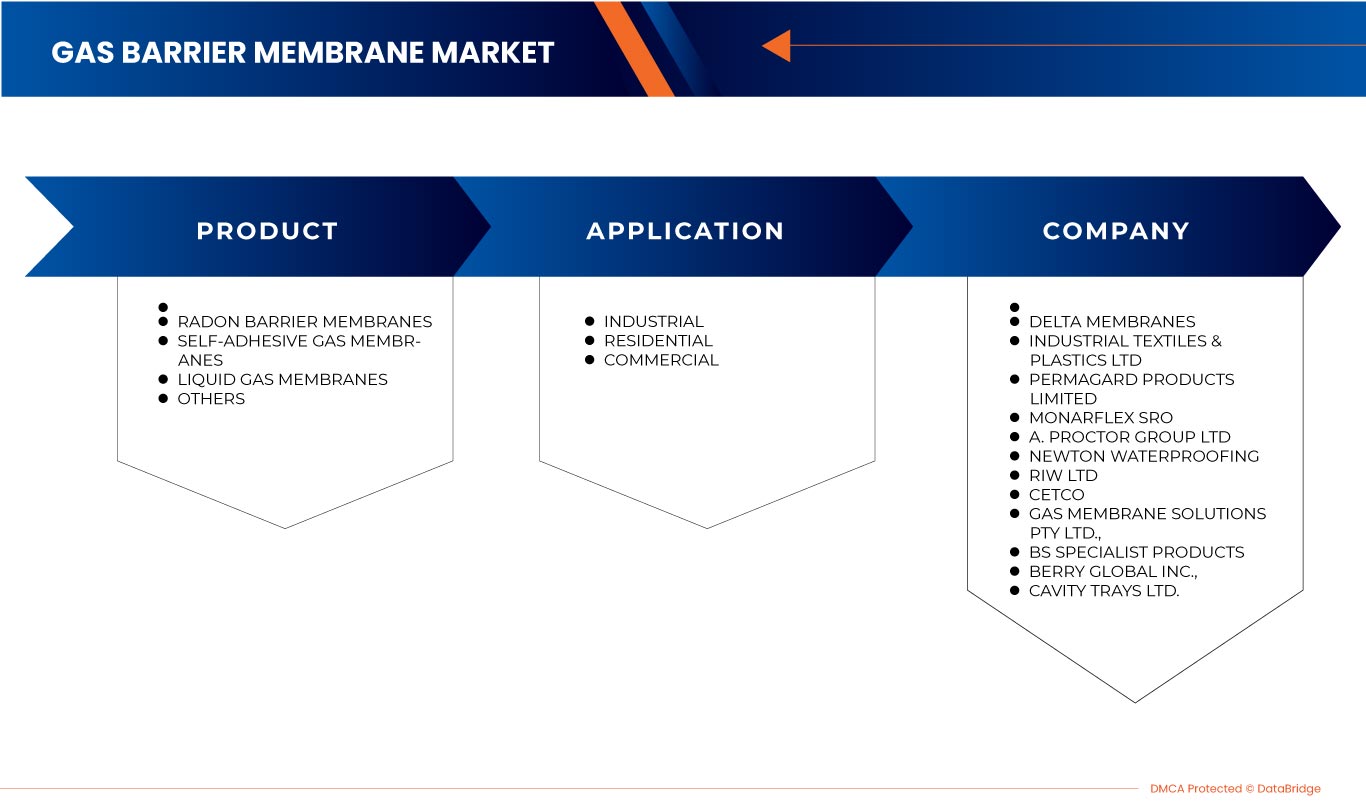
The Europe gas barrier membrane market is segmented into two notable segments based on product and application. The growth amongst these segments will help you analyze major growth segments in the industries and provide the users with a valuable market overview and market insights to make strategic decisions to identify core market applications.
Product
- Radon Barrier Membranes
- Self-Adhesive Gas Membranes
- Liquid Gas Membranes
- Others
Based on product, the market is segmented into radon barrier membranes, self-adhesive gas membranes, liquid gas membranes, and others.
Application
- Industrial
- Residential
- Commercial
Based on application, the market is segmented into industrial, residential, and commercial.
Europe Gas Barrier Membrane Market Regional Analysis/Insights
The Europe gas barrier membrane market is analyzed and market size information is provided based on country, product, and application.
The countries covered in this market report are Germany, U.K., France, Italy, Spain, Russia, Turkey, Belgium, Netherlands, Switzerland, and rest of Europe.
Germany is expected to dominate the Europe gas barrier membrane market due to the high number of market players present in the country and the increased consumption rate of gas barrier membranes for construction and industrial purposes.
The country section of the report also provides individual market-impacting factors and changes in market regulation that impact the current and future trends of the market. Data points, downstream and upstream value chain analysis, technical test and porter's five forces analysis, and case studies are some of the pointers used to forecast the market scenario for individual countries. Also, the presence and availability of the Europe brands and the challenges faced due to large or scarce competition from local and domestic brands, the impact of domestic tariffs, and trade routes are considered while providing a forecast analysis of the country’s data.
Competitive Landscape and Europe Gas Barrier Membrane Market Share Analysis
ヨーロッパのガスバリア膜市場の競争状況は、競合他社の詳細を提供します。含まれる詳細には、会社概要、会社の財務状況、収益、市場の可能性、研究開発への投資、新しい市場への取り組み、生産拠点と施設、会社の強みと弱み、製品の発売、製品試験パイプライン、製品の承認、特許、製品の幅と広さ、アプリケーションの優位性、および技術ライフライン曲線が含まれます。提供された上記のデータ ポイントは、市場に関連する会社の焦点にのみ関連しています。
ヨーロッパのガスバリア膜市場で活動している主な企業としては、Delta Membranes、Industrial Textiles & Plastics Ltd、Permagard Products Limited、Monarflex sro、A. Proctor Group Ltd、Newton Waterproofing、RIW Ltd、CETCO、Gas Membrane Solutions Pty Ltd.、BS SPECIALIST PRODUCTS、Berry Global Inc.、Cavity Trays Ltd などがあります。
SKU-
世界初のマーケットインテリジェンスクラウドに関するレポートにオンラインでアクセスする
- インタラクティブなデータ分析ダッシュボード
- 成長の可能性が高い機会のための企業分析ダッシュボード
- カスタマイズとクエリのためのリサーチアナリストアクセス
- インタラクティブなダッシュボードによる競合分析
- 最新ニュース、更新情報、トレンド分析
- 包括的な競合追跡のためのベンチマーク分析のパワーを活用
目次
1 INTRODUCTION
1.1 OBJECTIVES OF THE STUDY
1.2 MARKET DEFINITION
1.3 OVERVIEW
1.4 LIMITATIONS
1.5 MARKETS COVERED
2 MARKET SEGMENTATION
2.1 MARKETS COVERED
2.2 GEOGRAPHICAL SCOPE
2.3 YEARS CONSIDERED FOR THE STUDY
2.4 CURRENCY AND PRICING
2.5 DBMR TRIPOD DATA VALIDATION MODEL
2.6 RAW MATERIAL LIFELINE CURVE
2.7 MULTIVARIATE MODELING
2.8 PRIMARY INTERVIEWS WITH KEY OPINION LEADERS
2.9 DBMR MARKET POSITION GRID
2.1 MARKET APPLICATION COVERAGE GRID
2.11 DBMR MARKET CHALLENGE MATRIX
2.12 DBMR VENDOR SHARE ANALYSIS
2.13 IMPORT-EXPORT DATA
2.14 SECONDARY SOURCES
2.15 ASSUMPTIONS
3 EXECUTIVE SUMMARY
4 PREMIUM INSIGHTS
4.1 PESTLE ANALYSIS
4.1.1 POLITICAL FACTORS
4.1.2 ECONOMIC FACTORS
4.1.3 SOCIAL FACTORS
4.1.4 TECHNOLOGICAL FACTORS
4.1.5 LEGAL FACTORS
4.1.6 ENVIRONMENTAL FACTORS
4.2 PORTER’S FIVE FORCES
4.2.1 THREAT OF NEW ENTRANTS
4.2.2 THREAT OF SUBSTITUTES
4.2.3 BARGAINING POWER OF BUYERS
4.2.4 BARGAINING POWER OF SUPPLIERS
4.2.5 INTERNAL COMPETITION
4.3 PRICING INDEX
4.4 PRODUCTION CAPACITY OVERVIEW
4.5 PRODUCTION CONSUMPTION ANALYSIS
4.6 RAW MATERIAL COVERAGE
4.7 SUPPLY CHAIN ANALYSIS
4.8 TECHNOLOGICAL ADVANCEMENTS BY MANUFACTURERS
4.9 VENDOR SELECTION CRITERIA
5 REGULATION COVERAGE
6 MARKET OVERVIEW
6.1 DRIVERS
6.1.1 RISING CONCERNS TO PROTECT BUILDING STRUCTURES FROM HAZARDOUS GROUND GASES
6.1.2 INCREASING CONSTRUCTION ACTIVITIES ON CONTAMINATED AND INDUSTRIAL LAND
6.1.3 INCREASE IN DEMAND FOR BIOGAS AND NATURAL GAS
6.2 RESTRAINTS
6.2.1 FLUCTUATIONS AND INSTABILITY IN THE CONSTRUCTION INDUSTRY
6.2.2 LACK OF SKILLED WORKFORCE REQUIRED TO INSTALL THESE MEMBRANES
6.3 OPPORTUNITIES
6.3.1 GROWTH AND EXPANSION OF THE CONSTRUCTION INDUSTRY
6.3.2 ADVANCEMENTS IN TECHNOLOGIES FOR THE PRODUCTION OF GAS MEMBRANES
6.3.3 ENFORCEMENT OF STRICTER GAS AND CARBON EMISSION NORMS
6.4 CHALLENGES
6.4.1 LACK OF AWARENESS REGARDING GAS BARRIER MEMBRANES
6.4.2 UPSCALING AND COMMERCIALIZING NEW MEMBRANES
7 EUROPE GAS BARRIER MEMBRANE MARKET, BY PRODUCT
7.1 OVERVIEW
7.2 RADON BARRIER MEMBRANES
7.3 SELF-ADHESIVE GAS MEMBRANES
7.4 LIQUID GAS MEMBRANES
7.5 OTHERS
8 EUROPE GAS BARRIER MEMBRANE MARKET, BY APPLICATION
8.1 OVERVIEW
8.2 INDUSTRIAL
8.2.1 OIL AND GAS
8.2.2 MINING
8.2.3 FOOD AND BEVERAGES
8.2.4 PHARMACEUTICALS
8.2.5 CHEMICAL PROCESSING
8.2.6 OTHERS
8.2.6.1 RADON BARRIER MEMBRANES
8.2.6.2 SELF-ADHESIVE GAS MEMBRANES
8.2.6.3 LIQUID GAS MEMBRANES
8.2.6.4 OTHERS
8.3 RESIDENTIAL
8.3.1 RADON BARRIER MEMBRANES
8.3.2 SELF-ADHESIVE GAS MEMBRANES
8.3.3 LIQUID GAS MEMBRANES
8.3.4 OTHERS
8.4 COMMERCIAL
8.4.1 RADON BARRIER MEMBRANES
8.4.2 SELF-ADHESIVE GAS MEMBRANES
8.4.3 LIQUID GAS MEMBRANES
8.4.4 OTHERS
9 EUROPE GAS BARRIER MEMBRANE MARKET, BY COUNTRY
9.1 GERMANY
9.2 U.K.
9.3 FRANCE
9.4 ITALY
9.5 RUSSIA
9.6 SPAIN
9.7 SWITZERLAND
9.8 TURKEY
9.9 BELGIUM
9.1 NETHERLANDS
9.11 REST OF EUROPE
10 COMPANY SHARE ANALYSIS: EUROPE
10.1 AWARD
11 SWOT ANALYSIS
12 COMPANY PROFILES
12.1 CETCO
12.1.1 COMPANY SNAPSHOT
12.1.2 SWOT ANALYSIS
12.1.3 PRODUCT PORTFOLIO
12.1.4 RECENT UPDATES
12.2 GAS MEMBRANE SOLUTIONS PTY LTD
12.2.1 COMPANY SNAPSHOT
12.2.2 SWOT ANALYSIS
12.3 RIWA LTD
12.3.1 COMPANY SNAPSHOT
12.3.2 SWOT ANALYSIS
12.3.3 PRODUCT PORTFOLIO
12.3.4 RECENT UPDATES
12.4 BERRY GLOBAL INC.
12.4.1 COMPANY SNAPSHOT
12.4.2 REVENUE ANALYSIS
12.4.3 SWOT ANALYSIS
12.4.4 PRODUCT PORTFOLIO
12.4.5 RECENT UPDATES
12.5 INDUSTRIAL TEXTILES & PLASTICS LTD
12.5.1 COMPANY SNAPSHOT
12.5.2 SWOT ANALYSIS
12.5.3 PRODUCT PORTFOLIO
12.5.4 RECENT UPDATES
12.6 A. PROCTOR GROUP LTD.
12.6.1 COMPANY SNAPSHOT
12.6.2 SWOT ANALYSIS
12.6.3 PRODUCT PORTFOLIO
12.6.4 RECENT UPDATE
12.7 BS SPECIALIST PRODUCTS
12.7.1 COMPANY SNAPSHOT
12.7.2 SWOT ANALYSIS
12.7.3 PRODUCT PORTFOLIO
12.7.4 RECENT UPDATES
12.8 CAVITY TRAYS LTD.
12.8.1 COMPANY SNAPSHOT
12.8.2 SWOT ANALYSIS
12.8.3 PRODUCT PORTFOLIO
12.8.4 RECENT UPDATES
12.9 DELTA MEMBRANES
12.9.1 COMPANY SNAPSHOT
12.9.2 SWOT ANALYSIS
12.9.3 PRODUCT PORTFOLIO
12.9.4 RECENT UPDATES
12.1 MONARFLEX SRO
12.10.1 COMPANY SNAPSHOT
12.10.2 SWOT ANALYSIS
12.10.3 PRODUCT PORTFOLIO
12.10.4 RECENT UPDATES
12.11 NEWTON WATERPROOFING
12.11.1 COMPANY SNAPSHOT
12.11.2 SWOT ANALYSIS
12.11.3 PRODUCT PORTFOLIO
12.11.4 RECENT UPDATES
12.11.5 PRODUCT PORTFOLIO
12.11.6 RECENT UPDATES
12.12 PERMAGARD PRODUCTS LIMITED
12.12.1 COMPANY SNAPSHOT
12.12.2 SWOT ANALYSIS
12.12.3 PRODUCT PORTFOLIO
12.12.4 RECENT UPDATES
13 QUESTIONNAIRE
14 RELATED REPORTS
表のリスト
TABLE 1 IMPORT DATA OF SELF-ADHESIVE PLATES, SHEETS, FILM, FOIL, TAPE, STRIP, AND OTHER FLAT SHAPES, OF PLASTICS ...; HS CODE – 391990 (USD THOUSAND)
TABLE 2 EXPORT DATA OF SELF-ADHESIVE PLATES, SHEETS, FILM, FOIL, TAPE, STRIP AND OTHER FLAT SHAPES, OF PLASTICS; HS CODE – 391990 (USD THOUSAND)
TABLE 3 REGULATORY FRAMEWORK
TABLE 4 EUROPE GAS BARRIER MEMBRANE MARKET, BY PRODUCT, 2021-2030 (USD THOUSAND)
TABLE 5 EUROPE GAS BARRIER MEMBRANE MARKET, BY APPLICATION, 2021-2030 (USD THOUSAND)
TABLE 6 EUROPE INDUSTRIAL IN GAS BARRIER MEMBRANE MARKET, BY CATEGORY, 2021-2030 (USD THOUSAND)
TABLE 7 EUROPE INDUSTRIAL IN GAS BARRIER MEMBRANE MARKET, BY PRODUCT, 2021-2030 (USD THOUSAND)
TABLE 8 EUROPE RESIDENTIAL IN GAS BARRIER MEMBRANE MARKET, BY PRODUCT, 2021-2030 (USD THOUSAND)
TABLE 9 EUROPE COMMERCIAL IN GAS BARRIER MEMBRANE MARKET, BY PRODUCT, 2021-2030 (USD THOUSAND)
TABLE 10 EUROPE GAS BARRIER MEMBRANE MARKET, BY COUNTRY, 2021-2030 (USD THOUSAND)
TABLE 11 GERMANY GAS BARRIER MEMBRANE MARKET, BY PRODUCT, 2021-2030 (USD THOUSAND)
TABLE 12 GERMANY GAS BARRIER MEMBRANE MARKET, BY APPLICATION, 2021-2030 (USD THOUSAND)
TABLE 13 GERMANY INDUSTRIAL IN GAS BARRIER MEMBRANE MARKET, BY CATEGORY, 2021-2030 (USD THOUSAND)
TABLE 14 GERMANY INDUSTRIAL IN GAS BARRIER MEMBRANE MARKET, BY PRODUCT, 2021-2030 (USD THOUSAND)
TABLE 15 GERMANY RESIDENTIAL GAS BARRIER MEMBRANE MARKET, BY PRODUCT , 2021-2030 (USD THOUSAND)
TABLE 16 GERMANY COMMERCIAL GAS BARRIER MEMBRANE MARKET, BY PRODUCT, 2021-2030 (USD THOUSAND)
TABLE 17 U.K. GAS BARRIER MEMBRANE MARKET, BY PRODUCT, 2021-2030 (USD THOUSAND)
TABLE 18 U.K. GAS BARRIER MEMBRANE MARKET, BY APPLICATION, 2021-2030 (USD THOUSAND)
TABLE 19 U.K. INDUSTRIAL IN GAS BARRIER MEMBRANE MARKET, BY CATEGORY, 2021-2030 (USD THOUSAND)
TABLE 20 U.K. INDUSTRIAL IN GAS BARRIER MEMBRANE MARKET, BY PRODUCT, 2021-2030 (USD THOUSAND)
TABLE 21 U.K. RESIDENTIAL GAS BARRIER MEMBRANE MARKET, BY PRODUCT , 2021-2030 (USD THOUSAND)
TABLE 22 U.K. COMMERCIAL GAS BARRIER MEMBRANE MARKET, BY PRODUCT, 2021-2030 (USD THOUSAND)
TABLE 23 FRANCE GAS BARRIER MEMBRANE MARKET, BY PRODUCT, 2021-2030 (USD THOUSAND)
TABLE 24 FRANCE GAS BARRIER MEMBRANE MARKET, BY APPLICATION, 2021-2030 (USD THOUSAND)
TABLE 25 FRANCE INDUSTRIAL IN GAS BARRIER MEMBRANE MARKET, BY CATEGORY, 2021-2030 (USD THOUSAND)
TABLE 26 FRANCE INDUSTRIAL IN GAS BARRIER MEMBRANE MARKET, BY PRODUCT, 2021-2030 (USD THOUSAND)
TABLE 27 FRANCE RESIDENTIAL GAS BARRIER MEMBRANE MARKET, BY PRODUCT , 2021-2030 (USD THOUSAND)
TABLE 28 FRANCE COMMERCIAL GAS BARRIER MEMBRANE MARKET, BY PRODUCT, 2021-2030 (USD THOUSAND)
TABLE 29 ITALY GAS BARRIER MEMBRANE MARKET, BY PRODUCT, 2021-2030 (USD THOUSAND)
TABLE 30 ITALY GAS BARRIER MEMBRANE MARKET, BY APPLICATION, 2021-2030 (USD THOUSAND)
TABLE 31 ITALY INDUSTRIAL IN GAS BARRIER MEMBRANE MARKET, BY CATEGORY, 2021-2030 (USD THOUSAND)
TABLE 32 ITALY INDUSTRIAL IN GAS BARRIER MEMBRANE MARKET, BY PRODUCT, 2021-2030 (USD THOUSAND)
TABLE 33 ITALY RESIDENTIAL GAS BARRIER MEMBRANE MARKET, BY PRODUCT , 2021-2030 (USD THOUSAND)
TABLE 34 ITALY COMMERCIAL GAS BARRIER MEMBRANE MARKET, BY PRODUCT, 2021-2030 (USD THOUSAND)
TABLE 35 RUSSIA GAS BARRIER MEMBRANE MARKET, BY PRODUCT, 2021-2030 (USD THOUSAND)
TABLE 36 RUSSIA GAS BARRIER MEMBRANE MARKET, BY APPLICATION, 2021-2030 (USD THOUSAND)
TABLE 37 RUSSIA INDUSTRIAL IN GAS BARRIER MEMBRANE MARKET, BY CATEGORY, 2021-2030 (USD THOUSAND)
TABLE 38 RUSSIA INDUSTRIAL IN GAS BARRIER MEMBRANE MARKET, BY PRODUCT, 2021-2030 (USD THOUSAND)
TABLE 39 RUSSIA RESIDENTIAL GAS BARRIER MEMBRANE MARKET, BY PRODUCT , 2021-2030 (USD THOUSAND)
TABLE 40 RUSSIA COMMERCIAL GAS BARRIER MEMBRANE MARKET, BY PRODUCT, 2021-2030 (USD THOUSAND)
TABLE 41 SPAIN GAS BARRIER MEMBRANE MARKET, BY PRODUCT, 2021-2030 (USD THOUSAND)
TABLE 42 SPAIN GAS BARRIER MEMBRANE MARKET, BY APPLICATION, 2021-2030 (USD THOUSAND)
TABLE 43 SPAIN INDUSTRIAL IN GAS BARRIER MEMBRANE MARKET, BY CATEGORY, 2021-2030 (USD THOUSAND)
TABLE 44 SPAIN INDUSTRIAL IN GAS BARRIER MEMBRANE MARKET, BY PRODUCT, 2021-2030 (USD THOUSAND)
TABLE 45 SPAIN RESIDENTIAL GAS BARRIER MEMBRANE MARKET, BY PRODUCT , 2021-2030 (USD THOUSAND)
TABLE 46 SPAIN COMMERCIAL GAS BARRIER MEMBRANE MARKET, BY PRODUCT, 2021-2030 (USD THOUSAND)
TABLE 47 SWITZERLAND GAS BARRIER MEMBRANE MARKET, BY PRODUCT, 2021-2030 (USD THOUSAND)
TABLE 48 SWITZERLAND GAS BARRIER MEMBRANE MARKET, BY APPLICATION, 2021-2030 (USD THOUSAND)
TABLE 49 SWITZERLAND INDUSTRIAL IN GAS BARRIER MEMBRANE MARKET, BY CATEGORY, 2021-2030 (USD THOUSAND)
TABLE 50 SWITZERLAND INDUSTRIAL IN GAS BARRIER MEMBRANE MARKET, BY PRODUCT, 2021-2030 (USD THOUSAND)
TABLE 51 SWITZERLAND RESIDENTIAL GAS BARRIER MEMBRANE MARKET, BY PRODUCT , 2021-2030 (USD THOUSAND)
TABLE 52 SWITZERLAND COMMERCIAL GAS BARRIER MEMBRANE MARKET, BY PRODUCT, 2021-2030 (USD THOUSAND)
TABLE 53 TURKEY GAS BARRIER MEMBRANE MARKET, BY PRODUCT, 2021-2030 (USD THOUSAND)
TABLE 54 TURKEY GAS BARRIER MEMBRANE MARKET, BY APPLICATION, 2021-2030 (USD THOUSAND)
TABLE 55 TURKEY INDUSTRIAL IN GAS BARRIER MEMBRANE MARKET, BY CATEGORY, 2021-2030 (USD THOUSAND)
TABLE 56 TURKEY INDUSTRIAL IN GAS BARRIER MEMBRANE MARKET, BY PRODUCT, 2021-2030 (USD THOUSAND)
TABLE 57 TURKEY RESIDENTIAL GAS BARRIER MEMBRANE MARKET, BY PRODUCT, 2021-2030 (USD THOUSAND)
TABLE 58 TURKEY COMMERCIAL GAS BARRIER MEMBRANE MARKET, BY PRODUCT, 2021-2030 (USD THOUSAND)
TABLE 59 BELGIUM GAS BARRIER MEMBRANE MARKET, BY PRODUCT, 2021-2030 (USD THOUSAND)
TABLE 60 BELGIUM GAS BARRIER MEMBRANE MARKET, BY APPLICATION, 2021-2030 (USD THOUSAND)
TABLE 61 BELGIUM INDUSTRIAL IN GAS BARRIER MEMBRANE MARKET, BY CATEGORY, 2021-2030 (USD THOUSAND)
TABLE 62 BELGIUM INDUSTRIAL IN GAS BARRIER MEMBRANE MARKET, BY PRODUCT, 2021-2030 (USD THOUSAND)
TABLE 63 BELGIUM RESIDENTIAL GAS BARRIER MEMBRANE MARKET, BY PRODUCT , 2021-2030 (USD THOUSAND)
TABLE 64 BELGIUM COMMERCIAL GAS BARRIER MEMBRANE MARKET, BY PRODUCT, 2021-2030 (USD THOUSAND)
TABLE 65 NETHERLANDS GAS BARRIER MEMBRANE MARKET, BY PRODUCT, 2021-2030 (USD THOUSAND)
TABLE 66 NETHERLANDS GAS BARRIER MEMBRANE MARKET, BY APPLICATION, 2021-2030 (USD THOUSAND)
TABLE 67 NETHERLANDS INDUSTRIAL IN GAS BARRIER MEMBRANE MARKET, BY CATEGORY, 2021-2030 (USD THOUSAND)
TABLE 68 NETHERLANDS INDUSTRIAL IN GAS BARRIER MEMBRANE MARKET, BY PRODUCT, 2021-2030 (USD THOUSAND)
TABLE 69 NETHERLANDS RESIDENTIAL GAS BARRIER MEMBRANE MARKET, BY PRODUCT , 2021-2030 (USD THOUSAND)
TABLE 70 NETHERLANDS COMMERCIAL GAS BARRIER MEMBRANE MARKET, BY PRODUCT, 2021-2030 (USD THOUSAND)
TABLE 71 REST OF EUROPE GAS BARRIER MEMBRANE MARKET, BY PRODUCT, 2021-2030 (USD THOUSAND)
図表一覧
FIGURE 1 EUROPE GAS BARRIER MEMBRANE MARKET
FIGURE 2 EUROPE GAS BARRIER MEMBRANE MARKET: DATA TRIANGULATION
FIGURE 3 EUROPE GAS BARRIER MEMBRANE MARKET: DROC ANALYSIS
FIGURE 4 EUROPE GAS BARRIER MEMBRANE MARKET: EUROPE MARKET ANALYSIS
FIGURE 5 EUROPE GAS BARRIER MEMBRANE MARKET: COMPANY RESEARCH ANALYSIS
FIGURE 6 EUROPE GAS BARRIER MEMBRANE MARKET: THE RAW MATERIAL LIFELINE CURVE
FIGURE 7 EUROPE GAS BARRIER MEMBRANE MARKET: MULTIVARIATE MODELLING
FIGURE 8 EUROPE GAS BARRIER MEMBRANE MARKET: INTERVIEW DEMOGRAPHICS
FIGURE 9 EUROPE GAS BARRIER MEMBRANE MARKET: DBMR MARKET POSITION GRID
FIGURE 10 EUROPE GAS BARRIER MEMBRANE MARKET: MARKET APPLICATION COVERAGE GRID
FIGURE 11 EUROPE GAS BARRIER MEMBRANE MARKET: THE MARKET CHALLENGE MATRIX
FIGURE 12 EUROPE GAS BARRIER MEMBRANE MARKET: VENDOR SHARE ANALYSIS
FIGURE 13 EUROPE GAS BARRIER MEMBRANE MARKET: SEGMENTATION
FIGURE 14 RISING CONCERNS TO PROTECT THE BUILDING STRUCTURES FROM HAZARDOUS GROUND GASES ARE EXPECTED TO DRIVE EUROPE GAS BARRIER MEMBRANE MARKET IN THE FORECAST PERIOD
FIGURE 15 RADON BARRIER MEMBRANES SEGMENT IS EXPECTED TO ACCOUNT FOR THE LARGEST SHARE OF THE EUROPE GAS BARRIER MEMBRANE MARKET IN 2023 AND 2030
FIGURE 16 PRICE ANALYSIS FOR EUROPE GAS BARRIER MEMBRANE MARKET (USD/METER)
FIGURE 17 DRIVERS, RESTRAINTS, OPPORTUNITIES, AND CHALLENGES OF THE EUROPE GAS BARRIER MEMBRANE MARKET
FIGURE 18 EUROPE GAS BARRIER MEMBRANE MARKET, BY PRODUCT, 2022
FIGURE 19 EUROPE GAS BARRIER MEMBRANE MARKET, BY APPLICATION, 2022
FIGURE 20 EUROPE GAS BARRIER MEMBRANE MARKET: SNAPSHOT (2022)
FIGURE 21 EUROPE GAS BARRIER MEMBRANE MARKET: BY COUNTRY (2022)
FIGURE 22 EUROPE GAS BARRIER MEMBRANE MARKET: BY COUNTRY (2023 & 2030)
FIGURE 23 EUROPE GAS BARRIER MEMBRANE MARKET: BY COUNTRY (2022 & 2030)
FIGURE 24 EUROPE GAS BARRIER MEMBRANE MARKET: BY PRODUCT (2023-2030)
FIGURE 25 EUROPE GAS BARRIER MEMBRANE MARKET: COMPANY SHARE 2022 (%)

調査方法
データ収集と基準年分析は、大規模なサンプル サイズのデータ収集モジュールを使用して行われます。この段階では、さまざまなソースと戦略を通じて市場情報または関連データを取得します。過去に取得したすべてのデータを事前に調査および計画することも含まれます。また、さまざまな情報ソース間で見られる情報の不一致の調査も含まれます。市場データは、市場統計モデルと一貫性モデルを使用して分析および推定されます。また、市場シェア分析と主要トレンド分析は、市場レポートの主要な成功要因です。詳細については、アナリストへの電話をリクエストするか、お問い合わせをドロップダウンしてください。
DBMR 調査チームが使用する主要な調査方法は、データ マイニング、データ変数が市場に与える影響の分析、および一次 (業界の専門家) 検証を含むデータ三角測量です。データ モデルには、ベンダー ポジショニング グリッド、市場タイムライン分析、市場概要とガイド、企業ポジショニング グリッド、特許分析、価格分析、企業市場シェア分析、測定基準、グローバルと地域、ベンダー シェア分析が含まれます。調査方法について詳しくは、お問い合わせフォームから当社の業界専門家にご相談ください。
カスタマイズ可能
Data Bridge Market Research は、高度な形成的調査のリーダーです。当社は、既存および新規のお客様に、お客様の目標に合致し、それに適したデータと分析を提供することに誇りを持っています。レポートは、対象ブランドの価格動向分析、追加国の市場理解 (国のリストをお問い合わせください)、臨床試験結果データ、文献レビュー、リファービッシュ市場および製品ベース分析を含めるようにカスタマイズできます。対象競合他社の市場分析は、技術ベースの分析から市場ポートフォリオ戦略まで分析できます。必要な競合他社のデータを、必要な形式とデータ スタイルでいくつでも追加できます。当社のアナリスト チームは、粗い生の Excel ファイル ピボット テーブル (ファクト ブック) でデータを提供したり、レポートで利用可能なデータ セットからプレゼンテーションを作成するお手伝いをしたりすることもできます。


