North America Industrial Sugar Market
Tamaño del mercado en miles de millones de dólares
Tasa de crecimiento anual compuesta (CAGR) :
% 
 USD
6,123.33 Million
USD
7,769.59 Million
2022
2030
USD
6,123.33 Million
USD
7,769.59 Million
2022
2030
| 2023 –2030 | |
| USD 6,123.33 Million | |
| USD 7,769.59 Million | |
|
|
|
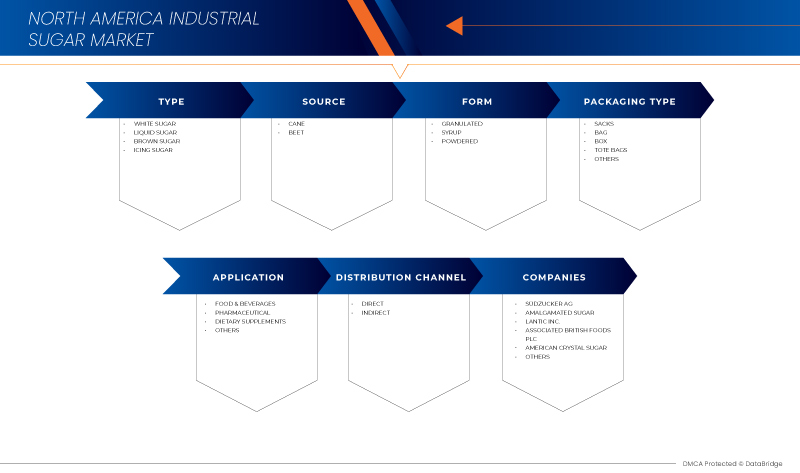
Mercado de azúcar industrial de América del Norte, por tipo (azúcar blanco, azúcar líquido, azúcar moreno y azúcar glas), fuente (caña y remolacha), forma (granulado, jarabe y en polvo), tipo de embalaje (sacos, bolsas, cajas, bolsas de mano y otros), aplicación (alimentos y bebidas, productos farmacéuticos, suplementos dietéticos y otros), canal de distribución (directo e indirecto) - Tendencias de la industria y pronóstico hasta 2030.
Análisis y tamaño del mercado de azúcar industrial en América del Norte
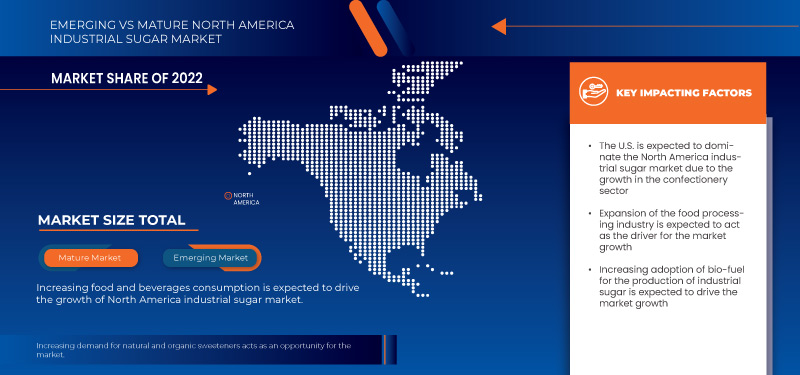
El mercado de azúcar industrial de América del Norte está siendo impulsado por el aumento del uso de azúcar industrial en bebidas en todo el mundo junto con la expansión de la industria de procesamiento de alimentos. Además, es probable que el rápido crecimiento en el sector de la confitería impulse el crecimiento del mercado. Además, la creciente adopción del uso de biocombustibles para la producción de azúcar abrirá más potencial comercial para el mercado de azúcar industrial en el período previsto de 2023 a 2030.
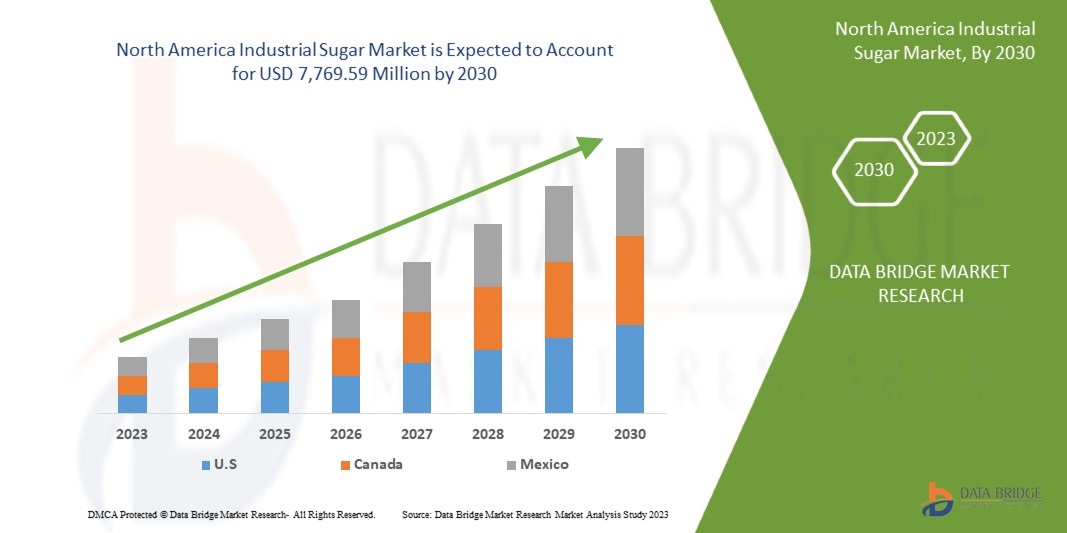
Data Bridge Market Research analiza que se espera que el mercado de azúcar industrial de América del Norte alcance un valor de USD 7.769,59 millones para 2030 desde USD 6.123,33 millones en 2022, creciendo a una CAGR del 3,1% durante el período de pronóstico de 2023 a 2030.
|
Métrica del informe |
Detalles |
|
Período de pronóstico |
2023 a 2030 |
|
Año base |
2022 |
|
Año histórico |
2021 (adaptado al periodo 2015-2020) |
|
Unidades cuantitativas |
Ingresos en millones de USD y volumen en kilotoneladas |
|
Segmentos cubiertos |
Tipo (azúcar blanco, azúcar líquido, azúcar moreno y azúcar glas), origen (caña y remolacha), forma (granulado, jarabe y en polvo), tipo de embalaje (sacos, bolsas, cajas, bolsas de mano y otros), aplicación (alimentos y bebidas, productos farmacéuticos, suplementos dietéticos y otros), canal de distribución (directo e indirecto) |
|
Países cubiertos |
Estados Unidos, Canadá y México |
|
Actores del mercado cubiertos |
Südzucker AG, Michigan Sugar Company, Amalgamated Sugar., Associated British Foods, Lantic Inc. y AMERICAN CRYSTAL SUGAR, entre otras. |
Definición de mercado
El azúcar industrial, también conocido como azúcar a granel o azúcar comercial, se utiliza en diversos sectores y tiene una importante cuota de mercado. Este azúcar altamente refinado se utiliza principalmente con fines industriales, más que para el consumo directo. Sus propiedades versátiles y su amplia gama de aplicaciones lo convierten en un ingrediente esencial en diversas industrias, lo que alimenta un próspero mercado del azúcar industrial.
Dinámica del mercado del azúcar industrial en América del Norte
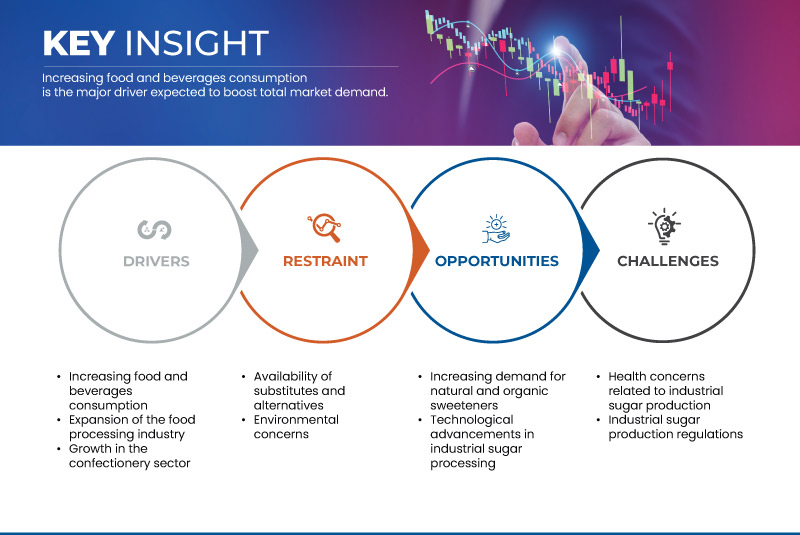
En esta sección se aborda la comprensión de los factores impulsores del mercado, las ventajas, las oportunidades, las limitaciones y los desafíos. Todo esto se analiza en detalle a continuación:
Conductores
- Aumento del consumo de alimentos y bebidas
El consumo de bebidas azucaradas ha aumentado como resultado de la rápida urbanización, que ha incrementado el consumo de alimentos y bebidas en América del Norte. Aunque el azúcar refinado puede aceptarse como parte de una dieta saludable, las bebidas azucaradas se publicitan ampliamente, son económicas y están ampliamente disponibles. Entre ellas se incluyen los refrescos, los licores, las bebidas energéticas, las bebidas deportivas y el agua mineral saborizada. Además, el tamaño estándar de las porciones ha cambiado de botellas de 375 ml a 600 ml, lo que ha aumentado la cantidad de azúcar industrial a medida que el consumo de bebidas ha aumentado durante el período previsto.
Además, el mercado de azúcar industrial de América del Norte ha crecido significativamente en los últimos años, debido principalmente al mayor uso de azúcar industrial en la industria de las bebidas. El azúcar industrial, derivado de la caña de azúcar o la remolacha azucarera, se utiliza para endulzar una variedad de bebidas, incluyendo refrescos carbonatados, bebidas energéticas, jugos de frutas y bebidas listas para beber . Sin embargo, las economías emergentes, como China, India y Brasil, han sido testigos de un aumento en el consumo de bebidas debido a factores como el aumento de los ingresos disponibles y la urbanización. A medida que estos mercados se expanden, hay un aumento correspondiente en el uso de azúcar industrial en bebidas para satisfacer la creciente demanda de los consumidores. Por lo tanto, se espera que el aumento del consumo de alimentos y bebidas impulse el crecimiento del mercado.
- Creciente adopción de biocombustibles para la producción de azúcar industrial
El uso de biocombustibles en el proceso de fabricación está experimentando un cambio significativo en el mercado. Los biocombustibles son un sustituto sostenible de los combustibles fósiles porque se elaboran a partir de recursos renovables como el bagazo de caña de azúcar y la pulpa de remolacha. Las industrias de procesamiento de alimentos, confitería y bebidas en expansión están impulsando la demanda de azúcar industrial. Tradicionalmente, la maquinaria y el equipo utilizados en la producción de azúcar han funcionado con combustibles fósiles. Pero la industria está moviéndose hacia el uso de biocombustibles a medida que la sostenibilidad y la reducción de las emisiones de carbono adquieren mayor importancia.
El creciente énfasis en la energía renovable y la sostenibilidad ha impulsado a los gobiernos a implementar incentivos y mecanismos de apoyo para la producción de biocombustibles. Los productores industriales de azúcar pueden aprovechar estas oportunidades colaborando con agencias gubernamentales y accediendo a programas de financiamiento para facilitar el uso de biocombustibles en sus operaciones. El creciente uso de biocombustibles en la producción de azúcar industrial representa una oportunidad significativa para el crecimiento del mercado. Los fabricantes de azúcar industrial están pasando de los combustibles fósiles a los biocombustibles debido a la sostenibilidad ambiental, el apoyo regulatorio y la eficiencia de costos. Los productores industriales de azúcar pueden beneficiarse de los incentivos gubernamentales, la mejora de la imagen de marca y la diferenciación en el mercado. Las tendencias del mercado, como la incorporación de biorrefinerías y la I+D en curso, contribuyen a la expansión y sostenibilidad de la utilización de biocombustibles.
Como resultado, se espera que el mayor uso de biocombustibles en la producción de azúcar industrial impulse el crecimiento del mercado.
Restricción/Desafío
- Disponibilidad de sustitutos y alternativas
El mercado de azúcar industrial de América del Norte está adoptando cada vez más sustitutos y alternativas. Este cambio está siendo impulsado por una variedad de factores, incluidos los cambios en las preferencias de los consumidores, las preocupaciones por la salud, las preocupaciones por la sostenibilidad y los cambios regulatorios. La caña de azúcar y la remolacha azucarera han sido tradicionalmente las principales fuentes de azúcar en el mercado de azúcar industrial. Sin embargo, la dinámica cambiante del mercado y las demandas de los consumidores han impulsado la exploración y el uso de sustitutos y alternativas al azúcar industrial tradicional.
Oportunidad
- Demanda creciente de edulcorantes naturales y orgánicos
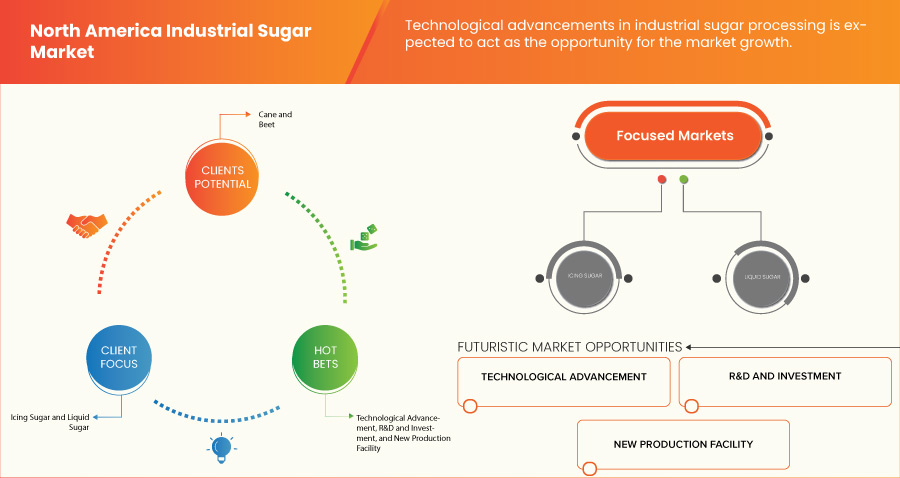
La industria azucarera industrial mundial está experimentando un enorme crecimiento como resultado de los avances tecnológicos en el procesamiento del azúcar. A medida que la demanda de azúcar continúa aumentando, los fabricantes están buscando nuevas tecnologías y métodos para aumentar la eficiencia, mejorar la calidad y satisfacer las expectativas cambiantes de los consumidores. El procesamiento del azúcar tradicionalmente se basa en métodos convencionales como la molienda, la purificación y la cristalización. Sin embargo, los avances tecnológicos han revolucionado la industria, introduciendo nuevas técnicas y equipos que agilizan la producción, optimizan la utilización de los recursos y mejoran la calidad del producto. Estos avances están reconfigurando el mercado del azúcar industrial de América del Norte y creando oportunidades para que los fabricantes sigan siendo competitivos en un panorama que cambia rápidamente.
Las refinerías de azúcar se están convirtiendo en fábricas inteligentes gracias a la digitalización. La recopilación, el análisis y el monitoreo remoto de datos en tiempo real son posibles gracias a la implementación de sensores , dispositivos de Internet de las cosas (IoT) y plataformas basadas en la nube. Esta integración de la cadena de suministro es posible gracias a la transformación digital, que también aumenta la eficacia operativa y facilita el mantenimiento predictivo. Los avances tecnológicos en el procesamiento del azúcar tienen perspectivas significativas para el sector azucarero industrial.
Por lo tanto, los actores clave del mercado están explorando oportunidades para desarrollar avances en tecnologías de producción y lanzar nuevos productos innovadores, ofreciendo así una amplia oportunidad para el crecimiento del mercado.
Desarrollo reciente
- En 2023, Snake River Sugar Company y The Amalgamated Sugar Company LLC se fusionaron para formar Amalgamated Sugar Company, una cooperativa propiedad de productores. Esta colaboración ayudó a la organización a fomentar la innovación, ampliar los recursos, mejorar la experiencia y acelerar el crecimiento.
Panorama del mercado del azúcar industrial en América del Norte
El mercado de azúcar industrial de América del Norte se divide en seis segmentos importantes según el tipo, la fuente, la forma, el tipo de empaque, la aplicación y el canal de distribución. El crecimiento entre estos segmentos le ayudará a analizar los principales segmentos de crecimiento en las industrias y brindará a los usuarios una valiosa descripción general del mercado y conocimientos del mercado para ayudarlos a tomar decisiones estratégicas para identificar las principales aplicaciones del mercado.
Tipo
- Azúcar blanco
- Azúcar líquido
- Azúcar moreno
- Azúcar en polvo
Según el tipo, el mercado está segmentado en azúcar blanco, azúcar líquido, azúcar moreno y azúcar glas.
Fuente
- Caña
- Remolacha
Según la fuente, el mercado está segmentado en caña y remolacha.
Forma
- Granulado
- Jarabe
- En polvo
Según la forma, el mercado está segmentado en granulado, jarabe y en polvo.
Tipo de embalaje
- Sacos
- Bolsa
- Caja
- Bolsas de mano
- Otros
Según el tipo de embalaje, el mercado se segmenta en sacos, bolsas, cajas, bolsas de mano y otros.
Solicitud
- Alimentos y bebidas
- Farmacéutico
- Suplementos dietéticos
- Otros
Según la aplicación, el mercado está segmentado en alimentos y bebidas, productos farmacéuticos, suplementos dietéticos y otros.
Canal de distribución
- Directo
- Indirecto
Sobre la base del canal de distribución, el mercado se segmenta en directo e indirecto.
Análisis y perspectivas regionales del mercado del azúcar industrial en América del Norte
Se analiza el mercado de azúcar industrial de América del Norte y se proporcionan información y tendencias del tamaño del mercado por país, tipo, fuente, forma, tipo de empaque, aplicación y canal de distribución, como se menciona anteriormente.
Los países cubiertos en el informe del mercado de azúcar industrial de América del Norte son Estados Unidos, Canadá y México.
Se espera que Estados Unidos domine el mercado de azúcar industrial de América del Norte debido a la gran producción, la fácil disponibilidad de productos y el aumento de la base de clientes.
La sección de países del informe también proporciona factores de impacto de mercado individuales y cambios en la regulación del mercado que afectan las tendencias actuales y futuras del mercado. Puntos de datos como análisis de la cadena de valor aguas arriba y aguas abajo, tendencias técnicas y análisis de las cinco fuerzas de Porter, estudios de casos son algunos de los indicadores utilizados para pronosticar el escenario del mercado para países individuales. Además, la presencia y disponibilidad de marcas regionales y sus desafíos enfrentados debido a la competencia grande o escasa de las marcas locales y nacionales, el impacto de los aranceles nacionales y las rutas comerciales se consideran al proporcionar un análisis de pronóstico de los datos del país.
Análisis del panorama competitivo y de la cuota de mercado del azúcar industrial en América del Norte
El panorama competitivo del mercado de azúcar industrial de América del Norte ofrece detalles por competidor. Los detalles incluidos son una descripción general de la empresa, las finanzas de la empresa, los ingresos generados, el potencial de mercado, la inversión en investigación y desarrollo, las nuevas iniciativas de mercado, la presencia regional, los sitios e instalaciones de producción, las capacidades de producción, las fortalezas y debilidades de la empresa, el lanzamiento de productos, la amplitud y variedad de productos, y el dominio de las aplicaciones. Los puntos de datos anteriores proporcionados solo están relacionados con el enfoque de las empresas en el mercado de azúcar industrial de América del Norte.
Algunos de los principales actores que operan en el mercado de azúcar industrial de América del Norte son Südzucker AG, Michigan Sugar Company, Amalgamated Sugar, Associated British Foods, Lantic Inc. y AMERICAN CRYSTAL SUGAR, entre otros.
SKU-
Obtenga acceso en línea al informe sobre la primera nube de inteligencia de mercado del mundo
- Panel de análisis de datos interactivo
- Panel de análisis de empresas para oportunidades con alto potencial de crecimiento
- Acceso de analista de investigación para personalización y consultas
- Análisis de la competencia con panel interactivo
- Últimas noticias, actualizaciones y análisis de tendencias
- Aproveche el poder del análisis de referencia para un seguimiento integral de la competencia
Tabla de contenido
1 INTRODUCTION
1.1 OBJECTIVES OF THE STUDY
1.2 MARKET DEFINITION
1.3 OVERVIEW OF THE NORTH AMERICA INDUSTRIAL SUGAR MARKET
1.4 CURRENCY AND PRICING
1.5 LIMITATIONS
1.6 MARKETS COVERED
2 MARKET SEGMENTATION
2.1 MARKETS COVERED
2.2 GEOGRAPHICAL SCOPE
2.3 YEARS CONSIDERED FOR THE STUDY
2.4 CURRENCY AND PRICING
2.5 DBMR TRIPOD DATA VALIDATION MODEL
2.6 PRIMARY INTERVIEWS WITH KEY OPINION LEADERS
2.7 DBMR MARKET POSITION GRID
2.8 MULTIVARIATE MODELLING
2.9 MARKET APPLICATION COVERAGE GRID
2.1 SECONDARY SOURCES
2.11 ASSUMPTIONS
3 EXECUTIVE SUMMARY
4 PREMIUM INSIGHTS
4.1 SUPPLY CHAIN OF THE NORTH AMERICA INDUSTRIAL SUGAR MARKET
4.1.1 RAW MATERIAL PROCUREMENT
4.1.2 PREPARATION OF SUGAR IN SUGAR MILLS
4.1.3 MARKETING AND DISTRIBUTION
4.1.4 END USERS
4.2 BRAND OUTLOOK
4.2.1 COMPARATIVE BRAND ANALYSIS
4.2.2 PRODUCT VS BRAND OVERVIEW
4.3 IMPACT OF ECONOMIC SLOWDOWN
4.3.1 OVERVIEW
4.3.2 IMPACT ON PRICE
4.3.3 IMPACT ON SUPPLY CHAIN
4.3.4 IMPACT ON SHIPMENT
4.3.5 IMPACT ON COMPANY'S STRATEGIC DECISIONS
4.4 INDUSTRIAL CHAIN ANALYSIS
4.4.1 INDUSTRIAL PURCHASING MODE ANALYSIS
4.4.2 INDUSTRIAL RESPONSE TOWARDS FUEL PRODUCTION WITH SUGAR
4.5 PRICE INDEX SCENARIO
4.6 RAW MATERIAL COVERAGE
5 NORTH AMERICA INDUSTRIAL SUGAR MARKET: REGULATIONS
6 MARKET OVERVIEW
6.1 DRIVERS
6.1.1 INCREASING FOOD AND BEVERAGES CONSUMPTION
6.1.2 EXPANSION OF THE FOOD PROCESSING INDUSTRY
6.1.3 GROWTH IN THE CONFECTIONERY SECTOR
6.1.4 INCREASING ADOPTION OF BIO-FUEL FOR THE PRODUCTION OF INDUSTRIAL SUGAR
6.2 RESTRAINTS
6.2.1 AVAILABILITY OF SUBSTITUTES AND ALTERNATIVES
6.2.2 ENVIRONMENTAL CONCERNS
6.2.3 WATER SCARCITY AND LAND MANAGEMENT ISSUES
6.3 OPPORTUNITIES
6.3.1 INCREASING DEMAND FOR NATURAL AND ORGANIC SWEETENERS
6.3.2 TECHNOLOGICAL ADVANCEMENTS IN INDUSTRIAL SUGAR PROCESSING
6.3.3 INTERNATIONAL TRADE EXPANSION
6.4 CHALLENGES
6.4.1 HEALTH CONCERNS RELATED TO INDUSTRIAL SUGAR PRODUCTION
6.4.2 INDUSTRIAL SUGAR PRODUCTION REGULATIONS
6.4.3 FLUCTUATING RAW MATERIAL PRICES
7 NORTH AMERICA INDUSTRIAL SUGAR MARKET, BY TYPE
7.1 OVERVIEW
7.2 WHITE SUGAR
7.3 LIQUID SUGAR
7.4 BROWN SUGAR
7.4.1 REGULAR BROWN SUGAR
7.4.2 LIGHT BROWN SUGAR
7.4.3 DARK BROWN SUGAR
7.5 ICING SUGAR
8 NORTH AMERICA INDUSTRIAL SUGAR MARKET, BY SOURCE
8.1 OVERVIEW
8.2 CANE
8.3 BEET
9 NORTH AMERICA INDUSTRIAL SUGAR MARKET, BY FORM
9.1 OVERVIEW
9.2 GRANULATED
9.3 SYRUP
9.4 POWDERED
10 NORTH AMERICA INDUSTRIAL SUGAR MARKET, BY PACKAGING TYPE
10.1 OVERVIEW
10.2 SACKS
10.3 BAG
10.4 BOX
10.5 TOTE BAGS
10.6 OTHERS
11 NORTH AMERICA INDUSTRIAL SUGAR MARKET, BY APPLICATION
11.1 OVERVIEW
11.2 FOOD & BEVERAGES
11.2.1 TABLE TOP SUGAR
11.2.2 BEVERAGES
11.2.2.1 DAIRY BASED DRINKS
11.2.2.1.1 REGULAR
11.2.2.1.2 PROCESSED MILK
11.2.2.1.3 MILK SHAKES
11.2.2.1.4 FLAVORED MILK
11.2.2.2 JUICES
11.2.3 SMOOTHIES
11.2.3.1 PLANT BASED MILK
11.2.3.2 ENERGY DRINKS
11.2.3.3 SPORTS DRINKS
11.2.3.4 OTHERS
11.2.4 CONFECTIONERY
11.2.4.1 HARD-BOILED SWEETS
11.2.4.2 MINTS
11.2.4.3 GUMS & JELLIES
11.2.4.4 CHOCOLATE
11.2.4.5 CHOCOLATE SYRUPS
11.2.4.6 CARAMELS & TOFFEES
11.2.4.7 OTHERS
11.2.5 BAKERY
11.2.5.1 BREAD & ROLLS
11.2.5.2 CAKES, PASTRIES & TRUFFLE
11.2.5.3 BISCUIT, COOKIES & CRACKERS
11.2.5.4 BROWNIES
11.2.5.5 TART & PIES
11.2.5.6 OTHERS
11.2.6 DAIRY PRODUCTS
11.2.6.1 YOGURT
11.2.6.2 ICE CREAM
11.2.6.3 CHEESE
11.2.6.4 OTHERS
11.2.7 FROZEN DESSERTS
11.2.7.1 GELATO
11.2.7.2 CUSTARD
11.2.7.3 OTHERS
11.2.8 PROCESSED FOOD
11.2.8.1 READY MEALS
11.2.8.2 JAMS, PRESERVES & MARMALADES
11.2.8.3 SAUCES, DRESSINGS AND CONDIMENTS
11.2.8.4 SOUPS
11.2.8.5 OTHERS
11.2.9 CONVENIENCE FOOD
11.2.9.1 INSTANT NOODLES
11.2.9.2 PIZZA & PASTA
11.2.9.3 SNACKS & EXTRUDED SNACKS
11.2.9.4 OTHERS
11.2.10 BREAKFAST CEREAL
11.2.11 INFANT FORMULA
11.2.11.1 FIRST INFANT FORMULA
11.2.11.2 ANTI-REFLUX (STAY DOWN) FORMULA
11.2.11.3 COMFORT FORMULA
11.2.11.4 HYPOALLERGENIC FORMULA
11.2.11.5 FOLLOW-ON FORMULA
11.2.11.6 OTHERS
11.2.12 NUTRITIONAL BARS
11.2.13 FUNCTIONAL FOOD
11.3 PHARMACEUTICAL
11.4 DIETARY SUPPLEMENTS
11.4.1 IMMUNITY SUPPLEMENTS
11.4.2 OVERALL WELLBEING SUPPLEMENTS
11.4.3 SKIN HEALTH SUPPLEMENTS
11.4.4 BONE AND JOINT HEALTH SUPPLEMENTS
11.4.5 BRAIN HEALTH SUPPLEMENTS
11.4.6 OTHERS
11.5 OTHERS
12 NORTH AMERICA INDUSTRIAL SUGAR MARKET, BY DISTRIBUTION CHANNEL
12.1 OVERVIEW
12.2 DIRECT
12.3 INDIRECT
13 NORTH AMERICA INDUSTRIAL SUGAR MARKET, BY COUNTRY
13.1 NORTH AMERICA
13.1.1 U.S.
13.1.2 MEXICO
13.1.3 CANADA
14 NORTH AMERICA INDUSTRIAL SUGAR MARKET, COMPANY LANDSCAPE
14.1 COMPANY SHARE ANALYSIS: NORTH AMERICA
15 SWOT ANALYSIS
16 COMPANY PROFILES
16.1 SÜDZUCKER AG
16.1.1 COMPANY SNAPSHOT
16.1.2 REVENUE ANALYSIS
16.1.3 PRODUCT PORTFOLIO
16.1.4 RECENT DEVELOPMENT
16.2 AMALGAMATED SUGAR
16.2.1 COMPANY SNAPSHOT
16.2.2 PRODUCT PORTFOLIO
16.2.3 RECENT DEVELOPMENT
16.3 LANTIC INC.
16.3.1 COMPANY SNAPSHOT
16.3.2 REVENUE ANALYSIS
16.3.3 PRODUCT PORTFOLIO
16.3.4 RECENT DEVELOPMENT
16.4 ASSOCIATED BRITISH FOODS PLC
16.4.1 COMPANY SNAPSHOT
16.4.2 REVENUE ANALYSIS
16.4.3 PRODUCT PORTFOLIO
16.4.4 RECENT DEVELOPMENT
16.5 AMERICAN CRYSTAL SUGAR
16.5.1 COMPANY SNAPSHOT
16.5.2 PRODUCT PORTFOLIO
16.5.3 RECENT DEVELOPMENT
16.6 MICHIGAN SUGAR COMPANY
16.6.1 COMPANY SNAPSHOT
16.6.2 PRODUCT PORTFOLIO
16.6.3 RECENT DEVELOPMENT
17 QUESTIONNAIRE
18 RELATED REPORTS
Lista de Tablas
TABLE 1 NORTH AMERICA INDUSTRIAL SUGAR MARKET, BY TYPE, 2021-2030 (USD MILLION)
TABLE 2 NORTH AMERICA INDUSTRIAL SUGAR MARKET, BY TYPE, 2021-2030 (KILO TONS)
TABLE 3 NORTH AMERICA BROWN SUGAR IN INDUSTRIAL SUGAR MARKET, BY TYPE, 2021-2030 (USD MILLION)
TABLE 4 NORTH AMERICA INDUSTRIAL SUGAR MARKET, BY SOURCE, 2021-2030 (USD MILLION)
TABLE 5 NORTH AMERICA INDUSTRIAL SUGAR MARKET, BY SOURCE, 2021-2030 (KILO TONS)
TABLE 6 NORTH AMERICA INDUSTRIAL SUGAR MARKET, BY FORM, 2021-2030 (USD MILLION)
TABLE 7 NORTH AMERICA INDUSTRIAL SUGAR MARKET, BY FORM, 2021-2030 (KILO TONS)
TABLE 8 NORTH AMERICA INDUSTRIAL SUGAR MARKET, BY PACKAGING TYPE, 2021-2030 (USD MILLION)
TABLE 9 NORTH AMERICA INDUSTRIAL SUGAR MARKET, BY APPLICATION, 2021-2030 (USD MILLION)
TABLE 10 NORTH AMERICA FOOD & BEVERAGES IN INDUSTRIAL SUGAR MARKET, BY TYPE, 2021-2030 (USD MILLION)
TABLE 11 NORTH AMERICA BEVERAGES IN INDUSTRIAL SUGAR MARKET, BY TYPE, 2021-2030 (USD MILLION)
TABLE 12 NORTH AMERICA DAIRY BASED DRINKS IN INDUSTRIAL SUGAR MARKET, BY TYPE, 2021-2030 (USD MILLION)
TABLE 13 NORTH AMERICA CONFECTIONERY IN INDUSTRIAL SUGAR MARKET, BY TYPE, 2021-2030 (USD MILLION)
TABLE 14 NORTH AMERICA BAKERY IN INDUSTRIAL SUGAR MARKET, BY TYPE, 2021-2030 (USD MILLION)
TABLE 15 NORTH AMERICA DAIRY PRODUCTS IN INDUSTRIAL SUGAR MARKET, BY TYPE, 2021-2030 (USD MILLION)
TABLE 16 NORTH AMERICA FROZEN DESSERTS IN INDUSTRIAL SUGAR MARKET, BY TYPE, 2021-2030 (USD MILLION)
TABLE 17 NORTH AMERICA PROCESSED FOOD IN INDUSTRIAL SUGAR MARKET, BY TYPE, 2021-2030 (USD MILLION)
TABLE 18 NORTH AMERICA CONVENIENCE FOOD IN INDUSTRIAL SUGAR MARKET, BY TYPE, 2021-2030 (USD MILLION)
TABLE 19 NORTH AMERICA INFANT FORMULA IN INDUSTRIAL SUGAR MARKET, BY TYPE, 2021-2030 (USD MILLION)
TABLE 20 NORTH AMERICA DIETARY SUPPLEMENTS IN INDUSTRIAL SUGAR MARKET, BY TYPE, 2021-2030 (USD MILLION)
TABLE 21 NORTH AMERICA INDUSTRIAL SUGAR MARKET, BY DISTRIBUTION CHANNEL, 2021-2030 (USD MILLION)
TABLE 22 NORTH AMERICA INDUSTRIAL SUGAR MARKET, BY COUNTRY, 2021-2030 (USD MILLION)
TABLE 23 NORTH AMERICA INDUSTRIAL SUGAR MARKET, BY COUNTRY, 2021-2030 (KILO TONS)
TABLE 24 U.S. INDUSTRIAL SUGAR MARKET, BY TYPE, 2021-2030 (USD MILLION)
TABLE 25 U.S. INDUSTRIAL SUGAR MARKET, BY TYPE, 2021-2030 (KILO TONS)
TABLE 26 U.S. BROWN SUGAR IN INDUSTRIAL SUGAR MARKET, BY TYPE, 2021-2030 (USD MILLION)
TABLE 27 U.S. INDUSTRIAL SUGAR MARKET, BY SOURCE, 2021-2030 (USD MILLION)
TABLE 28 U.S. INDUSTRIAL SUGAR MARKET, BY SOURCE, 2021-2030 (KILO TONS)
TABLE 29 U.S. INDUSTRIAL SUGAR MARKET, BY FORM, 2021-2030 (USD MILLION)
TABLE 30 U.S. INDUSTRIAL SUGAR MARKET, BY FORM, 2021-2030 (KILO TONS)
TABLE 31 U.S. INDUSTRIAL SUGAR MARKET, BY PACKAGING TYPE, 2021-2030 (USD MILLION)
TABLE 32 U.S. INDUSTRIAL SUGAR MARKET, BY APPLICATION, 2021-2030 (USD MILLION)
TABLE 33 U.S. FOOD & BEVERAGES IN INDUSTRIAL SUGAR MARKET, BY TYPE, 2021-2030 (USD MILLION)
TABLE 34 U.S. BEVERAGES IN INDUSTRIAL SUGAR MARKET, BY TYPE, 2021-2030 (USD MILLION)
TABLE 35 U.S. DAIRY BASED DRINKS IN INDUSTRIAL SUGAR MARKET, BY TYPE, 2021-2030 (USD MILLION)
TABLE 36 U.S. CONFECTIONERY IN INDUSTRIAL SUGAR MARKET, BY TYPE, 2021-2030 (USD MILLION)
TABLE 37 U.S. BAKERY IN INDUSTRIAL SUGAR MARKET, BY TYPE, 2021-2030 (USD MILLION)
TABLE 38 U.S. DAIRY PRODUCTS IN INDUSTRIAL SUGAR MARKET, BY TYPE, 2021-2030 (USD MILLION)
TABLE 39 U.S. FROZEN DESSERTS IN INDUSTRIAL SUGAR MARKET, BY TYPE, 2021-2030 (USD MILLION)
TABLE 40 U.S. PROCESSED FOOD IN INDUSTRIAL SUGAR MARKET, BY TYPE, 2021-2030 (USD MILLION)
TABLE 41 U.S. CONVENIENCE FOOD IN INDUSTRIAL SUGAR MARKET, BY TYPE, 2021-2030 (USD MILLION)
TABLE 42 U.S. INFANT FORMULA IN INDUSTRIAL SUGAR MARKET, BY TYPE, 2021-2030 (USD MILLION)
TABLE 43 U.S. DIETARY SUPPLEMENTS IN INDUSTRIAL SUGAR MARKET, BY TYPE, 2021-2030 (USD MILLION)
TABLE 44 U.S. INDUSTRIAL SUGAR MARKET, BY DISTRIBUTION CHANNEL, 2021-2030 (USD MILLION)
TABLE 45 MEXICO INDUSTRIAL SUGAR MARKET, BY TYPE, 2021-2030 (USD MILLION)
TABLE 46 MEXICO INDUSTRIAL SUGAR MARKET, BY TYPE, 2021-2030 (KILO TONS)
TABLE 47 MEXICO BROWN SUGAR IN INDUSTRIAL SUGAR MARKET, BY TYPE, 2021-2030 (USD MILLION)
TABLE 48 MEXICO INDUSTRIAL SUGAR MARKET, BY SOURCE, 2021-2030 (USD MILLION)
TABLE 49 MEXICO INDUSTRIAL SUGAR MARKET, BY SOURCE, 2021-2030 (KILO TONS)
TABLE 50 MEXICO INDUSTRIAL SUGAR MARKET, BY FORM, 2021-2030 (USD MILLION)
TABLE 51 MEXICO INDUSTRIAL SUGAR MARKET, BY FORM, 2021-2030 (KILO TONS)
TABLE 52 MEXICO INDUSTRIAL SUGAR MARKET, BY PACKAGING TYPE, 2021-2030 (USD MILLION)
TABLE 53 MEXICO INDUSTRIAL SUGAR MARKET, BY APPLICATION, 2021-2030 (USD MILLION)
TABLE 54 MEXICO FOOD & BEVERAGES IN INDUSTRIAL SUGAR MARKET, BY TYPE, 2021-2030 (USD MILLION)
TABLE 55 MEXICO BEVERAGES IN INDUSTRIAL SUGAR MARKET, BY TYPE, 2021-2030 (USD MILLION)
TABLE 56 MEXICO DAIRY BASED DRINKS IN INDUSTRIAL SUGAR MARKET, BY TYPE, 2021-2030 (USD MILLION)
TABLE 57 MEXICO CONFECTIONERY IN INDUSTRIAL SUGAR MARKET, BY TYPE, 2021-2030 (USD MILLION)
TABLE 58 MEXICO BAKERY IN INDUSTRIAL SUGAR MARKET, BY TYPE, 2021-2030 (USD MILLION)
TABLE 59 MEXICO DAIRY PRODUCTS IN INDUSTRIAL SUGAR MARKET, BY TYPE, 2021-2030 (USD MILLION)
TABLE 60 MEXICO FROZEN DESSERTS IN INDUSTRIAL SUGAR MARKET, BY TYPE, 2021-2030 (USD MILLION)
TABLE 61 MEXICO PROCESSED FOOD IN INDUSTRIAL SUGAR MARKET, BY TYPE, 2021-2030 (USD MILLION)
TABLE 62 MEXICO CONVENIENCE FOOD IN INDUSTRIAL SUGAR MARKET, BY TYPE, 2021-2030 (USD MILLION)
TABLE 63 MEXICO INFANT FORMULA IN INDUSTRIAL SUGAR MARKET, BY TYPE, 2021-2030 (USD MILLION)
TABLE 64 MEXICO DIETARY SUPPLEMENTS IN INDUSTRIAL SUGAR MARKET, BY TYPE, 2021-2030 (USD MILLION)
TABLE 65 MEXICO INDUSTRIAL SUGAR MARKET, BY DISTRIBUTION CHANNEL, 2021-2030 (USD MILLION)
TABLE 66 CANADA INDUSTRIAL SUGAR MARKET, BY TYPE, 2021-2030 (USD MILLION)
TABLE 67 CANADA INDUSTRIAL SUGAR MARKET, BY TYPE, 2021-2030 (KILO TONS)
TABLE 68 CANADA BROWN SUGAR IN INDUSTRIAL SUGAR MARKET, BY TYPE, 2021-2030 (USD MILLION)
TABLE 69 CANADA INDUSTRIAL SUGAR MARKET, BY SOURCE, 2021-2030 (USD MILLION)
TABLE 70 CANADA INDUSTRIAL SUGAR MARKET, BY SOURCE, 2021-2030 (KILO TONS)
TABLE 71 CANADA INDUSTRIAL SUGAR MARKET, BY FORM, 2021-2030 (USD MILLION)
TABLE 72 CANADA INDUSTRIAL SUGAR MARKET, BY FORM, 2021-2030 (KILO TONS)
TABLE 73 CANADA INDUSTRIAL SUGAR MARKET, BY PACKAGING TYPE, 2021-2030 (USD MILLION)
TABLE 74 CANADA INDUSTRIAL SUGAR MARKET, BY APPLICATION, 2021-2030 (USD MILLION)
TABLE 75 CANADA FOOD & BEVERAGES IN INDUSTRIAL SUGAR MARKET, BY TYPE, 2021-2030 (USD MILLION)
TABLE 76 CANADA BEVERAGES IN INDUSTRIAL SUGAR MARKET, BY TYPE, 2021-2030 (USD MILLION)
TABLE 77 CANADA DAIRY BASED DRINKS IN INDUSTRIAL SUGAR MARKET, BY TYPE, 2021-2030 (USD MILLION)
TABLE 78 CANADA CONFECTIONERY IN INDUSTRIAL SUGAR MARKET, BY TYPE, 2021-2030 (USD MILLION)
TABLE 79 CANADA BAKERY IN INDUSTRIAL SUGAR MARKET, BY TYPE, 2021-2030 (USD MILLION)
TABLE 80 CANADA DAIRY PRODUCTS IN INDUSTRIAL SUGAR MARKET, BY TYPE, 2021-2030 (USD MILLION)
TABLE 81 CANADA FROZEN DESSERTS IN INDUSTRIAL SUGAR MARKET, BY TYPE, 2021-2030 (USD MILLION)
TABLE 82 CANADA PROCESSED FOOD IN INDUSTRIAL SUGAR MARKET, BY TYPE, 2021-2030 (USD MILLION)
TABLE 83 CANADA CONVENIENCE FOOD IN INDUSTRIAL SUGAR MARKET, BY TYPE, 2021-2030 (USD MILLION)
TABLE 84 CANADA INFANT FORMULA IN INDUSTRIAL SUGAR MARKET, BY TYPE, 2021-2030 (USD MILLION)
TABLE 85 CANADA DIETARY SUPPLEMENTS IN INDUSTRIAL SUGAR MARKET, BY TYPE, 2021-2030 (USD MILLION)
TABLE 86 CANADA INDUSTRIAL SUGAR MARKET, BY DISTRIBUTION CHANNEL, 2021-2030 (USD MILLION)
Lista de figuras
FIGURE 1 NORTH AMERICA INDUSTRIAL SUGAR MARKET: SEGMENTATION
FIGURE 2 NORTH AMERICA INDUSTRIAL SUGAR MARKET: DATA TRIANGULATION
FIGURE 3 NORTH AMERICA INDUSTRIAL SUGAR MARKET: DROC ANALYSIS
FIGURE 4 NORTH AMERICA INDUSTRIAL SUGAR MARKET: REGIONAL VS COUNTRY MARKET ANALYSIS
FIGURE 5 NORTH AMERICA INDUSTRIAL SUGAR MARKET: COMPANY RESEARCH ANALYSIS
FIGURE 6 NORTH AMERICA INDUSTRIAL SUGAR MARKET: INTERVIEW DEMOGRAPHICS
FIGURE 7 NORTH AMERICA INDUSTRIAL SUGAR MARKET: DBMR MARKET POSITION GRID
FIGURE 8 NORTH AMERICA INDUSTRIAL SUGAR MARKET: MARKET APPLICATION COVERAGE GRID
FIGURE 9 NORTH AMERICA INDUSTRIAL SUGAR MARKET: SEGMENTATION
FIGURE 10 INCREASING FOOD AND BEVERAGES CONSUMPTION IS DRIVING THE GROWTH OF THE NORTH AMERICA INDUSTRIAL SUGAR MARKET IN THE FORECAST PERIOD OF 2023 TO 2030
FIGURE 11 THE WHITE SUGAR SEGMENT IS EXPECTED TO ACCOUNT FOR THE LARGEST SHARE OF THE NORTH AMERICA INDUSTRIAL SUGAR MARKET IN 2023 & 2030
FIGURE 12 SUPPLY CHAIN OF INDUSTRIAL SUGAR
FIGURE 13 DRIVERS, RESTRAINTS, OPPORTUNITIES, AND CHALLENGES OF THE NORTH AMERICA INDUSTRIAL SUGAR MARKET
FIGURE 14 NORTH AMERICA INDUSTRIAL SUGAR MARKET: BY TYPE, 2022
FIGURE 15 NORTH AMERICA INDUSTRIAL SUGAR MARKET: BY SOURCE, 2022
FIGURE 16 NORTH AMERICA INDUSTRIAL SUGAR MARKET: BY FORM, 2022
FIGURE 17 NORTH AMERICA INDUSTRIAL SUGAR MARKET: BY PACKAGING TYPE, 2022
FIGURE 18 NORTH AMERICA INDUSTRIAL SUGAR MARKET: BY APPLICATION, 2022
FIGURE 19 NORTH AMERICA INDUSTRIAL SUGAR MARKET: BY DISTRIBUTION CHANNEL, 2022
FIGURE 20 NORTH AMERICA INDUSTRIAL SUGAR MARKET: SNAPSHOT (2022)
FIGURE 21 NORTH AMERICA INDUSTRIAL SUGAR MARKET: BY COUNTRY (2022)
FIGURE 22 NORTH AMERICA INDUSTRIAL SUGAR MARKET: BY COUNTRY (2023 & 2030)
FIGURE 23 NORTH AMERICA INDUSTRIAL SUGAR MARKET: BY COUNTRY (2022 & 2030)
FIGURE 24 NORTH AMERICA INDUSTRIAL SUGAR MARKET: BY TYPE (2023 - 2030)
FIGURE 25 NORTH AMERICA INDUSTRIAL SUGAR MARKET: COMPANY SHARE 2022 (%)

Metodología de investigación
La recopilación de datos y el análisis del año base se realizan utilizando módulos de recopilación de datos con muestras de gran tamaño. La etapa incluye la obtención de información de mercado o datos relacionados a través de varias fuentes y estrategias. Incluye el examen y la planificación de todos los datos adquiridos del pasado con antelación. Asimismo, abarca el examen de las inconsistencias de información observadas en diferentes fuentes de información. Los datos de mercado se analizan y estiman utilizando modelos estadísticos y coherentes de mercado. Además, el análisis de la participación de mercado y el análisis de tendencias clave son los principales factores de éxito en el informe de mercado. Para obtener más información, solicite una llamada de un analista o envíe su consulta.
La metodología de investigación clave utilizada por el equipo de investigación de DBMR es la triangulación de datos, que implica la extracción de datos, el análisis del impacto de las variables de datos en el mercado y la validación primaria (experto en la industria). Los modelos de datos incluyen cuadrícula de posicionamiento de proveedores, análisis de línea de tiempo de mercado, descripción general y guía del mercado, cuadrícula de posicionamiento de la empresa, análisis de patentes, análisis de precios, análisis de participación de mercado de la empresa, estándares de medición, análisis global versus regional y de participación de proveedores. Para obtener más información sobre la metodología de investigación, envíe una consulta para hablar con nuestros expertos de la industria.
Personalización disponible
Data Bridge Market Research es líder en investigación formativa avanzada. Nos enorgullecemos de brindar servicios a nuestros clientes existentes y nuevos con datos y análisis que coinciden y se adaptan a sus objetivos. El informe se puede personalizar para incluir análisis de tendencias de precios de marcas objetivo, comprensión del mercado de países adicionales (solicite la lista de países), datos de resultados de ensayos clínicos, revisión de literatura, análisis de mercado renovado y base de productos. El análisis de mercado de competidores objetivo se puede analizar desde análisis basados en tecnología hasta estrategias de cartera de mercado. Podemos agregar tantos competidores sobre los que necesite datos en el formato y estilo de datos que esté buscando. Nuestro equipo de analistas también puede proporcionarle datos en archivos de Excel sin procesar, tablas dinámicas (libro de datos) o puede ayudarlo a crear presentaciones a partir de los conjuntos de datos disponibles en el informe.


