

Middle East And Africa Bioactive Ingredient Market
Tamaño del mercado en miles de millones de dólares
Tasa de crecimiento anual compuesta (CAGR) :
% 
 USD
3.55 Billion
USD
6.01 Billion
2025
2033
USD
3.55 Billion
USD
6.01 Billion
2025
2033
| 2026 –2033 | |
| USD 3.55 Billion | |
| USD 6.01 Billion | |
| % | |
|
Segmentación del mercado de ingredientes bioactivos en Oriente Medio y África, por tipo de ingrediente (prebióticos, probióticos, aminoácidos, péptidos, omega 3 y lípidos estructurados, fitoquímicos y extractos vegetales, minerales, vitaminas, fibras y carbohidratos especiales, carotenoides y antioxidantes, entre otros), aplicación (alimentos funcionales, suplementos dietéticos, suplementos gomosos, nutrición animal, cuidado personal, entre otros) y origen (vegetal, animal y microbiano): tendencias y pronóstico de la industria hasta 2033.
Tamaño del mercado de ingredientes bioactivos en Oriente Medio y África
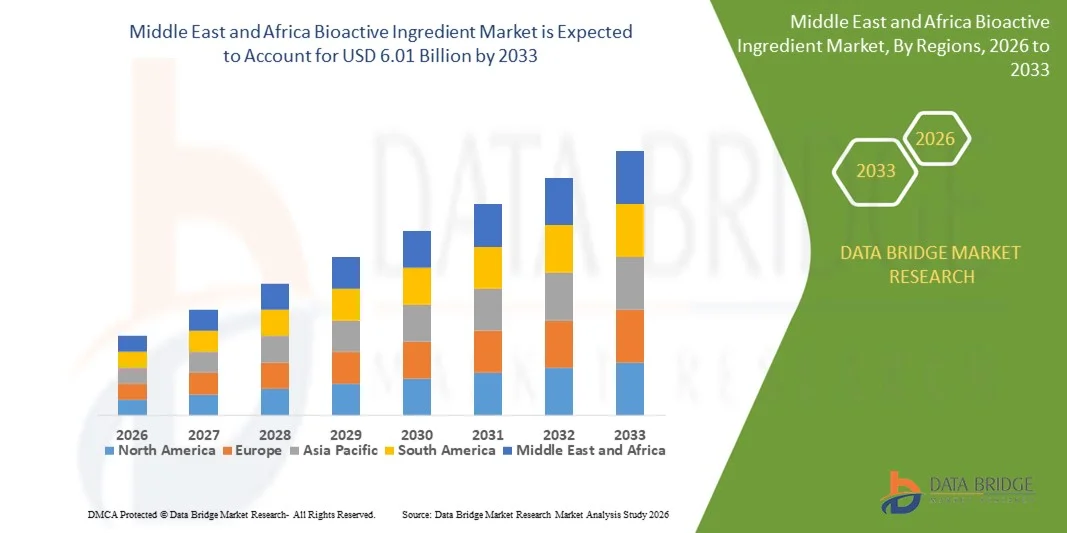
- El tamaño del mercado de ingredientes bioactivos de Medio Oriente y África se valoró en USD 3,55 mil millones en 2025 y se espera que alcance los USD 6,01 mil millones para 2033 , con una CAGR del 6,80% durante el período de pronóstico.
- El crecimiento del mercado se debe en gran medida a la creciente conciencia de los consumidores sobre la atención médica preventiva, la nutrición funcional y el papel de los compuestos bioactivos en el manejo de los trastornos relacionados con el estilo de vida.
- La creciente incorporación de ingredientes bioactivos en alimentos funcionales, suplementos dietéticos, nutracéuticos y formulaciones de cuidado personal está respaldando aún más la expansión sostenida del mercado.
Análisis del mercado de ingredientes bioactivos en Oriente Medio y África
- El mercado está experimentando un fuerte impulso debido a la innovación continua en tecnologías de extracción, formulación y administración que mejoran la biodisponibilidad, la estabilidad y la eficacia de los compuestos bioactivos.
- Además, la creciente preferencia por ingredientes naturales, de origen vegetal y de etiqueta limpia, junto con la expansión de las aplicaciones en las industrias de alimentos, bebidas, farmacéutica y cosmética, está fortaleciendo el atractivo general del mercado.
- El mercado sudafricano de ingredientes bioactivos dominó en 2025, impulsado por la creciente concienciación sobre la atención médica preventiva y la mejora del nivel de vida. El crecimiento de la clase media impulsa la demanda de alimentos y suplementos funcionales.
- Se espera que los Emiratos Árabes Unidos sean testigos de la mayor tasa de crecimiento anual compuesta (CAGR) en el mercado de ingredientes bioactivos de Medio Oriente y África debido a la creciente conciencia de la salud, los altos ingresos disponibles, la creciente demanda de productos de nutrición y bienestar de primera calidad y las iniciativas gubernamentales que apoyan los sectores de alimentos funcionales y nutracéuticos.
- El segmento de vitaminas obtuvo la mayor participación en los ingresos del mercado en 2025, impulsado por su uso generalizado en alimentos funcionales, suplementos dietéticos y bebidas fortificadas, junto con la creciente atención de los consumidores a la inmunidad, la energía y el bienestar general. Las vitaminas se incorporan ampliamente debido a sus reconocidos beneficios para la salud, su facilidad de formulación y su sólida concienciación entre los consumidores de todos los grupos de edad.
Alcance del informe y segmentación del mercado de ingredientes bioactivos en Oriente Medio y África
|
Atributos |
Información clave sobre el mercado de ingredientes bioactivos en Oriente Medio y África |
|
Segmentos cubiertos |
|
|
Países cubiertos |
Oriente Medio y África
|
|
Actores clave del mercado |
|
|
Oportunidades de mercado |
|
|
Conjuntos de información de datos de valor añadido |
Además de los conocimientos sobre escenarios de mercado como valor de mercado, tasa de crecimiento, segmentación, cobertura geográfica y actores principales, los informes de mercado seleccionados por Data Bridge Market Research también incluyen análisis de expertos en profundidad, análisis de precios, análisis de participación de marca, encuesta de consumidores, análisis demográfico, análisis de la cadena de suministro, análisis de la cadena de valor, descripción general de materias primas/consumibles, criterios de selección de proveedores, análisis PESTLE, análisis de Porter y marco regulatorio. |
Tendencias del mercado de ingredientes bioactivos en Oriente Medio y África
Creciente demanda de atención médica preventiva y nutrición funcional
- El creciente enfoque en el mantenimiento de la salud y la prevención de enfermedades está transformando significativamente el mercado de ingredientes bioactivos, ya que los consumidores buscan cada vez más ingredientes que ofrezcan beneficios fisiológicos más allá de la nutrición básica. Los ingredientes bioactivos están cobrando gran importancia debido a su comprobada función en el apoyo inmunitario, la salud digestiva, el bienestar cardiovascular y el rendimiento cognitivo. Esta tendencia está fortaleciendo su adopción en alimentos funcionales, suplementos dietéticos, nutracéuticos y productos de cuidado personal, lo que anima a los fabricantes a desarrollar fórmulas innovadoras que se ajusten a los patrones de consumo orientados a la salud.
- La creciente conciencia sobre los trastornos relacionados con el estilo de vida, el envejecimiento de la población y el bienestar a largo plazo ha acelerado la demanda de ingredientes bioactivos en alimentos funcionales, bebidas fortificadas, suplementos y productos de nutrición deportiva. Los consumidores preocupados por su salud buscan activamente productos enriquecidos con antioxidantes, probióticos, ácidos grasos omega, polifenoles y extractos de plantas, lo que impulsa a las marcas a priorizar la validación científica, el posicionamiento de etiqueta limpia y la eficacia funcional en el desarrollo de productos.
- Las tendencias de salud y bienestar preventivos influyen en las decisiones de compra, y los fabricantes destacan los beneficios clínicamente comprobados, el origen natural y la mejora de la biodisponibilidad. El etiquetado transparente, las afirmaciones sobre la salud respaldadas por la investigación y las credenciales de sostenibilidad ayudan a las marcas a diferenciar sus productos y a generar confianza en los consumidores, a la vez que impulsan la inversión en I+D y sistemas de administración avanzados.
- Por ejemplo, en 2024, las principales marcas de nutrición y bienestar ampliaron sus portafolios con la introducción de alimentos funcionales y suplementos enriquecidos con compuestos bioactivos como probióticos, ácidos grasos omega-3 y antioxidantes vegetales. Estos lanzamientos se vieron impulsados por la creciente demanda de productos que refuerzan el sistema inmunitario, la salud intestinal y aportan energía, con una fuerte aceptación en los canales de distribución minorista, e-commerce y de salud.
- Si bien la demanda de ingredientes bioactivos sigue en aumento, el crecimiento sostenido del mercado depende de la investigación continua, el cumplimiento normativo y la garantía de una eficacia uniforme en todas las formulaciones. Los fabricantes se centran en mejorar la biodisponibilidad, la estabilidad y la escalabilidad, a la vez que equilibran el coste, la calidad y la base científica para impulsar una adopción más amplia.
Dinámica del mercado de ingredientes bioactivos en Oriente Medio y África
Conductor
Enfoque creciente en la atención médica preventiva y el consumo de alimentos funcionales
- El creciente interés de los consumidores por la atención médica preventiva es un factor clave para el mercado de ingredientes bioactivos. Los consumidores recurren cada vez más a alimentos funcionales, suplementos y nutracéuticos enriquecidos con compuestos bioactivos para promover la salud a largo plazo, controlar enfermedades crónicas y mejorar el bienestar general. Este cambio anima a los fabricantes a sustituir los ingredientes convencionales por bioactivos funcionales con respaldo científico.
- La expansión de las aplicaciones en alimentos funcionales, bebidas, suplementos dietéticos, productos farmacéuticos y productos de cuidado personal está contribuyendo al crecimiento del mercado. Los ingredientes bioactivos ayudan a mejorar el valor nutricional, el rendimiento funcional y el posicionamiento en salud, lo que permite a los fabricantes satisfacer las cambiantes expectativas de los consumidores en productos orientados al bienestar.
- Los fabricantes de alimentos, suplementos y productos de cuidado personal promueven activamente las formulaciones basadas en ingredientes bioactivos mediante la innovación de productos, la investigación clínica y campañas de marketing centradas en la salud. Estos esfuerzos se ven respaldados por la creciente preferencia de los consumidores por ingredientes naturales, con respaldo científico y multifuncionales, lo que fomenta las colaboraciones entre proveedores de ingredientes, instituciones de investigación y marcas.
- Por ejemplo, en 2023, importantes empresas mundiales de nutrición y suplementos informaron una mayor incorporación de probióticos, extractos de plantas y ácidos grasos omega en formulaciones de alimentos y suplementos funcionales. Esta expansión se produjo tras una mayor demanda de soluciones para el sistema inmunitario, la salud digestiva y el apoyo cognitivo, lo que impulsó la diferenciación de productos y la repetición de compras.
- Aunque las tendencias de salud preventiva apoyan firmemente el crecimiento del mercado, el éxito a largo plazo depende de la alineación regulatoria, la calidad constante de los ingredientes y la inversión continua en investigación y tecnologías de formulación para satisfacer la demanda global y mantener el posicionamiento competitivo.
Restricción/Desafío
Altos costos de desarrollo y complejidad regulatoria
- El costo relativamente alto asociado con el desarrollo y la comercialización de ingredientes bioactivos sigue siendo un desafío clave, en particular debido a la extensa investigación, la validación clínica y los requisitos de procesamiento avanzado. Los procesos de extracción, purificación y estabilización suelen incrementar los costos de producción, lo que limita su adopción entre los fabricantes sensibles a los precios.
- La complejidad regulatoria y la variedad de requisitos de aprobación para las declaraciones de propiedades saludables y los ingredientes funcionales plantean desafíos adicionales. Los fabricantes deben cumplir con estrictas normas de seguridad, eficacia y etiquetado, lo que puede retrasar el lanzamiento de productos y aumentar los costos de cumplimiento. La escasa claridad regulatoria en torno a ciertos compuestos bioactivos novedosos restringe aún más la entrada al mercado.
- Los desafíos de la cadena de suministro y la formulación también impactan el crecimiento del mercado, ya que algunos ingredientes bioactivos son sensibles al calor, la luz y la oxidación. Garantizar la estabilidad, la biodisponibilidad y un rendimiento consistente en diferentes formatos de producto aumenta la complejidad de la formulación y los costos operativos.
- Por ejemplo, los fabricantes que introdujeron nuevos alimentos y suplementos funcionales bioactivos en 2024 informaron retrasos debido a la ampliación de los plazos de aprobación y a la necesidad de documentación clínica adicional para respaldar las afirmaciones sobre la salud. Estos factores aumentaron el tiempo de comercialización y limitaron los ciclos de innovación.
- Para abordar estos desafíos se requerirán marcos regulatorios optimizados, tecnologías de extracción rentables e inversión continua en investigación científica. La colaboración entre productores de ingredientes, organismos reguladores y fabricantes de productos será esencial para generar oportunidades de crecimiento a largo plazo y garantizar la expansión sostenible del mercado global de ingredientes bioactivos.
Alcance del mercado de ingredientes bioactivos en Oriente Medio y África
El mercado está segmentado según el tipo de ingrediente, la aplicación y la fuente.
- Por tipo de ingrediente
Según el tipo de ingrediente, el mercado de ingredientes bioactivos de Oriente Medio y África se segmenta en prebióticos, probióticos, aminoácidos, péptidos, omega 3 y lípidos estructurados, fitoquímicos y extractos de plantas, minerales, vitaminas, fibras y carbohidratos especiales, carotenoides y antioxidantes, entre otros. El segmento de vitaminas registró la mayor cuota de mercado en 2025, impulsado por su uso generalizado en alimentos funcionales, suplementos dietéticos y bebidas fortificadas, junto con la creciente atención de los consumidores a la inmunidad, la energía y el bienestar general. Las vitaminas se incorporan ampliamente debido a sus reconocidos beneficios para la salud, su fácil formulación y su gran conocimiento por parte de los consumidores en todos los grupos de edad.
Se prevé que el segmento de probióticos experimente su mayor crecimiento entre 2026 y 2033, impulsado por una mayor concienciación sobre la salud intestinal, el bienestar digestivo y el apoyo inmunitario. El creciente consumo de alimentos fermentados, bebidas funcionales y suplementos probióticos está impulsando una rápida adopción, y los fabricantes invierten en la innovación de cepas y en una mayor estabilidad para una aplicación más amplia.
- Por aplicación
Según su aplicación, el mercado de ingredientes bioactivos en Oriente Medio y África se segmenta en alimentos funcionales, suplementos dietéticos, suplementos gomosos, nutrición animal, cuidado personal y otros. El segmento de suplementos dietéticos representó la mayor cuota de mercado en 2025, impulsado por la creciente concienciación sobre la salud, las tendencias en atención médica preventiva y la creciente demanda de formatos nutricionales convenientes. Los ingredientes bioactivos se utilizan ampliamente en cápsulas, comprimidos y polvos para abordar problemas de salud relacionados con la inmunidad, la energía y el estilo de vida.
Se prevé que el segmento de alimentos funcionales registre su mayor tasa de crecimiento entre 2026 y 2033, impulsado por el aumento del consumo de alimentos y bebidas fortificados que ofrecen beneficios adicionales para la salud. Los fabricantes se están centrando en incorporar ingredientes bioactivos en sus productos alimenticios cotidianos para adaptarse a las cambiantes preferencias de los consumidores por dietas ricas en nutrición y orientadas al bienestar.
- Por fuente
Según su origen, el mercado de ingredientes bioactivos de Oriente Medio y África se segmenta en vegetales, animales y microbianos. El segmento de origen vegetal dominó el mercado en 2025, impulsado por la fuerte preferencia de los consumidores por ingredientes naturales, de etiqueta limpia y de origen sostenible. Los bioactivos de origen vegetal, como los polifenoles, las fibras y los extractos vegetales, se utilizan ampliamente en aplicaciones de alimentación, suplementos y cuidado personal debido a su seguridad percibida y sus beneficios funcionales.
Se prevé que el segmento microbiano registre su mayor tasa de crecimiento entre 2026 y 2033, impulsado por el creciente uso de probióticos, enzimas e ingredientes derivados de la fermentación. Los avances en biotecnología y procesos de fermentación permiten una producción escalable y una calidad constante, lo que hace que las fuentes microbianas sean cada vez más atractivas para los fabricantes de ingredientes bioactivos.
Análisis regional del mercado de ingredientes bioactivos en Oriente Medio y África
- El mercado sudafricano de ingredientes bioactivos dominó en 2025, impulsado por la creciente concienciación sobre la atención médica preventiva y la mejora del nivel de vida. El crecimiento de la clase media impulsa la demanda de alimentos y suplementos funcionales.
- La urbanización y los cambios en los patrones alimentarios están influyendo en el consumo de ingredientes bioactivos.
- La expansión de las modernas redes minoristas y farmacéuticas está ampliando el alcance del mercado. El creciente interés en los productos para la inmunidad y el bienestar sustenta la demanda.
Perspectiva del mercado de ingredientes bioactivos de los EAU
Se prevé que el mercado de ingredientes bioactivos de los EAU experimente su mayor crecimiento entre 2026 y 2033, impulsado por los altos ingresos disponibles y una sólida concienciación sobre la salud. Los consumidores adoptan cada vez más productos premium de nutrición y bienestar. La demanda de alimentos funcionales, suplementos y bebidas fortificadas está en aumento. El enfoque gubernamental en las iniciativas de salud y bienestar impulsa el desarrollo del mercado. La creciente inversión en innovación nutracéutica está acelerando su adopción.
Cuota de mercado de ingredientes bioactivos en Oriente Medio y África
La industria de ingredientes bioactivos de Medio Oriente y África está liderada principalmente por empresas bien establecidas, entre las que se incluyen:
• Saudi Basic Industries Corporation (Arabia Saudita)
• Savola Group (Arabia Saudita)
• Almarai Company (Arabia Saudita)
• National Food Products Company (EAU)
• IFFCO Group (EAU)
• Al Ain Farms (EAU)
• Aspen Pharmacare Holdings Limited (Sudáfrica)
• Adcock Ingram Holdings Limited (Sudáfrica)
• RCL Foods Limited (Sudáfrica)
• Tiger Brands Limited (Sudáfrica)
• Clover Industries Limited (Sudáfrica)
• Zamil Industrial Investment Co. (Arabia Saudita)
• Julphar Gulf Pharmaceutical Industries (EAU)
• Nutrivita Food Industries (Egipto)
• Pharco Pharmaceuticals (Egipto)
SKU-
Obtenga acceso en línea al informe sobre la primera nube de inteligencia de mercado del mundo

- Panel de análisis de datos interactivo
- Panel de análisis de empresas para oportunidades con alto potencial de crecimiento
- Acceso de analista de investigación para personalización y consultas
- Análisis de la competencia con panel interactivo
- Últimas noticias, actualizaciones y análisis de tendencias
- Aproveche el poder del análisis de referencia para un seguimiento integral de la competencia
Metodología de investigación
La recopilación de datos y el análisis del año base se realizan utilizando módulos de recopilación de datos con muestras de gran tamaño. La etapa incluye la obtención de información de mercado o datos relacionados a través de varias fuentes y estrategias. Incluye el examen y la planificación de todos los datos adquiridos del pasado con antelación. Asimismo, abarca el examen de las inconsistencias de información observadas en diferentes fuentes de información. Los datos de mercado se analizan y estiman utilizando modelos estadísticos y coherentes de mercado. Además, el análisis de la participación de mercado y el análisis de tendencias clave son los principales factores de éxito en el informe de mercado. Para obtener más información, solicite una llamada de un analista o envíe su consulta.
La metodología de investigación clave utilizada por el equipo de investigación de DBMR es la triangulación de datos, que implica la extracción de datos, el análisis del impacto de las variables de datos en el mercado y la validación primaria (experto en la industria). Los modelos de datos incluyen cuadrícula de posicionamiento de proveedores, análisis de línea de tiempo de mercado, descripción general y guía del mercado, cuadrícula de posicionamiento de la empresa, análisis de patentes, análisis de precios, análisis de participación de mercado de la empresa, estándares de medición, análisis global versus regional y de participación de proveedores. Para obtener más información sobre la metodología de investigación, envíe una consulta para hablar con nuestros expertos de la industria.
Personalización disponible
Data Bridge Market Research es líder en investigación formativa avanzada. Nos enorgullecemos de brindar servicios a nuestros clientes existentes y nuevos con datos y análisis que coinciden y se adaptan a sus objetivos. El informe se puede personalizar para incluir análisis de tendencias de precios de marcas objetivo, comprensión del mercado de países adicionales (solicite la lista de países), datos de resultados de ensayos clínicos, revisión de literatura, análisis de mercado renovado y base de productos. El análisis de mercado de competidores objetivo se puede analizar desde análisis basados en tecnología hasta estrategias de cartera de mercado. Podemos agregar tantos competidores sobre los que necesite datos en el formato y estilo de datos que esté buscando. Nuestro equipo de analistas también puede proporcionarle datos en archivos de Excel sin procesar, tablas dinámicas (libro de datos) o puede ayudarlo a crear presentaciones a partir de los conjuntos de datos disponibles en el informe.

