
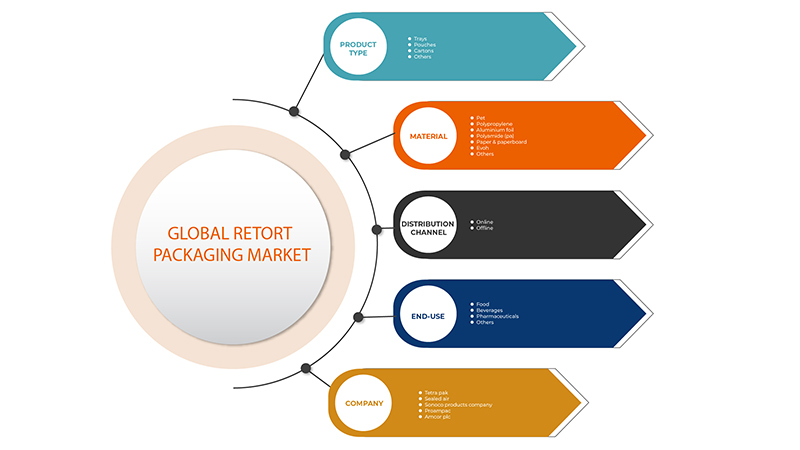
Mercado mundial de envases de retorta, por tipo de producto (bolsas, bandejas, cartones y otros), material (PET, polipropileno, papel de aluminio, poliamida (PA), papel y cartón, EVOH y otros), canal de distribución (fuera de línea y en línea), uso final (alimentos, bebidas, productos farmacéuticos y otros): tendencias de la industria y pronóstico hasta 2029.
Análisis y tamaño del mercado
La industrialización y la urbanización han cambiado las técnicas de procesamiento y las formas de transporte de medios o fluidos, lo que ha llevado a la necesidad de envases de plástico en casi todas las industrias donde los fluidos juegan un papel importante. Por lo tanto, el mercado de envases de plástico se ha visto impulsado por la necesidad de una producción más segura y una infraestructura adecuada .
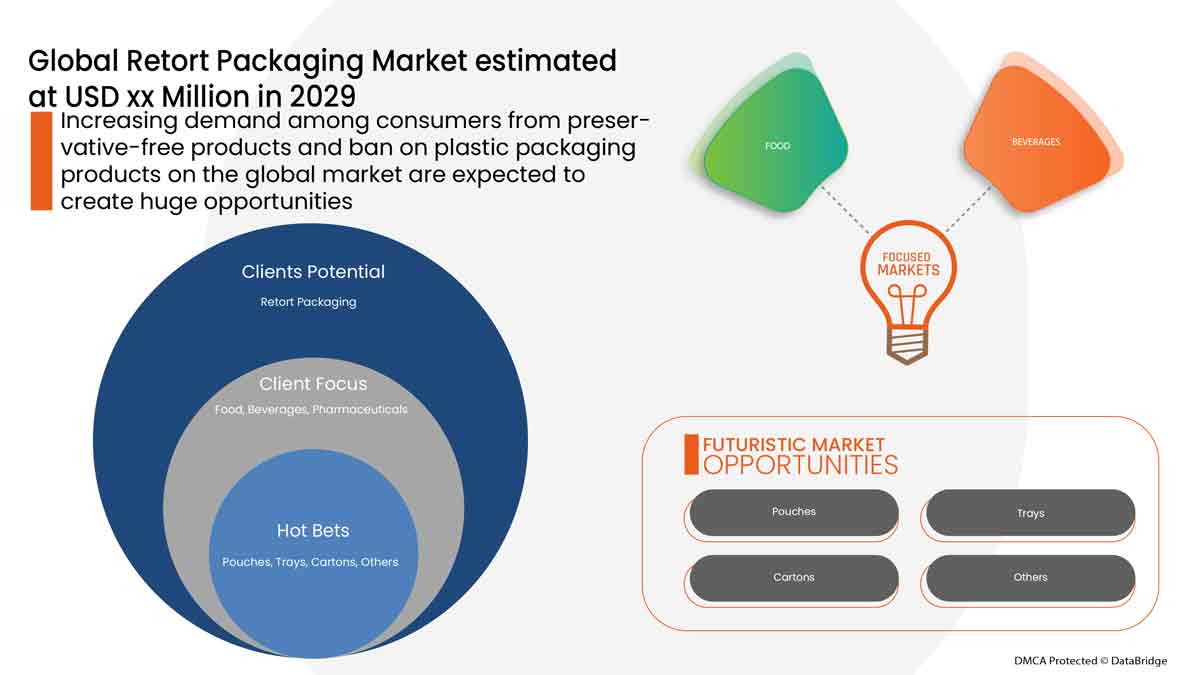

Algunos de los factores que impulsan el mercado son la creciente demanda de productos sin conservantes por parte de los consumidores, la creciente demanda de soluciones de envasado sostenibles y estéticas y la creciente demanda de envases inteligentes para evitar el desperdicio de alimentos. Sin embargo, el alto coste asociado a las actividades de investigación y desarrollo es el freno que frena el crecimiento del mercado.
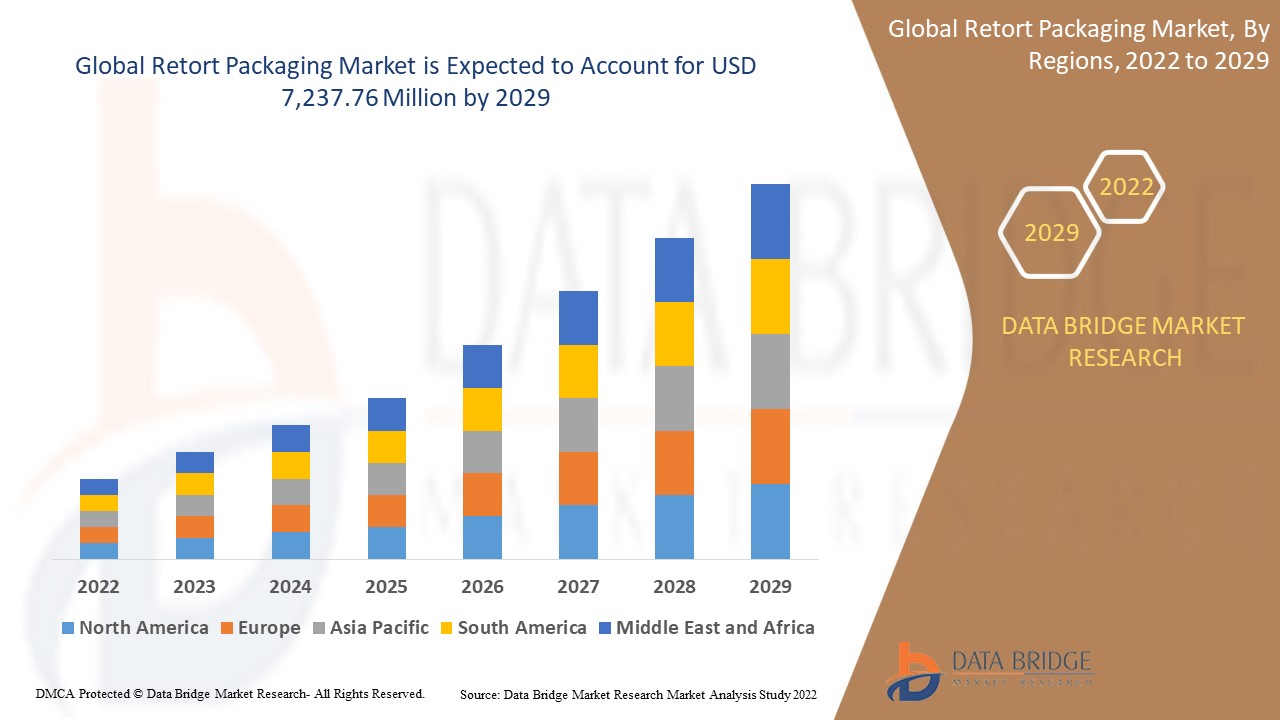
Data Bridge Market Research analiza que se espera que el mercado de envases de retorta alcance un valor de USD 7237,76 millones para 2029, con una CAGR del 5,9 % durante el período de pronóstico. Las "bolsas" representan el segmento de tipo de producto más grande en el mercado de envases de retorta debido a los rápidos avances en las vías tecnológicas para comercializar el uso de envases alternativos. El informe del mercado de envases de retorta también cubre en profundidad el análisis de precios, el análisis de patentes y los avances tecnológicos.
|
Métrica del informe |
Detalles |
|
Período de pronóstico |
2022 a 2029 |
|
Año base |
2021 |
|
Años históricos |
2020 |
|
Unidades cuantitativas |
Ingresos en millones de USD, volúmenes en unidades, precios en USD |
|
Segmentos cubiertos |
Por tipo de producto (bolsas, bandejas, cartones y otros), por material (PET, polipropileno, papel de aluminio, poliamida (PA), papel y cartón, EVOH y otros), por canal de distribución (offline y online), por uso final (alimentos, bebidas, productos farmacéuticos y otros) |
|
Países cubiertos |
EE. UU., Canadá y México en América del Norte, Reino Unido, Alemania, Francia, España, Italia, Países Bajos, Suiza, Rusia, Bélgica, Turquía, Luxemburgo y el resto de Europa, China, Corea del Sur, Japón, India, Australia, Singapur, Malasia, Indonesia, Tailandia, Filipinas y el resto de Asia-Pacífico en Asia-Pacífico (APAC), Sudáfrica, Arabia Saudita, Emiratos Árabes Unidos, Israel, Egipto y el resto de Medio Oriente y África (MEA) como parte de Medio Oriente y África (MEA), Brasil, Argentina y el resto de América del Sur como parte de América del Sur. |
|
Actores del mercado cubiertos |
Entre otras, se encuentran: ProAmpac, Coveris, Berry Global Inc., FLAIR Flexible Packaging Corporation, IMPAK CORPORATION, PORTCO PACKAGING, Constantia Flexibles, Mondi, Tetra Pak, Clifton Packaging Group Limited, DNP America, LLC., Sonoco Products Company, Amcor plc, Sealed Air, WINPAK LTD., Huhtamaki, LD PACKAGING CO.,LTD, Paharpur 3P, Printpack y Floeter India Retort Pouches (P) Ltd. |
Definición de mercado
El envase de retorta es un tipo de envase para alimentos hecho de un laminado de plástico flexible y láminas de metal. Permite el envasado estéril de una amplia variedad de alimentos y bebidas manipulados mediante procesamiento aséptico y se utiliza como una alternativa a los métodos tradicionales de enlatado industrial. Los alimentos envasados varían desde agua hasta comidas completamente cocidas, termoestabilizadas (tratadas térmicamente) y de alto contenido calórico (1300 kcal en promedio), como las comidas listas para comer (MRE), que se pueden comer frías, calentar sumergiéndolas en agua caliente o calentarlas con un calentador de raciones sin llama, un componente de las comidas introducido por primera vez por los militares en 1992. Las raciones de campaña, la comida espacial, los productos de pescado, las comidas para acampar, los fideos rápidos y empresas como Capri Sun y Tasty Bite utilizan envases de retorta.
Inicialmente, los envases de retorta se desarrollaron para aplicaciones industriales y órganos de tubos. Poco a poco, el diseño se adaptó a la industria biofarmacéutica para métodos de esterilización mediante el uso de materiales compatibles. Y ahora se está utilizando en casi todas las industrias para una producción segura y una infraestructura adecuada, como alimentos y bebidas y procesamiento químico, entre otros sectores verticales.
Dinámica del mercado de envases retortables
En esta sección se aborda la comprensión de los factores impulsores del mercado, las ventajas, las oportunidades, las limitaciones y los desafíos. Todo esto se analiza en detalle a continuación:
- Creciente demanda entre los consumidores de productos sin conservantes
El retortado se produce cuando los productos no estériles se sellan herméticamente, lo que literalmente significa que el envase no es estéril. El envase se carga en un recipiente a presión de retorta y se somete a vapor presurizado. Además, el producto se expone a altas temperaturas durante un período mucho más largo que en el llenado en caliente. El tiempo adicional puede deteriorar significativamente la calidad general y el contenido nutricional del producto.
La creciente demanda de productos sin conservantes por parte de los consumidores de todo el mundo es un factor clave para el mercado mundial de envases termosellables. A medida que los consumidores se preocupan cada vez más por los efectos nocivos de los conservantes en sus bebidas, la demanda de productos sin conservantes está en su punto máximo.
- Aumento de la demanda de envases retortables por parte de las aerolíneas
Recientemente, los consumidores se están inclinando cada vez más por opciones de embalaje sostenibles y respetuosas con el medio ambiente, lo que ha llevado a la introducción de embalajes totalmente reciclables y bolsas verticales de diversos diseños. Además de ofrecer ventajas medioambientales, los embalajes sostenibles también pueden ayudar a las empresas a aumentar sus beneficios y eliminar piezas de repuesto innecesarias, mejorando así la seguridad de las líneas de producción y minimizando los costes de eliminación. El objetivo principal del embalaje no es solo proteger el producto de daños durante el transporte, sino también proteger el almacén y las tiendas minoristas antes de vender el producto. Se utilizan distintos tipos de embalajes para distintos tipos de productos. Además, los embalajes termosellables se utilizan para productos alimenticios pesados y voluminosos y también para otros productos.
- Crece la demanda de envases inteligentes para evitar el desperdicio de alimentos
Los envases inteligentes ofrecen diversas soluciones para reducir el desperdicio de alimentos, ya que proporcionan diferentes indicadores para evitar que los alimentos se estropeen. Por ello, el creciente desperdicio de alimentos está atrayendo a los consumidores a comprar alimentos con envases inteligentes.
Los envases inteligentes incluyen indicadores (indicadores de tiempo y temperatura; indicadores de integridad o de gas; indicadores de frescura); códigos de barras y etiquetas de identificación por radiofrecuencia (RFID); sensores (biosensores; sensores de gas; sensores de oxígeno basados en fluorescencia), entre otros. Por lo tanto, los envases inteligentes ayudan a los fabricantes de alimentos a rastrear el estado de sus productos alimenticios en tiempo real, contribuyendo así a la reducción del desperdicio de alimentos.
Además, los envases inteligentes también pueden actuar como herramienta principal para que los consumidores elijan sus productos en el comercio minorista, ya que los conceptos de envases inteligentes pueden permitir a los consumidores juzgar la calidad de los productos. Como resultado, se espera que los envases inteligentes desempeñen un papel importante a la hora de atraer a los consumidores.
- Altos costos asociados con las actividades de investigación y desarrollo
Los gastos de investigación y desarrollo están directamente relacionados con la investigación y el desarrollo de los bienes o servicios de una empresa y con cualquier propiedad intelectual generada en el proceso. Una empresa generalmente incurre en gastos de I+D en el proceso de búsqueda y creación de nuevos productos o servicios.
Las empresas de envasado dependen en gran medida de sus capacidades de investigación y desarrollo, por lo que pueden aumentar relativamente los gastos de I+D. Por ejemplo, pueden cambiar las preferencias de los consumidores de envases convencionales a envases inteligentes y activos, aumentar la conciencia de los consumidores sobre la seguridad alimentaria, entre otros. Por lo tanto, las empresas tienen que invertir en actividades de investigación y desarrollo para diversificar su negocio y encontrar nuevas oportunidades de crecimiento a medida que la tecnología continúa evolucionando.
- Prohibición de productos con envases de plástico en el mercado mundial
Ante el aumento de las preocupaciones ambientales en varias regiones, el gobierno ha tomado medidas estrictas para prohibir en el mercado los productos de plástico de un solo uso y los envases no biodegradables, ya que los productos de plástico tardan más en descomponerse y son peligrosos para los animales acuáticos y terrestres.
Por ejemplo,
Natural Environment estima que aproximadamente 100.000 tortugas marinas y otros animales marinos mueren cada año porque se estrangulan en bolsas o las confunden con comida.
En América del Norte, las bolsas de plástico de un solo uso que se utilizan para envasar alimentos y bienes de consumo están prohibidas. Como resultado, la demanda de envases de cartón y de plástico retorcido está aumentando en la región.
Se utilizan varios tipos de envases en diferentes aplicaciones, lo que genera residuos y es muy perjudicial para el medio ambiente. Los envases de plástico se utilizan para envasar bienes de consumo, lo que produce residuos de envases de plástico no biodegradables y libera gases tóxicos en el suelo, lo que es peligroso para los animales y las aguas subterráneas. Por lo tanto, se han tomado medidas para prohibir los envases de bolsas de plástico, ya que son perjudiciales para el medio ambiente.
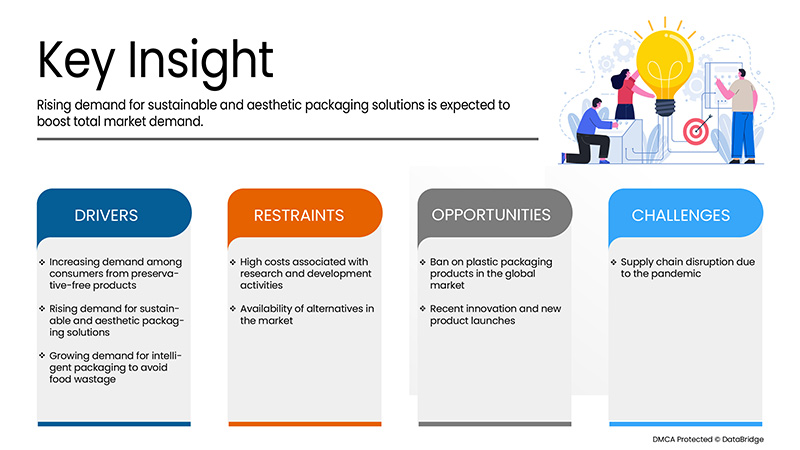
- Interrupción de la cadena de suministro debido a la pandemia
El COVID-19 ha interrumpido la cadena de suministro y ha reducido los mercados de envases de retorta en todo el mundo. Las interrupciones han provocado retrasos en el stock de los productos, así como un menor acceso y suministro de productos alimenticios y bebidas. Con la persistencia del COVID-19, ha habido restricciones en el transporte, la importación y la exportación de materiales. Además, con la restricción de movimiento de los trabajadores también se ha visto afectada la fabricación de envases de retorta debido a que no se ha satisfecho la demanda de los consumidores. Además, con las restricciones a la importación y exportación, se ha dificultado que los fabricantes suministren las materias primas y sus productos finales en todos los países del mundo, lo que también ha afectado a los precios de los envases de retorta. Por lo tanto, con las restricciones en curso debido al COVID-19, la cadena de suministro de envases de retorta se ha visto interrumpida, lo que está creando un gran desafío para los fabricantes.
Con la persistencia del COVID-19 y las restricciones de movimiento, existe una interrupción en la cadena de suministro a nivel mundial, lo que representa un desafío importante para el mercado mundial de envases retorcidos.
Impacto posterior al COVID-19 en el mercado de envases retortables
La COVID-19 ha tenido un gran impacto en el mercado de envases de plástico, ya que casi todos los países han optado por cerrar todas las instalaciones de producción, excepto las que se dedican a la producción de bienes esenciales. El gobierno ha tomado algunas medidas estrictas, como el cierre de la producción y la venta de bienes no esenciales, el bloqueo del comercio internacional y muchas más para evitar la propagación de la COVID-19. Las únicas empresas que se enfrentan a esta situación de pandemia son los servicios esenciales a los que se les permite abrir y ejecutar los procesos.
Debido al brote de la pandemia provocada por el virus, muchos pequeños sectores cerraron y, por otro lado, algunos sectores decidieron despedir a algunos de sus empleados, lo que dio lugar a un importante desempleo. Los envases termosellados también se utilizan en el envasado de productos y en las industrias. Debido al brote de una pandemia, la demanda de dichos productos ha aumentado en cierta medida, especialmente en el sector médico, la atención sanitaria, la industria farmacéutica, la alimentación, el comercio electrónico y varios otros sectores. Pero la demanda inesperada, junto con las capacidades de producción limitadas y las interrupciones de la cadena de suministro, siguen causando dificultades en todas estas industrias.
Los fabricantes están tomando diversas decisiones estratégicas para recuperarse tras la COVID-19. Los actores están llevando a cabo múltiples actividades de investigación y desarrollo para mejorar la tecnología involucrada en el envasado en autoclave. Con esto, las empresas traerán al mercado controladores avanzados y precisos. Además, el uso de envases en autoclave por parte de las autoridades gubernamentales en alimentos y bebidas ha impulsado el crecimiento del mercado.
Desarrollo reciente
- En febrero de 2021, SEE anunció la adquisición de Foxpak Flexibles Ltd. (Foxpak) bajo SEE Ventures, su iniciativa para invertir en tecnologías disruptivas y modelos de negocios para acelerar el crecimiento. Foxpak ha aprovechado las capacidades de impresión digital para imprimir directamente en sus materiales de embalaje flexible para potenciar las marcas de sus clientes. Sus soluciones se pueden ampliar o reducir rápidamente para satisfacer los requisitos de producción de clientes de cualquier tamaño. Esta adquisición ayudará a fortalecer los flujos de efectivo y las ganancias. Amplía aún más la cartera de embalajes de la empresa.
- En diciembre de 2021, Sonoco adquirió Ball Metalpack. La adquisición complementa la franquicia de envases de consumo más grande de Sonoco. Ball Metalpack, un fabricante líder de envases metálicos sostenibles para alimentos y productos para el hogar y el mayor productor de aerosoles de América del Norte. Esta adquisición ayudará a fortalecer los flujos de efectivo y las ganancias. Amplía aún más la cartera de envases de la empresa.
Alcance del mercado mundial de envases de retorta
El mercado de envases de retorta está segmentado en función del tipo de producto, el material, el canal de distribución y el uso final. El crecimiento entre estos segmentos le ayudará a analizar los segmentos de crecimiento reducido de las industrias y brindará a los usuarios una valiosa descripción general del mercado y conocimientos del mercado para ayudarlos a tomar decisiones estratégicas para identificar las principales aplicaciones del mercado.
Tipo de producto
- Bandejas
- Bolsas
- Cajas de cartón
- Otros
Según el tipo de producto, el mercado mundial de envases retorcidos se segmenta en bandejas, bolsas, cartones y otros.
Material
- MASCOTA
- Polipropileno
- Papel de aluminio
- Poliamida (PA)
- Papel y cartón
- EVOH
- Otros
Sobre la base del material, el mercado mundial de envases de retorta se ha segmentado en PET, polipropileno, papel de aluminio, poliamida (PA), papel y cartón, EVOH y otros.
Canal de distribución
- Desconectado
- En línea
Sobre la base del canal de distribución, el mercado global de envases de retorta se ha segmentado en en línea y fuera de línea.
Uso final
- Alimento
- Bebidas
- Productos farmacéuticos
- Otros
Sobre la base del uso final, el mercado mundial de envases retortables se ha segmentado en alimentos, bebidas, productos farmacéuticos y otros.
Análisis y perspectivas regionales del mercado de envases retortables
Se analiza el mercado de envases de retorta y se proporcionan información y tendencias del tamaño del mercado por tipo de producto, material, canal de distribución e industria de uso final como se menciona anteriormente.
Los países cubiertos en el informe del mercado de envases de retorta son EE. UU., Canadá y México en América del Norte, Reino Unido, Alemania, Francia, España, Italia, Países Bajos, Suiza, Rusia, Bélgica, Turquía, Luxemburgo y el resto de Europa, China, Corea del Sur, Japón, India, Australia, Singapur, Malasia, Indonesia, Tailandia, Filipinas y el resto de Asia-Pacífico en Asia-Pacífico (APAC), Sudáfrica, Arabia Saudita, Emiratos Árabes Unidos, Israel, Egipto y el resto de Medio Oriente y África (MEA) como parte de Medio Oriente y África (MEA), Brasil, Argentina y el resto de América del Sur como parte de América del Sur.
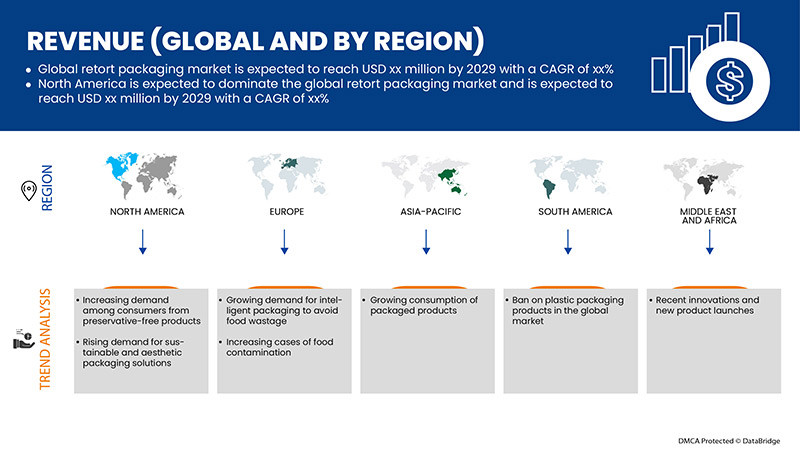
Se espera que el mercado de envases termorretráctiles de América del Norte sea el de más rápido crecimiento del mundo. El creciente desarrollo de la infraestructura, el comercio y la industria del envasado en países emergentes como Estados Unidos, Canadá y México se atribuyen al dominio del mercado. Estados Unidos domina la región de América del Norte debido a los principales reemplazos alternativos para los envases convencionales. Alemania domina el mercado de envases termorretráctiles de Europa, debido al aumento de las inversiones para el crecimiento de los envases termorretráctiles. China domina el mercado de envases termorretráctiles de Asia y el Pacífico. Se prevé que la demanda en esta región esté impulsada por el aumento de la demanda de envases termorretráctiles por parte de alimentos y bebidas.
La sección de países del informe también proporciona factores de impacto de mercado individuales y cambios en la regulación del mercado que afectan las tendencias actuales y futuras del mercado. Los puntos de datos como el análisis de la cadena de valor ascendente y descendente, las tendencias técnicas y el análisis de las cinco fuerzas de Porter, los estudios de casos son algunos de los indicadores utilizados para pronosticar el escenario del mercado para países individuales. Además, la presencia y disponibilidad de marcas globales y sus desafíos enfrentados debido a la competencia grande o escasa de las marcas locales y nacionales, el impacto de los aranceles nacionales y las rutas comerciales se consideran al proporcionar un análisis de pronóstico de los datos del país.
Análisis del panorama competitivo y de la cuota de mercado de los envases termosellados
El panorama competitivo del mercado de envases de retorta proporciona detalles por competidor. Los detalles incluidos son una descripción general de la empresa, las finanzas de la empresa, los ingresos generados, el potencial de mercado, la inversión en investigación y desarrollo, las nuevas iniciativas de mercado, la presencia global, los sitios e instalaciones de producción, las capacidades de producción, las fortalezas y debilidades de la empresa, el lanzamiento de productos, la amplitud y la variedad de productos, el dominio de las aplicaciones. Los puntos de datos anteriores proporcionados solo están relacionados con el enfoque de las empresas en relación con el mercado de envases de retorta.
Algunos de los principales actores que operan en el mercado de envases de retorta son ProAmpac, Coveris, Berry Global Inc., FLAIR Flexible Packaging Corporation, IMPAK CORPORATION, PORTCO PACKAGING, Constantia Flexibles, Mondi, Tetra Pak, Clifton Packaging Group Limited, DNP America, LLC., Sonoco Products Company, Amcor plc, Sealed Air, WINPAK LTD., Huhtamaki, LD PACKAGING CO., LTD, Paharpur 3P, Printpack y Floeter India Retort Pouches (P) Ltd, entre otros.
SKU-
Obtenga acceso en línea al informe sobre la primera nube de inteligencia de mercado del mundo

- Panel de análisis de datos interactivo
- Panel de análisis de empresas para oportunidades con alto potencial de crecimiento
- Acceso de analista de investigación para personalización y consultas
- Análisis de la competencia con panel interactivo
- Últimas noticias, actualizaciones y análisis de tendencias
- Aproveche el poder del análisis de referencia para un seguimiento integral de la competencia
Tabla de contenido
1 INTRODUCTION
1.1 OBJECTIVES OF THE STUDY
1.2 MARKET DEFINITION
1.3 OVERVIEW OF GLOBAL RETORT PACKAGING MARKET
1.4 CURRENCY AND PRICING
1.5 LIMITATIONS
1.6 MARKETS COVERED
2 MARKET SEGMENTATION
2.1 MARKETS COVERED
2.2 GEOGRAPHICAL SCOPE
2.3 YEARS CONSIDERED FOR THE STUDY
2.4 DBMR TRIPOD DATA VALIDATION MODEL
2.5 PRIMARY INTERVIEWS WITH KEY OPINION LEADERS
2.6 DBMR MARKET POSITION GRID
2.7 VENDOR SHARE ANALYSIS
2.8 MULTIVARIATE MODELING
2.9 PRODUCT TYPE TIMELINE CURVE
2.1 MARKET APPLICATION COVERAGE GRID
2.11 SECONDARY SOURCES
2.12 ASSUMPTIONS
3 EXECUTIVE SUMMARY
4 PREMIUM INSIGHTS
4.1 TECHNOLOGICAL ADVANCEMENTS BY MANUFACTURERS
4.1.1 OVERVIEW
4.1.2 DEVELOPMENT OF ADVANCED SMART PACKAGING PRODUCTS
4.1.3 TEMPERATURE BALANCING SMART PACKAGING
4.1.4 SMART PACKAGING TO IMPROVE CONSUMER SAFETY
4.2 REGULATIONS
4.2.1 OVERVIEW
4.2.2 FOOD AND DRUG ADMINISTRATION
4.2.3 EUROPEAN FOOD PACKAGING REGULATIONS
4.2.4 FOOD SAFETY AND STANDARDS AUTHORITY OF INDIA (FSSAI)
4.3 EMERGING TREND
4.4 PRICE TREND ANALYSIS
4.5 PRODUCTION CONSUMPTION ANALYSIS
4.6 IMPORT-EXPORT SCENARIO
4.7 PORTER’S FIVE FORCE ANALYSIS
4.8 SUPPLIER OVERVIEW
4.9 SUPPLY CHAIN ANALYSIS
4.9.1 OVERVIEW
4.9.2 LOGISTIC COST SCENARIO
4.9.3 IMPORTANCE OF LOGISTICS SERVICE PROVIDERS
5 MARKET OVERVIEW
5.1 DRIVERS
5.1.1 INCREASING DEMAND AMONG CONSUMERS FOR PRESERVATIVE-FREE PRODUCTS
5.1.2 RISING DEMAND FOR SUSTAINABLE AND AESTHETIC PACKAGING SOLUTIONS
5.1.3 GROWING DEMAND FOR INTELLIGENT PACKAGING TO AVOID FOOD WASTAGE
5.1.4 GROWING CONSUMPTION OF PACKAGED PRODUCTS
5.2 RESTRAINTS
5.2.1 HIGH COSTS ASSOCIATED WITH RESEARCH AND DEVELOPMENT ACTIVITIES
5.2.2 AVAILABILITY OF ALTERNATIVES IN THE MARKET
5.3 OPPORTUNITIES
5.3.1 BAN ON PLASTIC PACKAGING PRODUCTS IN THE GLOBAL MARKET
5.3.2 RECENT INNOVATION AND NEW PRODUCT LAUNCHES
5.3.3 INCREASING CASES OF FOOD CONTAMINATION
5.4 CHALLENGE
5.4.1 SUPPLY CHAIN DISRUPTION DUE TO PANDEMIC
6 GLOBAL RETORT PACKAGING MARKET, BY PRODUCT TYPE
6.1 OVERVIEW
6.2 POUCHES
6.2.1 STAND-UP-POUCHES
6.2.2 GUSSETED POUCHES
6.2.3 BACK-SEAL QUAD
6.2.4 SPOUTED POUCHES
6.3 TRAYS
6.4 CARTONS
6.5 OTHERS
7 GLOBAL RETORT PACKAGING MARKET, BY MATERIAL
7.1 OVERVIEW
7.2 PET
7.3 POLYPROPYLENE
7.4 ALUMINIUM FOIL
7.5 POLYAMIDE (PA)
7.6 PAPER & PAPERBOARD
7.7 EVOH
7.8 OTHERS
8 GLOBAL RETORT PACKAGING MARKET, BY DISTRIBUTION CHANNEL
8.1 OVERVIEW
8.2 OFFLINE
8.3 ONLINE
9 GLOBAL RETORT PACKAGING MARKET, BY END-USE
9.1 OVERVIEW
9.2 FOOD
9.2.1 READY TO EAT MEALS
9.2.2 MEAT, POULTRY, & SEA FOOD
9.2.3 PET FOOD
9.2.4 BABY FOOD
9.2.5 SOUPS & SAUCES
9.2.6 SPICES & CONDIMENTS
9.2.7 OTHERS
9.3 BEVERAGES
9.3.1 NON-ALCOHOLIC
9.3.2 ALCOHOLIC
9.4 PHARMACEUTICALS
9.5 OTHERS
10 GLOBAL RETORT PACKAGING MARKET, BY REGION
10.1 OVERVIEW
10.2 NORTH AMERICA
10.2.1 U.S.
10.2.2 CANADA
10.2.3 MEXICO
10.3 EUROPE
10.3.1 GERMANY
10.3.2 ITALY
10.3.3 FRANCE
10.3.4 SPAIN
10.3.5 U.K.
10.3.6 RUSSIA
10.3.7 BELGIUM
10.3.8 SWITZERLAND
10.3.9 NETHERLANDS
10.3.10 TURKEY
10.3.11 LUXEMBURG
10.3.12 REST OF EUROPE
10.4 ASIA-PACIFIC
10.4.1 CHINA
10.4.2 JAPAN
10.4.3 SOUTH KOREA
10.4.4 INDIA
10.4.5 AUSTRALIA & NEW ZEALAND
10.4.6 SINGAPORE
10.4.7 INDONESIA
10.4.8 THAILAND
10.4.9 MALAYSIA
10.4.10 PHILIPPINES
10.4.11 REST OF ASIA-PACIFIC
10.5 MIDDLE EAST AND AFRICA
10.5.1 SOUTH AFRICA
10.5.2 SAUDI ARABIA
10.5.3 EGYPT
10.5.4 U.A.E.
10.5.5 ISRAEL
10.5.6 REST OF MIDDLE EAST AND AFRICA
10.6 SOUTH AMERICA
10.6.1 BRAZIL
10.6.2 ARGENTINA
10.6.3 REST OF SOUTH AMERICA
11 GLOBAL RETORT PACKAGING MARKET: COMPANY LANDSCAPE
11.1 COMPANY SHARE ANALYSIS: GLOBAL
11.2 COMPANY SHARE ANALYSIS: NORTH AMERICA
11.3 COMPANY SHARE ANALYSIS: EUROPE
11.4 COMPANY SHARE ANALYSIS: ASIA-PACIFIC
12 SWOT ANALYSIS
13 COMPANY PROFILE
13.1 TETRA PAK
13.1.1 COMPANY SNAPSHOT
13.1.2 COMPANY SHARE ANALYSIS
13.1.3 PRODUCT PORTFOLIO
13.1.4 RECENT DEVELOPMENT
13.2 SEALED AIR
13.2.1 COMPANY SNAPSHOT
13.2.2 REVENUE ANALYSIS
13.2.3 COMPANY SHARE ANALYSIS
13.2.4 PRODUCT PORTFOLIO
13.2.5 RECENT DEVELOPMENT
13.3 SONOCO PRODUCTS COMPANY
13.3.1 COMPANY SNAPSHOT
13.3.2 REVENUE ANALYSIS
13.3.3 COMPANY SHARE ANALYSIS
13.3.4 PRODUCT PORTFOLIO
13.3.5 RECENT DEVELOPMENTS
13.4 PROAMPAC
13.4.1 COMPANY SNAPSHOT
13.4.2 COMPANY SHARE ANALYSIS
13.4.3 PRODUCT PORTFOLIO
13.4.4 RECENT DEVELOPMENTS
13.5 AMCOR PLC
13.5.1 COMPANY SNAPSHOT
13.5.2 REVENUE ANALYSIS
13.5.3 COMPANY SHARE ANALYSIS
13.5.4 PRODUCT PORTFOLIO
13.5.5 RECENT DEVELOPMENTS
13.6 BERRY GLOBAL INC.
13.6.1 COMPANY SNAPSHOT
13.6.2 COMPANY SNAPSHOT
13.6.3 PRODUCT PORTFOLIO
13.6.4 RECENT DEVELOPMENT
13.7 CLIFTON PACKAGING GROUP LIMITED
13.7.1 COMPANY SNAPSHOT
13.7.2 PRODUCT PORTFOLIO
13.7.3 RECENT DEVELOPMENT
13.8 CONSTANTIA FLEXIBLES
13.8.1 COMPANY SNAPSHOT
13.8.2 PRODUCT PORTFOLIO
13.8.3 RECENT DEVELOPMENT
13.9 COVERIS
13.9.1 COMPANY SNAPSHOT
13.9.2 RODUCT PORTFOLIO
13.9.3 RECENT DEVELOPMENT
13.1 DNP AMERICA, LLC.
13.10.1 COMPANY SNAPSHOT
13.10.2 PRODUCT PORTFOLIO
13.10.3 RECENT DEVELOPMENT
13.11 FLAIR FLEXIBLE PACKAGING CORPORATION
13.11.1 COMPANY SNAPSHOT
13.11.2 PRODUCT PORTFOLIO
13.11.3 RECENT DEVELOPMENT
13.12 FLOETER INDIA RETORT POUCHES (P) LTD
13.12.1 COMPANY SNAPSHOT
13.12.2 PRODUCT PORTFOLIO
13.12.3 RECENT DEVELOPMENT
13.13 HUHTAMAKI
13.13.1 COMPANY SNAPSHOT
13.13.2 REVENUE ANALYSIS
13.13.3 PRODUCT PORTFOLIO
13.13.4 RECENT DEVELOPMENT
13.14 IMPAK CORPORATION
13.14.1 COMPANY SNAPSHOT
13.14.2 PRODUCT PORTFOLIO
13.14.3 RECENT DEVELOPMENT
13.15 LD PACKAGING CO .,LTD
13.15.1 COMPANY SNAPSHOT
13.15.2 PRODUCT PORTFOLIO
13.15.3 RECENT DEVELOPMENT
13.16 MONDI
13.16.1 COMPANY SNAPSHOT
13.16.2 REVENUE ANALYSIS
13.16.3 PRODUCT PORTFOLIO
13.16.4 RECENT DEVELOPMENTS
13.17 PAHARPUR 3P
13.17.1 COMPANY SNAPSHOT
13.17.2 PRODUCT PORTFOLIO
13.17.3 RECENT DEVELOPMENT
13.18 PORTCO PACKAGING
13.18.1 COMPANY SNAPSHOT
13.18.2 PRODUCT PORTFOLIO
13.18.3 RECENT DEVELOPMENTS
13.19 PRINTPACK
13.19.1 COMPANY SNAPSHOT
13.19.2 PRODUCT PORTFOLIO
13.19.3 RECENT DEVELOPMENT
13.2 WINPAK LTD.
13.20.1 COMPANY SNAPSHOT
13.20.2 REVENUE ANALYSIS
13.20.3 PRODUCT PORTFOLIO
13.20.4 RECENT DEVELOPMENT
14 QUESTIONNAIRE
15 RELATED REPORTS
Lista de Tablas
TABLE 1 GLOBAL RETORT PACKAGING MARKET, BY PRODUCT TYPE, 2020-2029 (USD MILLION)
TABLE 2 GLOBAL RETORT PACKAGING MARKET, BY PRODUCT TYPE, 2020-2029 (MILLION UNITS)
TABLE 3 GLOBAL POUCHES IN RETORT PACKAGING MARKET, BY REGION, 2020-2029 (USD MILLION)
TABLE 4 GLOBAL POUCHES IN RETORT PACKAGING MARKET, BY REGION, 2020-2029 (MILLION UNITS)
TABLE 5 GLOBAL POUCHES IN RETORT PACKAGING MARKET, BY PRODUCT TYPE, 2020-2029 (USD MILLION)
TABLE 6 GLOBAL TRAYS IN RETORT PACKAGING MARKET, BY REGION, 2020-2029 (USD MILLION)
TABLE 7 GLOBAL TRAYS IN RETORT PACKAGING MARKET, BY REGION, 2020-2029 (MILLION UNITS)
TABLE 8 GLOBAL CARTONS IN RETORT PACKAGING MARKET, BY REGION, 2020-2029 (USD MILLION)
TABLE 9 GLOBAL CARTONS IN RETORT PACKAGING MARKET, BY REGION, 2020-2029 (MILLION UNITS)
TABLE 10 GLOBAL OTHERS IN RETORT PACKAGING MARKET, BY REGION, 2020-2029 (USD MILLION)
TABLE 11 GLOBAL OTHERS IN RETORT PACKAGING MARKET, BY REGION, 2020-2029 (MILLION UNITS)
TABLE 12 GLOBAL RETORT PACKAGING MARKET, BY MATERIAL, 2020-2029 (USD MILLION)
TABLE 13 GLOBAL RETORT PACKAGING MARKET, BY MATERIAL, 2020-2029 (MILLION UNITS)
TABLE 14 GLOBAL PET IN RETORT PACKAGING MARKET, BY REGION, 2020-2029 (USD MILLION)
TABLE 15 GLOBAL PET IN RETORT PACKAGING MARKET, BY REGION, 2020-2029 (MILLION UNITS)
TABLE 16 GLOBAL POLYPROPYLENE IN RETORT PACKAGING MARKET, BY REGION, 2020-2029 (USD MILLION)
TABLE 17 GLOBAL POLYPROPYLENE IN RETORT PACKAGING MARKET, BY REGION, 2020-2029 (MILLION UNITS)
TABLE 18 GLOBAL ALUMINUM FOIL IN RETORT PACKAGING MARKET, BY REGION, 2020-2029 (USD MILLION)
TABLE 19 GLOBAL ALUMINUM FOIL IN RETORT PACKAGING MARKET, BY REGION, 2020-2029 (MILLION UNITS)
TABLE 20 GLOBAL POLYAMIDE (PA) IN RETORT PACKAGING MARKET, BY REGION, 2020-2029 (USD MILLION)
TABLE 21 GLOBAL POLYAMIDE (PA) IN RETORT PACKAGING MARKET, BY REGION, 2020-2029 (MILLION UNITS)
TABLE 22 GLOBAL PAPER & PAPERBOARD IN RETORT PACKAGING MARKET, BY REGION, 2020-2029 (USD MILLION)
TABLE 23 GLOBAL PAPER & PAPERBOARD IN RETORT PACKAGING MARKET, BY REGION, 2020-2029 (MILLION UNITS)
TABLE 24 GLOBAL EVOH IN RETORT PACKAGING MARKET, BY REGION, 2020-2029 (USD MILLION)
TABLE 25 GLOBAL EVOH IN RETORT PACKAGING MARKET, BY REGION, 2020-2029 (MILLION UNITS)
TABLE 26 GLOBAL OTHERS IN RETORT PACKAGING MARKET, BY REGION, 2020-2029 (USD MILLION)
TABLE 27 GLOBAL OTHERS IN RETORT PACKAGING MARKET, BY REGION, 2020-2029 (MILLION UNITS)
TABLE 28 GLOBAL RETORT PACKAGING MARKET, BY DISTRIBUTION CHANNEL, 2020-2029 (USD MILLION)
TABLE 29 GLOBAL RETORT PACKAGING MARKET, BY DISTRIBUTION CHANNEL, 2020-2029 (MILLION UNITS)
TABLE 30 GLOBAL OFFLINE IN RETORT PACKAGING MARKET, BY REGION, 2020-2029 (USD MILLION)
TABLE 31 GLOBAL OFFLINE IN RETORT PACKAGING MARKET, BY REGION, 2020-2029 (MILLION UNITS)
TABLE 32 GLOBAL ONLINE IN RETORT PACKAGING MARKET, BY REGION, 2020-2029 (USD MILLION)
TABLE 33 GLOBAL ONLINE IN RETORT PACKAGING MARKET, BY REGION, 2020-2029 (MILLION UNITS)
TABLE 34 GLOBAL RETORT PACKAGING MARKET, BY END-USE, 2020-2029 (USD MILLION)
TABLE 35 GLOBAL RETORT PACKAGING MARKET, BY END-USE, 2020-2029 (MILLION UNITS)
TABLE 36 GLOBAL FOOD IN RETORT PACKAGING MARKET, BY REGION, 2020-2029 (USD MILLION)
TABLE 37 GLOBAL FOOD IN RETORT PACKAGING MARKET, BY REGION, 2020-2029 (MILLION UNITS)
TABLE 38 GLOBAL FOOD IN RETORT PACKAGING MARKET, BY END-USE, 2020-2029 (USD MILLION)
TABLE 39 GLOBAL BEVERAGES IN RETORT PACKAGING MARKET, BY REGION, 2020-2029 (USD MILLION)
TABLE 40 GLOBAL BEVERAGES IN RETORT PACKAGING MARKET, BY REGION, 2020-2029 (MILLION UNITS)
TABLE 41 GLOBAL BEVERAGES IN RETORT PACKAGING MARKET, BY END-USE, 2020-2029 (USD MILLION)
TABLE 42 GLOBAL PHARMACEUTICAL IN RETORT PACKAGING MARKET, BY REGION, 2020-2029 (USD MILLION)
TABLE 43 GLOBAL PHARMACEUTICAL IN RETORT PACKAGING MARKET, BY REGION, 2020-2029 (MILLION UNITS)
TABLE 44 GLOBAL OTHERS IN RETORT PACKAGING MARKET, BY REGION, 2020-2029 (USD MILLION)
TABLE 45 GLOBAL OTHERS IN RETORT PACKAGING MARKET, BY REGION, 2020-2029 (MILLION UNITS)
TABLE 46 GLOBAL RETORT PACKAGING MARKET, BY REGION, 2020-2029 (USD MILLION)
TABLE 47 GLOBAL RETORT PACKAGING MARKET, BY REGION, 2020-2029 (MILLION UNITS)
TABLE 48 NORTH AMERICA RETORT PACKAGING MARKET, BY COUNTRY, 2020-2029 (USD MILLION)
TABLE 49 NORTH AMERICA RETORT PACKAGING MARKET, BY COUNTRY, 2020-2029 (MILLION UNITS)
TABLE 50 NORTH AMERICA RETORT PACKAGING MARKET, BY PRODUCT TYPE, 2020-2029 (USD MILLION)
TABLE 51 NORTH AMERICA RETORT PACKAGING MARKET, BY PRODUCT TYPE, 2020-2029 (MILLION UNITS)
TABLE 52 NORTH AMERICA POUCHES IN RETORT PACKAGING MARKET, BY PRODUCT TYPE, 2020-2029 (USD MILLION)
TABLE 53 NORTH AMERICA RETORT PACKAGING MARKET, BY MATERIAL, 2020-2029 (USD MILLION)
TABLE 54 NORTH AMERICA RETORT PACKAGING MARKET, BY MATERIAL, 2020-2029 (MILLION UNITS)
TABLE 55 NORTH AMERICA RETORT PACKAGING MARKET, BY DISTRIBUTION CHANNEL, 2020-2029 (USD MILLION)
TABLE 56 NORTH AMERICA RETORT PACKAGING MARKET, BY DISTRIBUTION CHANNEL, 2020-2029 (MILLION UNITS)
TABLE 57 NORTH AMERICA RETORT PACKAGING MARKET, BY END-USE, 2020-2029 (USD MILLION)
TABLE 58 NORTH AMERICA RETORT PACKAGING MARKET, BY END-USE, 2020-2029 (MILLION UNITS)
TABLE 59 NORTH AMERICA FOOD IN RETORT PACKAGING MARKET, BY END-USE, 2020-2029 (USD MILLION)
TABLE 60 NORTH AMERICA BEVERAGES IN RETORT PACKAGING MARKET, BY END-USE, 2020-2029 (USD MILLION)
TABLE 61 U.S. RETORT PACKAGING MARKET, BY PRODUCT TYPE, 2020-2029 (USD MILLION)
TABLE 62 U.S. RETORT PACKAGING MARKET, BY PRODUCT TYPE, 2020-2029 (MILLION UNITS)
TABLE 63 U.S. POUCHES IN RETORT PACKAGING MARKET, BY PRODUCT TYPE, 2020-2029 (USD MILLION)
TABLE 64 U.S. RETORT PACKAGING MARKET, BY MATERIAL, 2020-2029 (USD MILLION)
TABLE 65 U.S. RETORT PACKAGING MARKET, BY MATERIAL, 2020-2029 (MILLION UNITS)
TABLE 66 U.S. RETORT PACKAGING MARKET, BY DISTRIBUTION CHANNEL, 2020-2029 (USD MILLION)
TABLE 67 U.S. RETORT PACKAGING MARKET, BY DISTRIBUTION CHANNEL, 2020-2029 (MILLION UNITS)
TABLE 68 U.S. RETORT PACKAGING MARKET, BY END-USE, 2020-2029 (USD MILLION)
TABLE 69 U.S. RETORT PACKAGING MARKET, BY END-USE, 2020-2029 (MILLION UNITS)
TABLE 70 U.S. FOOD IN RETORT PACKAGING MARKET, BY END-USE, 2020-2029 (USD MILLION)
TABLE 71 U.S. BEVERAGES IN RETORT PACKAGING MARKET, BY END-USE, 2020-2029 (USD MILLION)
TABLE 72 CANADA RETORT PACKAGING MARKET, BY PRODUCT TYPE, 2020-2029 (USD MILLION)
TABLE 73 CANADA RETORT PACKAGING MARKET, BY PRODUCT TYPE, 2020-2029 (MILLION UNITS)
TABLE 74 CANADA POUCHES IN RETORT PACKAGING MARKET, BY PRODUCT TYPE, 2020-2029 (USD MILLION)
TABLE 75 CANADA RETORT PACKAGING MARKET, BY MATERIAL, 2020-2029 (USD MILLION)
TABLE 76 CANADA RETORT PACKAGING MARKET, BY MATERIAL, 2020-2029 (MILLION UNITS)
TABLE 77 CANADA RETORT PACKAGING MARKET, BY DISTRIBUTION CHANNEL, 2020-2029 (USD MILLION)
TABLE 78 CANADA RETORT PACKAGING MARKET, BY DISTRIBUTION CHANNEL, 2020-2029 (MILLION UNITS)
TABLE 79 CANADA RETORT PACKAGING MARKET, BY END-USE, 2020-2029 (USD MILLION)
TABLE 80 CANADA RETORT PACKAGING MARKET, BY END-USE, 2020-2029 (MILLION UNITS)
TABLE 81 CANADA FOOD IN RETORT PACKAGING MARKET, BY END-USE, 2020-2029 (USD MILLION)
TABLE 82 CANADA BEVERAGES IN RETORT PACKAGING MARKET, BY END-USE, 2020-2029 (USD MILLION)
TABLE 83 MEXICO RETORT PACKAGING MARKET, BY PRODUCT TYPE, 2020-2029 (USD MILLION)
TABLE 84 MEXICO RETORT PACKAGING MARKET, BY PRODUCT TYPE, 2020-2029 (MILLION UNITS)
TABLE 85 MEXICO POUCHES IN RETORT PACKAGING MARKET, BY PRODUCT TYPE, 2020-2029 (USD MILLION)
TABLE 86 MEXICO RETORT PACKAGING MARKET, BY MATERIAL, 2020-2029 (USD MILLION)
TABLE 87 MEXICO RETORT PACKAGING MARKET, BY MATERIAL, 2020-2029 (MILLION UNITS)
TABLE 88 MEXICO RETORT PACKAGING MARKET, BY DISTRIBUTION CHANNEL, 2020-2029 (USD MILLION)
TABLE 89 MEXICO RETORT PACKAGING MARKET, BY DISTRIBUTION CHANNEL, 2020-2029 (MILLION UNITS)
TABLE 90 MEXICO RETORT PACKAGING MARKET, BY END-USE, 2020-2029 (USD MILLION)
TABLE 91 MEXICO RETORT PACKAGING MARKET, BY END-USE, 2020-2029 (MILLION UNITS)
TABLE 92 MEXICO FOOD IN RETORT PACKAGING MARKET, BY END-USE, 2020-2029 (USD MILLION)
TABLE 93 MEXICO BEVERAGES IN RETORT PACKAGING MARKET, BY END-USE, 2020-2029 (USD MILLION)
TABLE 94 EUROPE RETORT PACKAGING MARKET, BY COUNTRY, 2020-2029 (USD MILLION)
TABLE 95 EUROPE RETORT PACKAGING MARKET, BY COUNTRY, 2020-2029 (MILLION UNITS)
TABLE 96 EUROPE RETORT PACKAGING MARKET, BY PRODUCT TYPE, 2020-2029 (USD MILLION)
TABLE 97 EUROPE RETORT PACKAGING MARKET, BY PRODUCT TYPE, 2020-2029 (MILLION UNITS)
TABLE 98 EUROPE POUCHES IN RETORT PACKAGING MARKET, BY PRODUCT TYPE, 2020-2029 (USD MILLION)
TABLE 99 EUROPE RETORT PACKAGING MARKET, BY MATERIAL, 2020-2029 (USD MILLION)
TABLE 100 EUROPE RETORT PACKAGING MARKET, BY MATERIAL, 2020-2029 (MILLION UNITS)
TABLE 101 EUROPE RETORT PACKAGING MARKET, BY DISTRIBUTION CHANNEL, 2020-2029 (USD MILLION)
TABLE 102 EUROPE RETORT PACKAGING MARKET, BY DISTRIBUTION CHANNEL, 2020-2029 (MILLION UNITS)
TABLE 103 EUROPE RETORT PACKAGING MARKET, BY END-USE, 2020-2029 (USD MILLION)
TABLE 104 EUROPE RETORT PACKAGING MARKET, BY END-USE, 2020-2029 (MILLION UNITS)
TABLE 105 EUROPE FOOD IN RETORT PACKAGING MARKET, BY END-USE, 2020-2029 (USD MILLION)
TABLE 106 EUROPE BEVERAGES IN RETORT PACKAGING MARKET, BY END-USE, 2020-2029 (USD MILLION)
TABLE 107 GERMANY RETORT PACKAGING MARKET, BY PRODUCT TYPE, 2020-2029 (USD MILLION)
TABLE 108 GERMANY RETORT PACKAGING MARKET, BY PRODUCT TYPE, 2020-2029 (MILLION UNITS)
TABLE 109 GERMANY POUCHES IN RETORT PACKAGING MARKET, BY PRODUCT TYPE, 2020-2029 (USD MILLION)
TABLE 110 GERMANY RETORT PACKAGING MARKET, BY MATERIAL, 2020-2029 (USD MILLION)
TABLE 111 GERMANY RETORT PACKAGING MARKET, BY MATERIAL, 2020-2029 (MILLION UNITS)
TABLE 112 GERMANY RETORT PACKAGING MARKET, BY DISTRIBUTION CHANNEL, 2020-2029 (USD MILLION)
TABLE 113 GERMANY RETORT PACKAGING MARKET, BY DISTRIBUTION CHANNEL, 2020-2029 (MILLION UNITS)
TABLE 114 GERMANY RETORT PACKAGING MARKET, BY END-USE, 2020-2029 (USD MILLION)
TABLE 115 GERMANY RETORT PACKAGING MARKET, BY END-USE, 2020-2029 (MILLION UNITS)
TABLE 116 GERMANY FOOD IN RETORT PACKAGING MARKET, BY END-USE, 2020-2029 (USD MILLION)
TABLE 117 GERMANY BEVERAGES IN RETORT PACKAGING MARKET, BY END-USE, 2020-2029 (USD MILLION)
TABLE 118 ITALY RETORT PACKAGING MARKET, BY PRODUCT TYPE, 2020-2029 (USD MILLION)
TABLE 119 ITALY RETORT PACKAGING MARKET, BY PRODUCT TYPE, 2020-2029 (MILLION UNITS)
TABLE 120 ITALY POUCHES IN RETORT PACKAGING MARKET, BY PRODUCT TYPE, 2020-2029 (USD MILLION)
TABLE 121 ITALY RETORT PACKAGING MARKET, BY MATERIAL, 2020-2029 (USD MILLION)
TABLE 122 ITALY RETORT PACKAGING MARKET, BY MATERIAL, 2020-2029 (MILLION UNITS)
TABLE 123 ITALY RETORT PACKAGING MARKET, BY DISTRIBUTION CHANNEL, 2020-2029 (USD MILLION)
TABLE 124 ITALY RETORT PACKAGING MARKET, BY DISTRIBUTION CHANNEL, 2020-2029 (MILLION UNITS)
TABLE 125 ITALY RETORT PACKAGING MARKET, BY END-USE, 2020-2029 (USD MILLION)
TABLE 126 ITALY RETORT PACKAGING MARKET, BY END-USE, 2020-2029 (MILLION UNITS)
TABLE 127 ITALY FOOD IN RETORT PACKAGING MARKET, BY END-USE, 2020-2029 (USD MILLION)
TABLE 128 ITALY BEVERAGES IN RETORT PACKAGING MARKET, BY END-USE, 2020-2029 (USD MILLION)
TABLE 129 FRANCE RETORT PACKAGING MARKET, BY PRODUCT TYPE, 2020-2029 (USD MILLION)
TABLE 130 FRANCE RETORT PACKAGING MARKET, BY PRODUCT TYPE, 2020-2029 (MILLION UNITS)
TABLE 131 FRANCE POUCHES IN RETORT PACKAGING MARKET, BY PRODUCT TYPE, 2020-2029 (USD MILLION)
TABLE 132 FRANCE RETORT PACKAGING MARKET, BY MATERIAL, 2020-2029 (USD MILLION)
TABLE 133 FRANCE RETORT PACKAGING MARKET, BY MATERIAL, 2020-2029 (MILLION UNITS)
TABLE 134 FRANCE RETORT PACKAGING MARKET, BY DISTRIBUTION CHANNEL, 2020-2029 (USD MILLION)
TABLE 135 FRANCE RETORT PACKAGING MARKET, BY DISTRIBUTION CHANNEL, 2020-2029 (MILLION UNITS)
TABLE 136 FRANCE RETORT PACKAGING MARKET, BY END-USE, 2020-2029 (USD MILLION)
TABLE 137 FRANCE RETORT PACKAGING MARKET, BY END-USE, 2020-2029 (MILLION UNITS)
TABLE 138 FRANCE FOOD IN RETORT PACKAGING MARKET, BY END-USE, 2020-2029 (USD MILLION)
TABLE 139 FRANCE BEVERAGES IN RETORT PACKAGING MARKET, BY END-USE, 2020-2029 (USD MILLION)
TABLE 140 SPAIN RETORT PACKAGING MARKET, BY PRODUCT TYPE, 2020-2029 (USD MILLION)
TABLE 141 SPAIN RETORT PACKAGING MARKET, BY PRODUCT TYPE, 2020-2029 (MILLION UNITS)
TABLE 142 SPAIN POUCHES IN RETORT PACKAGING MARKET, BY PRODUCT TYPE, 2020-2029 (USD MILLION)
TABLE 143 SPAIN RETORT PACKAGING MARKET, BY MATERIAL, 2020-2029 (USD MILLION)
TABLE 144 SPAIN RETORT PACKAGING MARKET, BY MATERIAL, 2020-2029 (MILLION UNITS)
TABLE 145 SPAIN RETORT PACKAGING MARKET, BY DISTRIBUTION CHANNEL, 2020-2029 (USD MILLION)
TABLE 146 SPAIN RETORT PACKAGING MARKET, BY DISTRIBUTION CHANNEL, 2020-2029 (MILLION UNITS)
TABLE 147 SPAIN RETORT PACKAGING MARKET, BY END-USE, 2020-2029 (USD MILLION)
TABLE 148 SPAIN RETORT PACKAGING MARKET, BY END-USE, 2020-2029 (MILLION UNITS)
TABLE 149 SPAIN FOOD IN RETORT PACKAGING MARKET, BY END-USE, 2020-2029 (USD MILLION)
TABLE 150 SPAIN BEVERAGES IN RETORT PACKAGING MARKET, BY END-USE, 2020-2029 (USD MILLION)
TABLE 151 U.K. RETORT PACKAGING MARKET, BY PRODUCT TYPE, 2020-2029 (USD MILLION)
TABLE 152 U.K. RETORT PACKAGING MARKET, BY PRODUCT TYPE, 2020-2029 (MILLION UNITS)
TABLE 153 U.K. POUCHES IN RETORT PACKAGING MARKET, BY PRODUCT TYPE, 2020-2029 (USD MILLION)
TABLE 154 U.K. RETORT PACKAGING MARKET, BY MATERIAL, 2020-2029 (USD MILLION)
TABLE 155 U.K. RETORT PACKAGING MARKET, BY MATERIAL, 2020-2029 (MILLION UNITS)
TABLE 156 U.K. RETORT PACKAGING MARKET, BY DISTRIBUTION CHANNEL, 2020-2029 (USD MILLION)
TABLE 157 U.K. RETORT PACKAGING MARKET, BY DISTRIBUTION CHANNEL, 2020-2029 (MILLION UNITS)
TABLE 158 U.K. RETORT PACKAGING MARKET, BY END-USE, 2020-2029 (USD MILLION)
TABLE 159 U.K. RETORT PACKAGING MARKET, BY END-USE, 2020-2029 (MILLION UNITS)
TABLE 160 U.K. FOOD IN RETORT PACKAGING MARKET, BY END-USE, 2020-2029 (USD MILLION)
TABLE 161 U.K. BEVERAGES IN RETORT PACKAGING MARKET, BY END-USE, 2020-2029 (USD MILLION)
TABLE 162 RUSSIA RETORT PACKAGING MARKET, BY PRODUCT TYPE, 2020-2029 (USD MILLION)
TABLE 163 RUSSIA RETORT PACKAGING MARKET, BY PRODUCT TYPE, 2020-2029 (MILLION UNITS)
TABLE 164 RUSSIA POUCHES IN RETORT PACKAGING MARKET, BY PRODUCT TYPE, 2020-2029 (USD MILLION)
TABLE 165 RUSSIA RETORT PACKAGING MARKET, BY MATERIAL, 2020-2029 (USD MILLION)
TABLE 166 RUSSIA RETORT PACKAGING MARKET, BY MATERIAL, 2020-2029 (MILLION UNITS)
TABLE 167 RUSSIA RETORT PACKAGING MARKET, BY DISTRIBUTION CHANNEL, 2020-2029 (USD MILLION)
TABLE 168 RUSSIA RETORT PACKAGING MARKET, BY DISTRIBUTION CHANNEL, 2020-2029 (MILLION UNITS)
TABLE 169 RUSSIA RETORT PACKAGING MARKET, BY END-USE, 2020-2029 (USD MILLION)
TABLE 170 RUSSIA RETORT PACKAGING MARKET, BY END-USE, 2020-2029 (MILLION UNITS)
TABLE 171 RUSSIA FOOD IN RETORT PACKAGING MARKET, BY END-USE, 2020-2029 (USD MILLION)
TABLE 172 RUSSIA BEVERAGES IN RETORT PACKAGING MARKET, BY END-USE, 2020-2029 (USD MILLION)
TABLE 173 BELGIUM RETORT PACKAGING MARKET, BY PRODUCT TYPE, 2020-2029 (USD MILLION)
TABLE 174 BELGIUM RETORT PACKAGING MARKET, BY PRODUCT TYPE, 2020-2029 (MILLION UNITS)
TABLE 175 BELGIUM POUCHES IN RETORT PACKAGING MARKET, BY PRODUCT TYPE, 2020-2029 (USD MILLION)
TABLE 176 BELGIUM RETORT PACKAGING MARKET, BY MATERIAL, 2020-2029 (USD MILLION)
TABLE 177 BELGIUM RETORT PACKAGING MARKET, BY MATERIAL, 2020-2029 (MILLION UNITS)
TABLE 178 BELGIUM RETORT PACKAGING MARKET, BY DISTRIBUTION CHANNEL, 2020-2029 (USD MILLION)
TABLE 179 BELGIUM RETORT PACKAGING MARKET, BY DISTRIBUTION CHANNEL, 2020-2029 (MILLION UNITS)
TABLE 180 BELGIUM RETORT PACKAGING MARKET, BY END-USE, 2020-2029 (USD MILLION)
TABLE 181 BELGIUM RETORT PACKAGING MARKET, BY END-USE, 2020-2029 (MILLION UNITS)
TABLE 182 BELGIUM FOOD IN RETORT PACKAGING MARKET, BY END-USE, 2020-2029 (USD MILLION)
TABLE 183 BELGIUM BEVERAGES IN RETORT PACKAGING MARKET, BY END-USE, 2020-2029 (USD MILLION)
TABLE 184 SWITZERLAND RETORT PACKAGING MARKET, BY PRODUCT TYPE, 2020-2029 (USD MILLION)
TABLE 185 SWITZERLAND RETORT PACKAGING MARKET, BY PRODUCT TYPE, 2020-2029 (MILLION UNITS)
TABLE 186 SWITZERLAND POUCHES IN RETORT PACKAGING MARKET, BY PRODUCT TYPE, 2020-2029 (USD MILLION)
TABLE 187 SWITZERLAND RETORT PACKAGING MARKET, BY MATERIAL, 2020-2029 (USD MILLION)
TABLE 188 SWITZERLAND RETORT PACKAGING MARKET, BY MATERIAL, 2020-2029 (MILLION UNITS)
TABLE 189 SWITZERLAND RETORT PACKAGING MARKET, BY DISTRIBUTION CHANNEL, 2020-2029 (USD MILLION)
TABLE 190 SWITZERLAND RETORT PACKAGING MARKET, BY DISTRIBUTION CHANNEL, 2020-2029 (MILLION UNITS)
TABLE 191 SWITZERLAND RETORT PACKAGING MARKET, BY END-USE, 2020-2029 (USD MILLION)
TABLE 192 SWITZERLAND RETORT PACKAGING MARKET, BY END-USE, 2020-2029 (MILLION UNITS)
TABLE 193 SWITZERLAND FOOD IN RETORT PACKAGING MARKET, BY END-USE, 2020-2029 (USD MILLION)
TABLE 194 SWITZERLAND BEVERAGES IN RETORT PACKAGING MARKET, BY END-USE, 2020-2029 (USD MILLION)
TABLE 195 NETHERLANDS RETORT PACKAGING MARKET, BY PRODUCT TYPE, 2020-2029 (USD MILLION)
TABLE 196 NETHERLANDS RETORT PACKAGING MARKET, BY PRODUCT TYPE, 2020-2029 (MILLION UNITS)
TABLE 197 NETHERLANDS POUCHES IN RETORT PACKAGING MARKET, BY PRODUCT TYPE, 2020-2029 (USD MILLION)
TABLE 198 NETHERLANDS RETORT PACKAGING MARKET, BY MATERIAL, 2020-2029 (USD MILLION)
TABLE 199 NETHERLANDS RETORT PACKAGING MARKET, BY MATERIAL, 2020-2029 (MILLION UNITS)
TABLE 200 NETHERLANDS RETORT PACKAGING MARKET, BY DISTRIBUTION CHANNEL, 2020-2029 (USD MILLION)
TABLE 201 NETHERLANDS RETORT PACKAGING MARKET, BY DISTRIBUTION CHANNEL, 2020-2029 (MILLION UNITS)
TABLE 202 NETHERLANDS RETORT PACKAGING MARKET, BY END-USE, 2020-2029 (USD MILLION)
TABLE 203 NETHERLANDS RETORT PACKAGING MARKET, BY END-USE, 2020-2029 (MILLION UNITS)
TABLE 204 NETHERLANDS FOOD IN RETORT PACKAGING MARKET, BY END-USE, 2020-2029 (USD MILLION)
TABLE 205 NETHERLANDS BEVERAGES IN RETORT PACKAGING MARKET, BY END-USE, 2020-2029 (USD MILLION)
TABLE 206 TURKEY RETORT PACKAGING MARKET, BY PRODUCT TYPE, 2020-2029 (USD MILLION)
TABLE 207 TURKEY RETORT PACKAGING MARKET, BY PRODUCT TYPE, 2020-2029 (MILLION UNITS)
TABLE 208 TURKEY POUCHES IN RETORT PACKAGING MARKET, BY PRODUCT TYPE, 2020-2029 (USD MILLION)
TABLE 209 TURKEY RETORT PACKAGING MARKET, BY MATERIAL, 2020-2029 (USD MILLION)
TABLE 210 TURKEY RETORT PACKAGING MARKET, BY MATERIAL, 2020-2029 (MILLION UNITS)
TABLE 211 TURKEY RETORT PACKAGING MARKET, BY DISTRIBUTION CHANNEL, 2020-2029 (USD MILLION)
TABLE 212 TURKEY RETORT PACKAGING MARKET, BY DISTRIBUTION CHANNEL, 2020-2029 (MILLION UNITS)
TABLE 213 TURKEY RETORT PACKAGING MARKET, BY END-USE, 2020-2029 (USD MILLION)
TABLE 214 TURKEY RETORT PACKAGING MARKET, BY END-USE, 2020-2029 (MILLION UNITS)
TABLE 215 TURKEY FOOD IN RETORT PACKAGING MARKET, BY END-USE, 2020-2029 (USD MILLION)
TABLE 216 TURKEY BEVERAGES IN RETORT PACKAGING MARKET, BY END-USE, 2020-2029 (USD MILLION)
TABLE 217 LUXEMBURG RETORT PACKAGING MARKET, BY PRODUCT TYPE, 2020-2029 (USD MILLION)
TABLE 218 LUXEMBURG RETORT PACKAGING MARKET, BY PRODUCT TYPE, 2020-2029 (MILLION UNITS)
TABLE 219 LUXEMBURG POUCHES IN RETORT PACKAGING MARKET, BY PRODUCT TYPE, 2020-2029 (USD MILLION)
TABLE 220 LUXEMBURG RETORT PACKAGING MARKET, BY MATERIAL, 2020-2029 (USD MILLION)
TABLE 221 LUXEMBURG RETORT PACKAGING MARKET, BY MATERIAL, 2020-2029 (MILLION UNITS)
TABLE 222 LUXEMBURG RETORT PACKAGING MARKET, BY DISTRIBUTION CHANNEL, 2020-2029 (USD MILLION)
TABLE 223 LUXEMBURG RETORT PACKAGING MARKET, BY DISTRIBUTION CHANNEL, 2020-2029 (MILLION UNITS)
TABLE 224 LUXEMBURG RETORT PACKAGING MARKET, BY END-USE, 2020-2029 (USD MILLION)
TABLE 225 LUXEMBURG RETORT PACKAGING MARKET, BY END-USE, 2020-2029 (MILLION UNITS)
TABLE 226 LUXEMBURG FOOD IN RETORT PACKAGING MARKET, BY END-USE, 2020-2029 (USD MILLION)
TABLE 227 LUXEMBURG BEVERAGES IN RETORT PACKAGING MARKET, BY END-USE, 2020-2029 (USD MILLION)
TABLE 228 REST OF EUROPE RETORT PACKAGING MARKET, BY PRODUCT TYPE, 2020-2029 (USD MILLION)
TABLE 229 REST OF EUROPE RETORT PACKAGING MARKET, BY PRODUCT TYPE, 2020-2029 (MILLION UNITS)
TABLE 230 ASIA-PACIFIC RETORT PACKAGING MARKET, BY COUNTRY, 2020-2029 (USD MILLION)
TABLE 231 ASIA-PACIFIC RETORT PACKAGING MARKET, BY COUNTRY, 2020-2029 (MILLION UNITS)
TABLE 232 ASIA-PACIFIC RETORT PACKAGING MARKET, BY PRODUCT TYPE, 2020-2029 (USD MILLION)
TABLE 233 ASIA-PACIFIC RETORT PACKAGING MARKET, BY PRODUCT TYPE, 2020-2029 (MILLION UNITS)
TABLE 234 ASIA-PACIFIC POUCHES IN RETORT PACKAGING MARKET, BY PRODUCT TYPE, 2020-2029 (USD MILLION)
TABLE 235 ASIA-PACIFIC RETORT PACKAGING MARKET, BY MATERIAL, 2020-2029 (USD MILLION)
TABLE 236 ASIA-PACIFIC RETORT PACKAGING MARKET, BY MATERIAL, 2020-2029 (MILLION UNITS)
TABLE 237 ASIA-PACIFIC RETORT PACKAGING MARKET, BY DISTRIBUTION CHANNEL, 2020-2029 (USD MILLION)
TABLE 238 ASIA-PACIFIC RETORT PACKAGING MARKET, BY DISTRIBUTION CHANNEL, 2020-2029 (MILLION UNITS)
TABLE 239 ASIA-PACIFIC RETORT PACKAGING MARKET, BY END-USE, 2020-2029 (USD MILLION)
TABLE 240 ASIA-PACIFIC RETORT PACKAGING MARKET, BY END-USE, 2020-2029 (MILLION UNITS)
TABLE 241 ASIA-PACIFIC FOOD IN RETORT PACKAGING MARKET, BY END-USE, 2020-2029 (USD MILLION)
TABLE 242 ASIA-PACIFIC BEVERAGES IN RETORT PACKAGING MARKET, BY END-USE, 2020-2029 (USD MILLION)
TABLE 243 CHINA RETORT PACKAGING MARKET, BY PRODUCT TYPE, 2020-2029 (USD MILLION)
TABLE 244 CHINA RETORT PACKAGING MARKET, BY PRODUCT TYPE, 2020-2029 (MILLION UNITS)
TABLE 245 CHINA POUCHES IN RETORT PACKAGING MARKET, BY PRODUCT TYPE, 2020-2029 (USD MILLION)
TABLE 246 CHINA RETORT PACKAGING MARKET, BY MATERIAL, 2020-2029 (USD MILLION)
TABLE 247 CHINA RETORT PACKAGING MARKET, BY MATERIAL, 2020-2029 (MILLION UNITS)
TABLE 248 CHINA RETORT PACKAGING MARKET, BY DISTRIBUTION CHANNEL, 2020-2029 (USD MILLION)
TABLE 249 CHINA RETORT PACKAGING MARKET, BY DISTRIBUTION CHANNEL, 2020-2029 (MILLION UNITS)
TABLE 250 CHINA RETORT PACKAGING MARKET, BY END-USE, 2020-2029 (USD MILLION)
TABLE 251 CHINA RETORT PACKAGING MARKET, BY END-USE, 2020-2029 (MILLION UNITS)
TABLE 252 CHINA FOOD IN RETORT PACKAGING MARKET, BY END-USE, 2020-2029 (USD MILLION)
TABLE 253 CHINA BEVERAGES IN RETORT PACKAGING MARKET, BY END-USE, 2020-2029 (USD MILLION)
TABLE 254 JAPAN RETORT PACKAGING MARKET, BY PRODUCT TYPE, 2020-2029 (USD MILLION)
TABLE 255 JAPAN RETORT PACKAGING MARKET, BY PRODUCT TYPE, 2020-2029 (MILLION UNITS)
TABLE 256 JAPAN POUCHES IN RETORT PACKAGING MARKET, BY PRODUCT TYPE, 2020-2029 (USD MILLION)
TABLE 257 JAPAN RETORT PACKAGING MARKET, BY MATERIAL, 2020-2029 (USD MILLION)
TABLE 258 JAPAN RETORT PACKAGING MARKET, BY MATERIAL, 2020-2029 (MILLION UNITS)
TABLE 259 JAPAN RETORT PACKAGING MARKET, BY DISTRIBUTION CHANNEL, 2020-2029 (USD MILLION)
TABLE 260 JAPAN RETORT PACKAGING MARKET, BY DISTRIBUTION CHANNEL, 2020-2029 (MILLION UNITS)
TABLE 261 JAPAN RETORT PACKAGING MARKET, BY END-USE, 2020-2029 (USD MILLION)
TABLE 262 JAPAN RETORT PACKAGING MARKET, BY END-USE, 2020-2029 (MILLION UNITS)
TABLE 263 JAPAN FOOD IN RETORT PACKAGING MARKET, BY END-USE, 2020-2029 (USD MILLION)
TABLE 264 JAPAN BEVERAGES IN RETORT PACKAGING MARKET, BY END-USE, 2020-2029 (USD MILLION)
TABLE 265 SOUTH KOREA RETORT PACKAGING MARKET, BY PRODUCT TYPE, 2020-2029 (USD MILLION)
TABLE 266 SOUTH KOREA RETORT PACKAGING MARKET, BY PRODUCT TYPE, 2020-2029 (MILLION UNITS)
TABLE 267 SOUTH KOREA POUCHES IN RETORT PACKAGING MARKET, BY PRODUCT TYPE, 2020-2029 (USD MILLION)
TABLE 268 SOUTH KOREA RETORT PACKAGING MARKET, BY MATERIAL, 2020-2029 (USD MILLION)
TABLE 269 SOUTH KOREA RETORT PACKAGING MARKET, BY MATERIAL, 2020-2029 (MILLION UNITS)
TABLE 270 SOUTH KOREA RETORT PACKAGING MARKET, BY DISTRIBUTION CHANNEL, 2020-2029 (USD MILLION)
TABLE 271 SOUTH KOREA RETORT PACKAGING MARKET, BY DISTRIBUTION CHANNEL, 2020-2029 (MILLION UNITS)
TABLE 272 SOUTH KOREA RETORT PACKAGING MARKET, BY END-USE, 2020-2029 (USD MILLION)
TABLE 273 SOUTH KOREA RETORT PACKAGING MARKET, BY END-USE, 2020-2029 (MILLION UNITS)
TABLE 274 SOUTH KOREA FOOD IN RETORT PACKAGING MARKET, BY END-USE, 2020-2029 (USD MILLION)
TABLE 275 SOUTH KOREA BEVERAGES IN RETORT PACKAGING MARKET, BY END-USE, 2020-2029 (USD MILLION)
TABLE 276 INDIA RETORT PACKAGING MARKET, BY PRODUCT TYPE, 2020-2029 (USD MILLION)
TABLE 277 INDIA RETORT PACKAGING MARKET, BY PRODUCT TYPE, 2020-2029 (MILLION UNITS)
TABLE 278 INDIA POUCHES IN RETORT PACKAGING MARKET, BY PRODUCT TYPE, 2020-2029 (USD MILLION)
TABLE 279 INDIA RETORT PACKAGING MARKET, BY MATERIAL, 2020-2029 (USD MILLION)
TABLE 280 INDIA RETORT PACKAGING MARKET, BY MATERIAL, 2020-2029 (MILLION UNITS)
TABLE 281 INDIA RETORT PACKAGING MARKET, BY DISTRIBUTION CHANNEL, 2020-2029 (USD MILLION)
TABLE 282 INDIA RETORT PACKAGING MARKET, BY DISTRIBUTION CHANNEL, 2020-2029 (MILLION UNITS)
TABLE 283 INDIA RETORT PACKAGING MARKET, BY END-USE, 2020-2029 (USD MILLION)
TABLE 284 INDIA RETORT PACKAGING MARKET, BY END-USE, 2020-2029 (MILLION UNITS)
TABLE 285 INDIA FOOD IN RETORT PACKAGING MARKET, BY END-USE, 2020-2029 (USD MILLION)
TABLE 286 INDIA BEVERAGES IN RETORT PACKAGING MARKET, BY END-USE, 2020-2029 (USD MILLION)
TABLE 287 AUSTRALIA & NEW ZEALAND RETORT PACKAGING MARKET, BY PRODUCT TYPE, 2020-2029 (USD MILLION)
TABLE 288 AUSTRALIA & NEW ZEALAND RETORT PACKAGING MARKET, BY PRODUCT TYPE, 2020-2029 (MILLION UNITS)
TABLE 289 AUSTRALIA & NEW ZEALAND POUCHES IN RETORT PACKAGING MARKET, BY PRODUCT TYPE, 2020-2029 (USD MILLION)
TABLE 290 AUSTRALIA & NEW ZEALAND RETORT PACKAGING MARKET, BY MATERIAL, 2020-2029 (USD MILLION)
TABLE 291 AUSTRALIA & NEW ZEALAND RETORT PACKAGING MARKET, BY MATERIAL, 2020-2029 (MILLION UNITS)
TABLE 292 AUSTRALIA & NEW ZEALAND RETORT PACKAGING MARKET, BY DISTRIBUTION CHANNEL, 2020-2029 (USD MILLION)
TABLE 293 AUSTRALIA & NEW ZEALAND RETORT PACKAGING MARKET, BY DISTRIBUTION CHANNEL, 2020-2029 (MILLION UNITS)
TABLE 294 AUSTRALIA & NEW ZEALAND RETORT PACKAGING MARKET, BY END-USE, 2020-2029 (USD MILLION)
TABLE 295 AUSTRALIA & NEW ZEALAND RETORT PACKAGING MARKET, BY END-USE, 2020-2029 (MILLION UNITS)
TABLE 296 AUSTRALIA & NEW ZEALAND FOOD IN RETORT PACKAGING MARKET, BY END-USE, 2020-2029 (USD MILLION)
TABLE 297 AUSTRALIA & NEW ZEALAND BEVERAGES IN RETORT PACKAGING MARKET, BY END-USE, 2020-2029 (USD MILLION)
TABLE 298 SINGAPORE RETORT PACKAGING MARKET, BY PRODUCT TYPE, 2020-2029 (USD MILLION)
TABLE 299 SINGAPORE RETORT PACKAGING MARKET, BY PRODUCT TYPE, 2020-2029 (MILLION UNITS)
TABLE 300 SINGAPORE POUCHES IN RETORT PACKAGING MARKET, BY PRODUCT TYPE, 2020-2029 (USD MILLION)
TABLE 301 SINGAPORE RETORT PACKAGING MARKET, BY MATERIAL, 2020-2029 (USD MILLION)
TABLE 302 SINGAPORE RETORT PACKAGING MARKET, BY MATERIAL, 2020-2029 (MILLION UNITS)
TABLE 303 SINGAPORE RETORT PACKAGING MARKET, BY DISTRIBUTION CHANNEL, 2020-2029 (USD MILLION)
TABLE 304 SINGAPORE RETORT PACKAGING MARKET, BY DISTRIBUTION CHANNEL, 2020-2029 (MILLION UNITS)
TABLE 305 SINGAPORE RETORT PACKAGING MARKET, BY END-USE, 2020-2029 (USD MILLION)
TABLE 306 SINGAPORE RETORT PACKAGING MARKET, BY END-USE, 2020-2029 (MILLION UNITS)
TABLE 307 SINGAPORE FOOD IN RETORT PACKAGING MARKET, BY END-USE, 2020-2029 (USD MILLION)
TABLE 308 SINGAPORE BEVERAGES IN RETORT PACKAGING MARKET, BY END-USE, 2020-2029 (USD MILLION)
TABLE 309 INDONESIA RETORT PACKAGING MARKET, BY PRODUCT TYPE, 2020-2029 (USD MILLION)
TABLE 310 INDONESIA RETORT PACKAGING MARKET, BY PRODUCT TYPE, 2020-2029 (MILLION UNITS)
TABLE 311 INDONESIA POUCHES IN RETORT PACKAGING MARKET, BY PRODUCT TYPE, 2020-2029 (USD MILLION)
TABLE 312 INDONESIA RETORT PACKAGING MARKET, BY MATERIAL, 2020-2029 (USD MILLION)
TABLE 313 INDONESIA RETORT PACKAGING MARKET, BY MATERIAL, 2020-2029 (MILLION UNITS)
TABLE 314 INDONESIA RETORT PACKAGING MARKET, BY DISTRIBUTION CHANNEL, 2020-2029 (USD MILLION)
TABLE 315 INDONESIA RETORT PACKAGING MARKET, BY DISTRIBUTION CHANNEL, 2020-2029 (MILLION UNITS)
TABLE 316 INDONESIA RETORT PACKAGING MARKET, BY END-USE, 2020-2029 (USD MILLION)
TABLE 317 INDONESIA RETORT PACKAGING MARKET, BY END-USE, 2020-2029 (MILLION UNITS)
TABLE 318 INDONESIA FOOD IN RETORT PACKAGING MARKET, BY END-USE, 2020-2029 (USD MILLION)
TABLE 319 INDONESIA BEVERAGES IN RETORT PACKAGING MARKET, BY END-USE, 2020-2029 (USD MILLION)
TABLE 320 THAILAND RETORT PACKAGING MARKET, BY PRODUCT TYPE, 2020-2029 (USD MILLION)
TABLE 321 THAILAND RETORT PACKAGING MARKET, BY PRODUCT TYPE, 2020-2029 (MILLION UNITS)
TABLE 322 THAILAND POUCHES IN RETORT PACKAGING MARKET, BY PRODUCT TYPE, 2020-2029 (USD MILLION)
TABLE 323 THAILAND RETORT PACKAGING MARKET, BY MATERIAL, 2020-2029 (USD MILLION)
TABLE 324 THAILAND RETORT PACKAGING MARKET, BY MATERIAL, 2020-2029 (MILLION UNITS)
TABLE 325 THAILAND RETORT PACKAGING MARKET, BY DISTRIBUTION CHANNEL, 2020-2029 (USD MILLION)
TABLE 326 THAILAND RETORT PACKAGING MARKET, BY DISTRIBUTION CHANNEL, 2020-2029 (MILLION UNITS)
TABLE 327 THAILAND RETORT PACKAGING MARKET, BY END-USE, 2020-2029 (USD MILLION)
TABLE 328 THAILAND RETORT PACKAGING MARKET, BY END-USE, 2020-2029 (MILLION UNITS)
TABLE 329 THAILAND FOOD IN RETORT PACKAGING MARKET, BY END-USE, 2020-2029 (USD MILLION)
TABLE 330 THAILAND BEVERAGES IN RETORT PACKAGING MARKET, BY END-USE, 2020-2029 (USD MILLION)
TABLE 331 MALAYSIA RETORT PACKAGING MARKET, BY PRODUCT TYPE, 2020-2029 (USD MILLION)
TABLE 332 MALAYSIA RETORT PACKAGING MARKET, BY PRODUCT TYPE, 2020-2029 (MILLION UNITS)
TABLE 333 MALAYSIA POUCHES IN RETORT PACKAGING MARKET, BY PRODUCT TYPE, 2020-2029 (USD MILLION)
TABLE 334 MALAYSIA RETORT PACKAGING MARKET, BY MATERIAL, 2020-2029 (USD MILLION)
TABLE 335 MALAYSIA RETORT PACKAGING MARKET, BY MATERIAL, 2020-2029 (MILLION UNITS)
TABLE 336 MALAYSIA RETORT PACKAGING MARKET, BY DISTRIBUTION CHANNEL, 2020-2029 (USD MILLION)
TABLE 337 MALAYSIA RETORT PACKAGING MARKET, BY DISTRIBUTION CHANNEL, 2020-2029 (MILLION UNITS)
TABLE 338 MALAYSIA RETORT PACKAGING MARKET, BY END-USE, 2020-2029 (USD MILLION)
TABLE 339 MALAYSIA RETORT PACKAGING MARKET, BY END-USE, 2020-2029 (MILLION UNITS)
TABLE 340 MALAYSIA FOOD IN RETORT PACKAGING MARKET, BY END-USE, 2020-2029 (USD MILLION)
TABLE 341 MALAYSIA BEVERAGES IN RETORT PACKAGING MARKET, BY END-USE, 2020-2029 (USD MILLION)
TABLE 342 PHILIPPINES RETORT PACKAGING MARKET, BY PRODUCT TYPE, 2020-2029 (USD MILLION)
TABLE 343 PHILIPPINES RETORT PACKAGING MARKET, BY PRODUCT TYPE, 2020-2029 (MILLION UNITS)
TABLE 344 PHILIPPINES POUCHES IN RETORT PACKAGING MARKET, BY PRODUCT TYPE, 2020-2029 (USD MILLION)
TABLE 345 PHILIPPINES RETORT PACKAGING MARKET, BY MATERIAL, 2020-2029 (USD MILLION)
TABLE 346 PHILIPPINES RETORT PACKAGING MARKET, BY MATERIAL, 2020-2029 (MILLION UNITS)
TABLE 347 PHILIPPINES RETORT PACKAGING MARKET, BY DISTRIBUTION CHANNEL, 2020-2029 (USD MILLION)
TABLE 348 PHILIPPINES RETORT PACKAGING MARKET, BY DISTRIBUTION CHANNEL, 2020-2029 (MILLION UNITS)
TABLE 349 PHILIPPINES RETORT PACKAGING MARKET, BY END-USE, 2020-2029 (USD MILLION)
TABLE 350 PHILIPPINES RETORT PACKAGING MARKET, BY END-USE, 2020-2029 (MILLION UNITS)
TABLE 351 PHILIPPINES FOOD IN RETORT PACKAGING MARKET, BY END-USE, 2020-2029 (USD MILLION)
TABLE 352 PHILIPPINES BEVERAGES IN RETORT PACKAGING MARKET, BY END-USE, 2020-2029 (USD MILLION)
TABLE 353 REST OF ASIA-PACIFIC RETORT PACKAGING MARKET, BY PRODUCT TYPE, 2020-2029 (USD MILLION)
TABLE 354 REST OF ASIA-PACIFIC RETORT PACKAGING MARKET, BY PRODUCT TYPE, 2020-2029 (MILLION UNITS)
TABLE 355 MIDDLE EAST AND AFRICA RETORT PACKAGING MARKET, BY COUNTRY, 2020-2029 (USD MILLION)
TABLE 356 MIDDLE EAST AND AFRICA RETORT PACKAGING MARKET, BY COUNTRY, 2020-2029 (MILLION UNITS)
TABLE 357 MIDDLE EAST AND AFRICA RETORT PACKAGING MARKET, BY PRODUCT TYPE, 2020-2029 (USD MILLION)
TABLE 358 MIDDLE EAST AND AFRICA RETORT PACKAGING MARKET, BY PRODUCT TYPE, 2020-2029 (MILLION UNITS)
TABLE 359 MIDDLE EAST AND AFRICA POUCHES IN RETORT PACKAGING MARKET, BY PRODUCT TYPE, 2020-2029 (USD MILLION)
TABLE 360 MIDDLE EAST AND AFRICA RETORT PACKAGING MARKET, BY MATERIAL, 2020-2029 (USD MILLION)
TABLE 361 MIDDLE EAST AND AFRICA RETORT PACKAGING MARKET, BY MATERIAL, 2020-2029 (MILLION UNITS)
TABLE 362 MIDDLE EAST AND AFRICA RETORT PACKAGING MARKET, BY DISTRIBUTION CHANNEL, 2020-2029 (USD MILLION)
TABLE 363 MIDDLE EAST AND AFRICA RETORT PACKAGING MARKET, BY DISTRIBUTION CHANNEL, 2020-2029 (MILLION UNITS)
TABLE 364 MIDDLE EAST AND AFRICA RETORT PACKAGING MARKET, BY END-USE, 2020-2029 (USD MILLION)
TABLE 365 MIDDLE EAST AND AFRICA RETORT PACKAGING MARKET, BY END-USE, 2020-2029 (MILLION UNITS)
TABLE 366 MIDDLE EAST AND AFRICA FOOD IN RETORT PACKAGING MARKET, BY END-USE, 2020-2029 (USD MILLION)
TABLE 367 MIDDLE EAST AND AFRICA BEVERAGES IN RETORT PACKAGING MARKET, BY END-USE, 2020-2029 (USD MILLION)
TABLE 368 SOUTH AFRICA RETORT PACKAGING MARKET, BY PRODUCT TYPE, 2020-2029 (USD MILLION)
TABLE 369 SOUTH AFRICA RETORT PACKAGING MARKET, BY PRODUCT TYPE, 2020-2029 (MILLION UNITS)
TABLE 370 SOUTH AFRICA POUCHES IN RETORT PACKAGING MARKET, BY PRODUCT TYPE, 2020-2029 (USD MILLION)
TABLE 371 SOUTH AFRICA RETORT PACKAGING MARKET, BY MATERIAL, 2020-2029 (USD MILLION)
TABLE 372 SOUTH AFRICA RETORT PACKAGING MARKET, BY MATERIAL, 2020-2029 (MILLION UNITS)
TABLE 373 SOUTH AFRICA RETORT PACKAGING MARKET, BY DISTRIBUTION CHANNEL, 2020-2029 (USD MILLION)
TABLE 374 SOUTH AFRICA RETORT PACKAGING MARKET, BY DISTRIBUTION CHANNEL, 2020-2029 (MILLION UNITS)
TABLE 375 SOUTH AFRICA RETORT PACKAGING MARKET, BY END-USE, 2020-2029 (USD MILLION)
TABLE 376 SOUTH AFRICA RETORT PACKAGING MARKET, BY END-USE, 2020-2029 (MILLION UNITS)
TABLE 377 SOUTH AFRICA FOOD IN RETORT PACKAGING MARKET, BY END-USE, 2020-2029 (USD MILLION)
TABLE 378 SOUTH AFRICA BEVERAGES IN RETORT PACKAGING MARKET, BY END-USE, 2020-2029 (USD MILLION)
TABLE 379 SAUDI ARABIA RETORT PACKAGING MARKET, BY PRODUCT TYPE, 2020-2029 (USD MILLION)
TABLE 380 SAUDI ARABIA RETORT PACKAGING MARKET, BY PRODUCT TYPE, 2020-2029 (MILLION UNITS)
TABLE 381 SAUDI ARABIA POUCHES IN RETORT PACKAGING MARKET, BY PRODUCT TYPE, 2020-2029 (USD MILLION)
TABLE 382 SAUDI ARABIA RETORT PACKAGING MARKET, BY MATERIAL, 2020-2029 (USD MILLION)
TABLE 383 SAUDI ARABIA RETORT PACKAGING MARKET, BY MATERIAL, 2020-2029 (MILLION UNITS)
TABLE 384 SAUDI ARABIA RETORT PACKAGING MARKET, BY DISTRIBUTION CHANNEL, 2020-2029 (USD MILLION)
TABLE 385 SAUDI ARABIA RETORT PACKAGING MARKET, BY DISTRIBUTION CHANNEL, 2020-2029 (MILLION UNITS)
TABLE 386 SAUDI ARABIA RETORT PACKAGING MARKET, BY END-USE, 2020-2029 (USD MILLION)
TABLE 387 SAUDI ARABIA RETORT PACKAGING MARKET, BY END-USE, 2020-2029 (MILLION UNITS)
TABLE 388 SAUDI ARABIA FOOD IN RETORT PACKAGING MARKET, BY END-USE, 2020-2029 (USD MILLION)
TABLE 389 SAUDI ARABIA BEVERAGES IN RETORT PACKAGING MARKET, BY END-USE, 2020-2029 (USD MILLION)
TABLE 390 EGYPT RETORT PACKAGING MARKET, BY PRODUCT TYPE, 2020-2029 (USD MILLION)
TABLE 391 EGYPT RETORT PACKAGING MARKET, BY PRODUCT TYPE, 2020-2029 (MILLION UNITS)
TABLE 392 EGYPT POUCHES IN RETORT PACKAGING MARKET, BY PRODUCT TYPE, 2020-2029 (USD MILLION)
TABLE 393 EGYPT RETORT PACKAGING MARKET, BY MATERIAL, 2020-2029 (USD MILLION)
TABLE 394 EGYPT RETORT PACKAGING MARKET, BY MATERIAL, 2020-2029 (MILLION UNITS)
TABLE 395 EGYPT RETORT PACKAGING MARKET, BY DISTRIBUTION CHANNEL, 2020-2029 (USD MILLION)
TABLE 396 EGYPT RETORT PACKAGING MARKET, BY DISTRIBUTION CHANNEL, 2020-2029 (MILLION UNITS)
TABLE 397 EGYPT RETORT PACKAGING MARKET, BY END-USE, 2020-2029 (USD MILLION)
TABLE 398 EGYPT RETORT PACKAGING MARKET, BY END-USE, 2020-2029 (MILLION UNITS)
TABLE 399 EGYPT FOOD IN RETORT PACKAGING MARKET, BY END-USE, 2020-2029 (USD MILLION)
TABLE 400 EGYPT BEVERAGES IN RETORT PACKAGING MARKET, BY END-USE, 2020-2029 (USD MILLION)
TABLE 401 U.A.E. RETORT PACKAGING MARKET, BY PRODUCT TYPE, 2020-2029 (USD MILLION)
TABLE 402 U.A.E. RETORT PACKAGING MARKET, BY PRODUCT TYPE, 2020-2029 (MILLION UNITS)
TABLE 403 U.A.E. POUCHES IN RETORT PACKAGING MARKET, BY PRODUCT TYPE, 2020-2029 (USD MILLION)
TABLE 404 U.A.E. RETORT PACKAGING MARKET, BY MATERIAL, 2020-2029 (USD MILLION)
TABLE 405 U.A.E. RETORT PACKAGING MARKET, BY MATERIAL, 2020-2029 (MILLION UNITS)
TABLE 406 U.A.E. RETORT PACKAGING MARKET, BY DISTRIBUTION CHANNEL, 2020-2029 (USD MILLION)
TABLE 407 U.A.E. RETORT PACKAGING MARKET, BY DISTRIBUTION CHANNEL, 2020-2029 (MILLION UNITS)
TABLE 408 U.A.E. RETORT PACKAGING MARKET, BY END-USE, 2020-2029 (USD MILLION)
TABLE 409 U.A.E. RETORT PACKAGING MARKET, BY END-USE, 2020-2029 (MILLION UNITS)
TABLE 410 U.A.E. FOOD IN RETORT PACKAGING MARKET, BY END-USE, 2020-2029 (USD MILLION)
TABLE 411 U.A.E. BEVERAGES IN RETORT PACKAGING MARKET, BY END-USE, 2020-2029 (USD MILLION)
TABLE 412 ISRAEL RETORT PACKAGING MARKET, BY PRODUCT TYPE, 2020-2029 (USD MILLION)
TABLE 413 ISRAEL RETORT PACKAGING MARKET, BY PRODUCT TYPE, 2020-2029 (MILLION UNITS)
TABLE 414 ISRAEL POUCHES IN RETORT PACKAGING MARKET, BY PRODUCT TYPE, 2020-2029 (USD MILLION)
TABLE 415 ISRAEL RETORT PACKAGING MARKET, BY MATERIAL, 2020-2029 (USD MILLION)
TABLE 416 ISRAEL RETORT PACKAGING MARKET, BY MATERIAL, 2020-2029 (MILLION UNITS)
TABLE 417 ISRAEL RETORT PACKAGING MARKET, BY DISTRIBUTION CHANNEL, 2020-2029 (USD MILLION)
TABLE 418 ISRAEL RETORT PACKAGING MARKET, BY DISTRIBUTION CHANNEL, 2020-2029 (MILLION UNITS)
TABLE 419 ISRAEL RETORT PACKAGING MARKET, BY END-USE, 2020-2029 (USD MILLION)
TABLE 420 ISRAEL RETORT PACKAGING MARKET, BY END-USE, 2020-2029 (MILLION UNITS)
TABLE 421 ISRAEL FOOD IN RETORT PACKAGING MARKET, BY END-USE, 2020-2029 (USD MILLION)
TABLE 422 ISRAEL BEVERAGES IN RETORT PACKAGING MARKET, BY END-USE, 2020-2029 (USD MILLION)
TABLE 423 REST OF MIDDLE EAST AND AFRICA RETORT PACKAGING MARKET, BY PRODUCT TYPE, 2020-2029 (USD MILLION)
TABLE 424 REST OF MIDDLE EAST AND AFRICA RETORT PACKAGING MARKET, BY PRODUCT TYPE, 2020-2029 (MILLION UNITS)
TABLE 425 SOUTH AMERICA RETORT PACKAGING MARKET, BY COUNTRY, 2020-2029 (USD MILLION)
TABLE 426 SOUTH AMERICA RETORT PACKAGING MARKET, BY COUNTRY, 2020-2029 (MILLION UNITS)
TABLE 427 SOUTH AMERICA RETORT PACKAGING MARKET, BY PRODUCT TYPE, 2020-2029 (USD MILLION)
TABLE 428 SOUTH AMERICA RETORT PACKAGING MARKET, BY PRODUCT TYPE, 2020-2029 (MILLION UNITS)
TABLE 429 SOUTH AMERICA POUCHES IN RETORT PACKAGING MARKET, BY PRODUCT TYPE, 2020-2029 (USD MILLION)
TABLE 430 SOUTH AMERICA RETORT PACKAGING MARKET, BY MATERIAL, 2020-2029 (USD MILLION)
TABLE 431 SOUTH AMERICA RETORT PACKAGING MARKET, BY MATERIAL, 2020-2029 (MILLION UNITS)
TABLE 432 SOUTH AMERICA RETORT PACKAGING MARKET, BY DISTRIBUTION CHANNEL, 2020-2029 (USD MILLION)
TABLE 433 SOUTH AMERICA RETORT PACKAGING MARKET, BY DISTRIBUTION CHANNEL, 2020-2029 (MILLION UNITS)
TABLE 434 SOUTH AMERICA RETORT PACKAGING MARKET, BY END-USE, 2020-2029 (USD MILLION)
TABLE 435 SOUTH AMERICA RETORT PACKAGING MARKET, BY END-USE, 2020-2029 (MILLION UNITS)
TABLE 436 SOUTH AMERICA FOOD IN RETORT PACKAGING MARKET, BY END-USE, 2020-2029 (USD MILLION)
TABLE 437 SOUTH AMERICA BEVERAGES IN RETORT PACKAGING MARKET, BY END-USE, 2020-2029 (USD MILLION)
TABLE 438 BRAZIL RETORT PACKAGING MARKET, BY PRODUCT TYPE, 2020-2029 (USD MILLION)
TABLE 439 BRAZIL RETORT PACKAGING MARKET, BY PRODUCT TYPE, 2020-2029 (MILLION UNITS)
TABLE 440 BRAZIL POUCHES IN RETORT PACKAGING MARKET, BY PRODUCT TYPE, 2020-2029 (USD MILLION)
TABLE 441 BRAZIL RETORT PACKAGING MARKET, BY MATERIAL, 2020-2029 (USD MILLION)
TABLE 442 BRAZIL RETORT PACKAGING MARKET, BY MATERIAL, 2020-2029 (MILLION UNITS)
TABLE 443 BRAZIL RETORT PACKAGING MARKET, BY DISTRIBUTION CHANNEL, 2020-2029 (USD MILLION)
TABLE 444 BRAZIL RETORT PACKAGING MARKET, BY DISTRIBUTION CHANNEL, 2020-2029 (MILLION UNITS)
TABLE 445 BRAZIL RETORT PACKAGING MARKET, BY END-USE, 2020-2029 (USD MILLION)
TABLE 446 BRAZIL RETORT PACKAGING MARKET, BY END-USE, 2020-2029 (MILLION UNITS)
TABLE 447 BRAZIL FOOD IN RETORT PACKAGING MARKET, BY END-USE, 2020-2029 (USD MILLION)
TABLE 448 BRAZIL BEVERAGES IN RETORT PACKAGING MARKET, BY END-USE, 2020-2029 (USD MILLION)
TABLE 449 ARGENTINA RETORT PACKAGING MARKET, BY PRODUCT TYPE, 2020-2029 (USD MILLION)
TABLE 450 ARGENTINA RETORT PACKAGING MARKET, BY PRODUCT TYPE, 2020-2029 (MILLION UNITS)
TABLE 451 ARGENTINA POUCHES IN RETORT PACKAGING MARKET, BY PRODUCT TYPE, 2020-2029 (USD MILLION)
TABLE 452 ARGENTINA RETORT PACKAGING MARKET, BY MATERIAL, 2020-2029 (USD MILLION)
TABLE 453 ARGENTINA RETORT PACKAGING MARKET, BY MATERIAL, 2020-2029 (MILLION UNITS)
TABLE 454 ARGENTINA RETORT PACKAGING MARKET, BY DISTRIBUTION CHANNEL, 2020-2029 (USD MILLION)
TABLE 455 ARGENTINA RETORT PACKAGING MARKET, BY DISTRIBUTION CHANNEL, 2020-2029 (MILLION UNITS)
TABLE 456 ARGENTINA RETORT PACKAGING MARKET, BY END-USE, 2020-2029 (USD MILLION)
TABLE 457 ARGENTINA RETORT PACKAGING MARKET, BY END-USE, 2020-2029 (MILLION UNITS)
TABLE 458 ARGENTINA FOOD IN RETORT PACKAGING MARKET, BY END-USE, 2020-2029 (USD MILLION)
TABLE 459 ARGENTINA BEVERAGES IN RETORT PACKAGING MARKET, BY END-USE, 2020-2029 (USD MILLION)
TABLE 460 REST OF SOUTH AMERICA RETORT PACKAGING MARKET, BY PRODUCT TYPE, 2020-2029 (USD MILLION)
TABLE 461 REST OF SOUTH AMERICA RETORT PACKAGING MARKET, BY PRODUCT TYPE, 2020-2029 (MILLION UNITS)
Lista de figuras
FIGURE 1 GLOBAL RETORT PACKAGING MARKET: SEGMENTATION
FIGURE 2 GLOBAL RETORT PACKAGING MARKET: DATA TRIANGULATION
FIGURE 3 GLOBAL RETORT PACKAGING MARKET: DROC ANALYSIS
FIGURE 4 GLOBAL RETORT PACKAGING MARKET: GLOBAL VS REGIONAL MARKET ANALYSIS
FIGURE 5 GLOBAL RETORT PACKAGING MARKET: COMPANY RESEARCH ANALYSIS
FIGURE 6 GLOBAL RETORT PACKAGING MARKET: INTERVIEW DEMOGRAPHICS
FIGURE 7 GLOBAL RETORT PACKAGING MARKET: DBMR MARKET POSITION GRID
FIGURE 8 GLOBAL RETORT PACKAGING MARKET: VENDOR SHARE ANALYSIS
FIGURE 9 GLOBAL RETORT PACKAGING MARKET: END-USE COVERAGE GRID
FIGURE 10 GLOBAL RETORT PACKAGING MARKET: SEGMENTATION
FIGURE 11 INCREASING DEMAND AMONG CONSUMERS FOR PRESERVATIVE-FREE PRODUCTS IS EXPECTED TO DRIVE THE GLOBAL RETORT PACKAGING MARKET IN THE FORECAST PERIOD OF 2022 TO 2029
FIGURE 12 POUCHES SEGMENT IS EXPECTED TO ACCOUNT FOR THE LARGEST SHARE OF THE GLOBAL RETORT PACKAGING MARKET IN 2022 & 2029
FIGURE 13 NORTH AMERICA IS EXPECTED TO DOMINATE AND ASIA-PACIFIC IS THE FASTEST-GROWING REGION IN THE GLOBAL RETORT PACKAGING MARKET IN THE FORECAST PERIOD OF 2022 TO 2029
FIGURE 14 ASIA-PACIFIC IS THE FASTEST GROWING MARKET FOR RETORT PACKAGING MANUFACTURERS IN THE FORECAST PERIOD OF 2022 TO 2029
FIGURE 15 DRIVERS, RESTRAINTS, OPPORTUNITIES AND CHALLENGE OF GLOBAL RETROT PACKAGING MARKET
FIGURE 16 THE BELOW PIE CHART SHOWS THE RESULT OF FOODBORNE OUTBREAKS IN 2018
FIGURE 17 GLOBAL RETORT PACKAGING MARKET: BY PRODUCT TYPE, 2021
FIGURE 18 GLOBAL RETORT PACKAGING MARKET: BY MATERIAL, 2021
FIGURE 19 GLOBAL RETORT PACKAGING MARKET: BY DISTRIBUTION CHANNEL, 2021
FIGURE 20 GLOBAL RETORT PACKAGING MARKET: BY END-USE, 2021
FIGURE 21 GLOBAL RETORT PACKAGING MARKET: SNAPSHOT (2021)
FIGURE 22 GLOBAL RETORT PACKAGING MARKET: BY REGION (2021)
FIGURE 23 GLOBAL RETORT PACKAGING MARKET: BY REGION (2022 & 2029)
FIGURE 24 GLOBAL RETORT PACKAGING MARKET: BY REGION (2021 & 2029)
FIGURE 25 GLOBAL RETORT PACKAGING MARKET: BY PRODUCT TYPE (2022-2029)
FIGURE 26 NORTH AMERICA RETORT PACKAGING MARKET: SNAPSHOT (2021)
FIGURE 27 NORTH AMERICA RETORT PACKAGING MARKET: BY COUNTRY (2021)
FIGURE 28 NORTH AMERICA RETORT PACKAGING MARKET: BY COUNTRY (2022 & 2029)
FIGURE 29 NORTH AMERICA RETORT PACKAGING MARKET: BY COUNTRY (2021 & 2029)
FIGURE 30 NORTH AMERICA RETORT PACKAGING MARKET: BY PRODUCT TYPE (2022 & 2029)
FIGURE 31 EUROPE RETORT PACKAGING MARKET: SNAPSHOT (2021)
FIGURE 32 EUROPE RETORT PACKAGING MARKET: BY COUNTRY (2021)
FIGURE 33 EUROPE RETORT PACKAGING MARKET: BY COUNTRY (2022 & 2029)
FIGURE 34 EUROPE RETORT PACKAGING MARKET: BY COUNTRY (2021 & 2029)
FIGURE 35 EUROPE RETORT PACKAGING MARKET: BY PRODUCT TYPE (2022 & 2029)
FIGURE 36 ASIA-PACIFIC RETORT PACKAGING MARKET: SNAPSHOT (2021)
FIGURE 37 ASIA-PACIFIC RETORT PACKAGING MARKET: BY COUNTRY (2021)
FIGURE 38 ASIA-PACIFIC RETORT PACKAGING MARKET: BY COUNTRY (2022 & 2029)
FIGURE 39 ASIA-PACIFIC RETORT PACKAGING MARKET: BY COUNTRY (2021 & 2029)
FIGURE 40 ASIA-PACIFIC RETORT PACKAGING MARKET: BY PRODUCT TYPE (2022 & 2029)
FIGURE 41 MIDDLE EAST AND AFRICA RETORT PACKAGING MARKET: SNAPSHOT (2021)
FIGURE 42 MIDDLE EAST AND AFRICA RETORT PACKAGING MARKET: BY COUNTRY (2021)
FIGURE 43 MIDDLE EAST AND AFRICA RETORT PACKAGING MARKET: BY COUNTRY (2022 & 2029)
FIGURE 44 MIDDLE EAST AND AFRICA RETORT PACKAGING MARKET: BY COUNTRY (2021 & 2029)
FIGURE 45 MIDDLE EAST AND AFRICA RETORT PACKAGING MARKET: BY PRODUCT TYPE (2022 & 2029)
FIGURE 46 SOUTH AMERICA RETORT PACKAGING MARKET: SNAPSHOT (2021)
FIGURE 47 SOUTH AMERICA RETORT PACKAGING MARKET: BY COUNTRY (2021)
FIGURE 48 SOUTH AMERICA RETORT PACKAGING MARKET: BY COUNTRY (2022 & 2029)
FIGURE 49 SOUTH AMERICA RETORT PACKAGING MARKET: BY COUNTRY (2021 & 2029)
FIGURE 50 SOUTH AMERICA RETORT PACKAGING MARKET: BY PRODUCT TYPE (2022 & 2029)
FIGURE 51 GLOBAL RETORT PACKAGING MARKET: COMPANY SHARE 2021 (%)
FIGURE 52 NORTH AMERICA RETORT PACKAGING MARKET: COMPANY SHARE 2021 (%)
FIGURE 53 EUROPE RETORT PACKAGING MARKET: COMPANY SHARE 2021 (%)
FIGURE 54 ASIA-PACIFIC RETORT PACKAGING MARKET: COMPANY SHARE 2021 (%)
Metodología de investigación
La recopilación de datos y el análisis del año base se realizan utilizando módulos de recopilación de datos con muestras de gran tamaño. La etapa incluye la obtención de información de mercado o datos relacionados a través de varias fuentes y estrategias. Incluye el examen y la planificación de todos los datos adquiridos del pasado con antelación. Asimismo, abarca el examen de las inconsistencias de información observadas en diferentes fuentes de información. Los datos de mercado se analizan y estiman utilizando modelos estadísticos y coherentes de mercado. Además, el análisis de la participación de mercado y el análisis de tendencias clave son los principales factores de éxito en el informe de mercado. Para obtener más información, solicite una llamada de un analista o envíe su consulta.
La metodología de investigación clave utilizada por el equipo de investigación de DBMR es la triangulación de datos, que implica la extracción de datos, el análisis del impacto de las variables de datos en el mercado y la validación primaria (experto en la industria). Los modelos de datos incluyen cuadrícula de posicionamiento de proveedores, análisis de línea de tiempo de mercado, descripción general y guía del mercado, cuadrícula de posicionamiento de la empresa, análisis de patentes, análisis de precios, análisis de participación de mercado de la empresa, estándares de medición, análisis global versus regional y de participación de proveedores. Para obtener más información sobre la metodología de investigación, envíe una consulta para hablar con nuestros expertos de la industria.
Personalización disponible
Data Bridge Market Research es líder en investigación formativa avanzada. Nos enorgullecemos de brindar servicios a nuestros clientes existentes y nuevos con datos y análisis que coinciden y se adaptan a sus objetivos. El informe se puede personalizar para incluir análisis de tendencias de precios de marcas objetivo, comprensión del mercado de países adicionales (solicite la lista de países), datos de resultados de ensayos clínicos, revisión de literatura, análisis de mercado renovado y base de productos. El análisis de mercado de competidores objetivo se puede analizar desde análisis basados en tecnología hasta estrategias de cartera de mercado. Podemos agregar tantos competidores sobre los que necesite datos en el formato y estilo de datos que esté buscando. Nuestro equipo de analistas también puede proporcionarle datos en archivos de Excel sin procesar, tablas dinámicas (libro de datos) o puede ayudarlo a crear presentaciones a partir de los conjuntos de datos disponibles en el informe.

