Image

Mercado global de mantenimiento predictivo: tendencias de la industria y pronóstico para 2029

TIC

Image

Mercado global de mantenimiento predictivo: tendencias de la industria y pronóstico para 2029

  • TIC
  • Próximo informe
  • junio de 2022
  • Global
  • 350 páginas
  • Número de mesas: 220
  • Número de figuras: 60

Mercado global de mantenimiento predictivo: tendencias de la industria y pronóstico para 2029

Tamaño del mercado en miles de millones de dólares

CAGR: % Diagram

Diagram Período de pronóstico 2021-2029
Diagram Tamaño del mercado (año base) 3.840 millones de dólares
Diagram Tamaño del mercado (año previsto) 36,01 mil millones de dólares
Diagram CAGR %

Mercado global de mantenimiento predictivo, por componentes (solución, servicios), modo de implementación (nube, local), tamaño de la organización (grandes empresas, pequeñas y medianas empresas), vertical (fabricación, energía y servicios públicos, transporte, gobierno, atención médica) , Aeroespacial y Defensa, Otros), Partes interesadas (MRO, OEM/ODM, Integradores de tecnología): tendencias de la industria y pronóstico hasta 2029

Predictive Maintenance Market

Análisis y tamaño del mercado

El mayor uso de tecnologías nuevas y emergentes para obtener información valiosa sobre la toma de decisiones ha contribuido al crecimiento de la industria. Varios usuarios finales verticales necesitan cada vez más reducción de costos y tiempo de inactividad, lo que ha estimulado el crecimiento del mercado.

Data Bridge Market Research analiza que el mantenimiento predictivo Se espera que el valor de mercado, que fue de 3.840 millones de dólares en 2021, alcance el valor de 36.010 millones de dólares en 2029, con una tasa compuesta anual del 32,30% durante el período previsto 2022-2029. El mantenimiento predictivo El informe de mercado también cubre en profundidad el análisis de precios, el análisis de patentes y los avances tecnológicos.

Definición de mercado

El sistema de software de mantenimiento predictivo se emplea para controlar el rendimiento y el estado de cualquier instrumento o máquina mientras está en funcionamiento. El sistema de software observa las técnicas avanzadas de victimización de la instrumentación que permiten que el mantenimiento de la maquinaria sea regular antes de que ocurra cualquier falla. El sistema de software de mantenimiento de pronóstico ha encontrado su aplicación en diversos campos, como encontrar desequilibrios de energía trifásicos debido a distorsión armónica, picos distintivos de fenómenos eléctricos en motores y calentamiento debido a cojinetes peligrosos.

Alcance del informe y segmentación del mercado

Métrica de informe

Detalles

Período de pronóstico

2022 a 2029

Año base

2021

Años históricos

2020 (Personalizable para 2019 - 2014)

Unidades Cuantitativas

Ingresos en miles de millones de dólares, volúmenes en unidades, precios en dólares

Segmentos cubiertos

Componentes (solución, servicios), modo de implementación (nube, local), tamaño de la organización (grandes empresas, pequeñas y medianas empresas), vertical (fabricación, energía y servicios públicos, transporte, gobierno, atención médica, aeroespacial y defensa, otros ) Partes interesadas (MRO, OEM/ODM, integradores de tecnología)

Países cubiertos

Estados Unidos, Canadá y México en Norteamérica, Alemania, Francia, Reino Unido, Países Bajos, Suiza, Bélgica, Rusia, Italia, España, Turquía, Resto de Europa en Europa, China, Japón, India, Corea del Sur, Singapur, Malasia, Australia, Tailandia, Indonesia, Filipinas, Resto de Asia-Pacífico (APAC) en Asia-Pacífico (APAC), Arabia Saudita, Emiratos Árabes Unidos, Sudáfrica, Egipto, Israel, Resto de Medio Oriente y África (MEA) como parte de Medio Oriente y África (MEA), Brasil, Argentina y Resto de Sudamérica como parte de Sudamérica.

Actores del mercado cubiertos


Microsoft (EE. UU.), IBM (EE. UU.), SAP (Alemania), SAS Institute Inc. (EE. UU.), Software AG (Alemania), TIBCO Software Inc. (EE. UU.), Hewlett Packard Enterprise Development LP (EE. UU.), Altair Engineering Inc. (EE.UU.),Splunk Inc. (EE.UU.),Oracle (EE.UU.),Google (EE.UU.),Amazon Web Services, Inc. (EE.UU.),General Electric (EE.UU.),Schneider Electric (Francia),Hitachi, Ltd. (Japón) ,PTC (EE.UU.),RapidMiner, Inc. (EE.UU.),Operational Excellence (OPEX) Group Ltd, (Reino Unido),Dingo (Australia),Factory5 (Rusia)

Oportunidades de mercado

  • Crecimiento de la tasa de penetración de Internet de alta velocidad
  • Creciente adopción de tecnologías avanzadas por parte de industrias de pequeña escala
  • Crecientes oportunidades de investigación y desarrollo

Global Mantenimiento predictivo Dinámica del mercado

Esta sección trata de comprender los impulsores, las ventajas, las oportunidades, las restricciones y los desafíos del mercado. Todo esto se analiza en detalle a continuación:

Conductores:

  • Aumento del uso de tecnologías emergentes para obtener conocimientos valiosos

Los continuos avances en big data, comunicación máquina a máquina (M2M) e inteligencia artificial han creado nuevas posibilidades para la disquisición de información deducida de medios artificiales. El sesgo de IoT induce una enorme cantidad de datos de diversas fuentes, como detectores, cámaras y otros sesgos conectados. Los datos, aún así, no dan ningún valor por sí mismos a menos que alguien los convierta en información contextual viable. Las formas de visualización de datos y big data permiten a los drogadictos obtener una nueva percepción a través del procesamiento por lotes y el análisis fuera de línea. El análisis de datos y la toma de decisiones en tiempo real se realizan frecuentemente de forma manual; pero para que sea escalable, es preferible que se haga automáticamente. La parte principal de la tecnología de IA es sondear enormes volúmenes de datos producidos por diversos factores del ecosistema de IoT y transfigurar los datos en perceptividad significativa. Las empresas están integrando la IA en sus modelos lógicos predefinidos para automatizar el proceso de interpretación de datos y obtener percepción en tiempo real de los datos generados a partir de estos sesgos de IoT. La IA proporciona a las empresas estructuras y herramientas para analizar datos en tiempo real y decidir múltiples casos de uso para IoT.

  • Mayor número de industrias a nivel mundial para inducir una mayor demanda y oferta en las naciones emergentes

El creciente número de pequeñas y medianas empresas en todo el mundo es uno de los principales factores que fomentan el crecimiento del mercado. En otras palabras, un mayor número de industrias de banca, servicios financieros y seguros (BFSI), gobierno y sector público, atención médica y ciencias de la vida, manufactura, venta minorista y comercio electrónico, telecomunicaciones y TI, está influyendo directamente en la tasa de crecimiento del mercado.

Oportunidades:

  • Monitoreo de condiciones en tiempo real para ayudar a tomar acciones inmediatas

La operación avanzada de activos es cada vez más demandada en casi todas las perpendiculares. Los proveedores de resultados equipados con IA y ML pueden recopilar y convertir la gran cantidad de datos relacionados con el cliente en perceptividad significativa, a medida que IoT genera una enorme cantidad de datos a partir de sesgos conectados. La IA también se puede integrar con el sesgo de IoT para optimizar varios aspectos de la prestación de servicios, similares a la conservación profética y la evaluación de la calidad, sin la necesidad de ninguna intervención mortal. Los resultados de IoT basados ​​en IA ya se han adoptado en diversas iniciativas, y esto solo crecerá a medida que la tecnología madure. Los continuos avances en big data y la comunicación M2M permiten la monitorización del estado en tiempo real. Las entradas en tiempo real de detectores, selectores y otros parámetros de control no solo pronosticarían fallas embrionarias de activos sino que también ayudarían a las empresas a cubrir en tiempo real y tomar medidas inmediatas.

Restricciones/desafíos:

  • Falta de mano de obra calificada

Se necesitan trabajadores capacitados para manejar los últimos sistemas de software para implementar tecnologías y conjuntos de habilidades de IoT basados ​​en IA. Por lo tanto, es necesario que los trabajadores reciban capacitación sobre cómo operar sistemas nuevos y mejorados. Además, la diligencia es dinámica hacia la adopción de nuevas tecnologías; Aún así, se enfrentan a un déficit de trabajadores completos y de plantilla en gran medida profesional. A medida que la mayoría de los comerciantes globales están organizando sistemas de conservación proféticos, aumenta la demanda de un fondo ampliamente declarado. Las empresas necesitan adquirir entusiasmo en áreas similares a la seguridad cibernética, redes y operaciones. Además, buscan utilizar datos de IoT para pronosticar problemas, prevenir fallas, optimizar operaciones, desarrollar nuevos productos y proporcionar facultades de análisis avanzado, que incluyen IA y ML. Estas tecnologías desempeñarían un papel fundamental en la reducción general de los costos funcionales. Además, con las empresas integrando la IA en la IoT, habría una necesidad creciente de brigadas críticas de datos familiarizadas con la inteligencia funcional para manejar enormes cantidades de datos generados a partir del sesgo de la IoT.

  • Requisito frecuente de mantenimiento y actualización para mantener los sistemas actualizados.

Las empresas están adoptando resultados de IoT basados ​​en IA para una conservación profética y una mejor experiencia del cliente. Los comercializadores en la solicitud deben desarrollar sistemas de conservación proféticos considerando dos factores importantes, la conservación y actualización del videlicet. Un sistema de IoT basado en IA debe optimizarse y mantenerse de acuerdo con las condiciones comerciales cambiantes para aplicar actualizaciones tecnológicas. El software también debe actualizarse a medida que se añaden nuevos factores. El nuevo sistema debe integrarse con el existente, así como con el nuevo. Con un aumento en el número de sistemas, el costo de conservación también aumenta. Mantener y actualizar los sistemas de IoT basados ​​en IA será una tarea agotadora para las empresas que ofrecen resultados sin interrupción.

Este mantenimiento predictivo El informe de mercado proporciona detalles de nuevos desarrollos recientes, regulaciones comerciales, análisis de importación y exportación, análisis de producción, optimización de la cadena de valor, participación de mercado, impacto de los actores del mercado nacional y localizado, analiza oportunidades en términos de bolsillos de ingresos emergentes, cambios en las regulaciones del mercado, estrategias. análisis de crecimiento del mercado, tamaño del mercado, crecimientos del mercado de categorías, nichos de aplicación y dominio, aprobaciones de productos, lanzamientos de productos, expansiones geográficas, innovaciones tecnológicas en el mercado. Para obtener más información sobre el mantenimiento predictivo póngase en contacto con el mercado Data Bridge Market Research para obtener un resumen del analista, nuestro equipo lo ayudará a tomar una decisión de mercado informada para lograr el crecimiento del mercado.

Impacto de COVID-19 en Mantenimiento predictivo Mercado

COVID – 19 ha cambiado enciclopédicamente la dinámica de las operaciones comerciales. Aunque el brote de COVID-19 ha arrojado luz sobre los pecados en los modelos de negocio en todos los sectores verticales, ha ofrecido varias oportunidades para digitalizar y expandir sus negocios en todas las regiones a medida que ha aumentado la renuncia y la integración de tecnologías similares como IA, análisis, IoT y blockchain. el período de bloqueo. Los sectores minorista y manufacturero enfrentaron una caída significativa en el desempeño comercial durante la primera y segunda excavación de 2020. Aun así, con la escasez de vacunas y el control considerable logrado sobre la epidemia, se anticipa que estos sectores serán testigos de un aumento de las inversiones durante el período de reparto como profético. Los resultados de conservación aumentan en elevación en diferentes funciones comerciales.

Desarrollos recientes

  • En julio de 2021, Schneider Electric lanzó EcoStruxure ™ TriconexTM Safety View, el primer software de operación de alarma y derivación certificado en seguridad binaria y ciberseguridad de assiduity que permite a los conductores ver tanto el estado de derivación que afecta la posición de reducción de amenazas en el lugar, como como las advertencias críticas necesarias para operar la fábrica de manera segura cuando los obstáculos son altos.
  • En mayo de 2021, SAS Institute lanzó su plataforma SAS Viya para respaldar la base para el éxito lógico y de datos mediante la incorporación de nuevos resultados de operaciones de datos en su importante plataforma SASViya nativa de Pall.

Global Mantenimiento predictivo Alcance del mercado

El mercado de mantenimiento predictivo está segmentado según el componente, el modo de implementación, el tamaño de la organización, la vertical y las partes interesadas. El crecimiento entre estos segmentos lo ayudará a analizar los segmentos de escaso crecimiento en las industrias y brindará a los usuarios una valiosa descripción general del mercado e información sobre el mercado para ayudarlos a tomar decisiones estratégicas para identificar las aplicaciones principales del mercado.

Componente:

  • Servicio
    • Servicios gestionados
    • Servicios profesionales
      • Integración de sistema
      • Soporte y Mantenimiento
      • Consultante

Integración de sistema

  • Soporte y Mantenimiento
  • Consultante

Modo de implementación

 Tamaño de la organización

  • Grandes Empresas
  • Pequeñas y Medianas Empresas (PYMES)

Vertical

  • Gobierno y Defensa
  • Fabricación
  • Energía y servicios Públicos
  • Transporte y Logística
  • Salud y ciencias biológicas

Interesado

  • MRO
  • OEM/ODM
  • Integradores de tecnología

Mantenimiento predictivo Análisis/perspectivas regionales del mercado

El mantenimiento predictivo Se analiza el mercado y se proporcionan conocimientos y tendencias sobre el tamaño del mercado por país, componente, modo de implementación, tamaño de la organización, vertical y parte interesada, como se mencionó anteriormente.

Los países cubiertos por el mantenimiento predictivo El informe de mercado son EE. UU., Canadá y México en América del Norte, Alemania, Francia, Reino Unido, Países Bajos, Suiza, Bélgica, Rusia, Italia, España, Turquía, Resto de Europa en Europa, China, Japón, India, Corea del Sur, Singapur, Malasia. , Australia, Tailandia, Indonesia, Filipinas, Resto de Asia-Pacífico (APAC) en Asia-Pacífico (APAC), Arabia Saudita, Emiratos Árabes Unidos, Sudáfrica, Egipto, Israel, Resto de Medio Oriente y África (MEA) como parte de Medio Oriente y África (MEA), Brasil, Argentina y Resto de Sudamérica como parte de Sudamérica.

Se prevé que América del Norte posea la cuota de mercado más importante dentro del mercado de mantenimiento de pronóstico. Los factores clave que afirman la expansión del mercado de mantenimiento de pronóstico en América del Norte abarcan los crecientes avances tecnológicos dentro de la región. Se prevé que la creciente gama de actores de mantenimiento de pronóstico en todas las regiones impulse más el crecimiento del mercado. Sin embargo, Asia Pacífico mostrará un aumento constante en la adopción del mantenimiento predictivo debido a las economías emergentes, el avance tecnológico y la necesidad de adoptar las últimas innovaciones tecnológicas para lograr una producción óptima mediante el mantenimiento adecuado de los activos.

La sección de países del informe también proporciona factores que impactan el mercado individual y cambios en la regulación del mercado que impactan las tendencias actuales y futuras del mercado. Puntos de datos como el análisis de la cadena de valor ascendente y descendente, las tendencias técnicas y el análisis de las cinco fuerzas de Porter y los estudios de casos son algunos de los indicadores utilizados para pronosticar el escenario del mercado para países individuales. Además, se consideran la presencia y disponibilidad de marcas globales y los desafíos que enfrentan debido a la competencia grande o escasa de marcas locales y nacionales, el impacto de los aranceles internos y las rutas comerciales, al tiempo que se proporciona un análisis de pronóstico de los datos del país.

Panorama competitivo y Mantenimiento predictivo Análisis de cuota de mercado

El mantenimiento predictivo El panorama competitivo del mercado proporciona detalles por competidor. Los detalles incluidos son descripción general de la empresa, finanzas de la empresa, ingresos generados, potencial de mercado, inversión en investigación y desarrollo, nuevas iniciativas de mercado, presencia global, sitios e instalaciones de producción, capacidades de producción, fortalezas y debilidades de la empresa, lanzamiento de producto, ancho y amplitud del producto, aplicación. dominio. Los puntos de datos anteriores proporcionados solo están relacionados con el enfoque de las empresas relacionado con el mantenimiento predictivo. mercado.

Algunos de los principales actores que operan en el mantenimiento predictivo. mercado son:

  • Microsoft (EE. UU.)
  • IBM (EE. UU.)
  • SAP (Alemania)
  • SAS Institute Inc. (EE. UU.)
  • Software AG (Alemania)
  • TIBCO Software Inc. (EE. UU.)
  • Hewlett Packard Enterprise Development LP (EE. UU.)
  • Altair Engineering Inc. (EE. UU.)
  • Splunk Inc. (EE. UU.)
  • Oráculo (Estados Unidos)
  • Google (Estados Unidos)
  • Amazon Web Services, Inc. (EE. UU.)
  • General Electric (EE. UU.)
  • Schneider Electric (Francia)
  • Hitachi, Ltd. (Japón)
  • PTC (EE. UU.)
  • RapidMiner, Inc. (EE. UU.)
  • Excelencia Operacional (OPEX) Group Ltd, (Reino Unido)
  • Dingo (Australia)
  • Fábrica5 (Rusia)


SKU-

LISTA DE TABLAS

TABLA 1 MERCADO GLOBAL DE MANTENIMIENTO PREDICTIVO, POR COMPONENTE, 2018-2027 (MILLONES DE USD)

TABLA 2 SOLUCIÓN GLOBAL EN EL MERCADO DE MANTENIMIENTO PREDICTIVO, POR REGIÓN, 2018-2027 (MILLONES DE USD)

TABLA 3 SERVICIOS GLOBALES EN EL MERCADO DE MANTENIMIENTO PREDICTIVO, POR REGIÓN, 2018-2027, (MILLONES DE USD)

TABLA 4 MERCADO GLOBAL DE MANTENIMIENTO PREDICTIVO, POR MODO DE IMPLEMENTACIÓN, 2018-2027 (MILLONES DE USD)

TABLA 5 MERCADO MUNDIAL DE MANTENIMIENTO PREDICTIVO EN LAS INSTALACIONES, POR REGIÓN, 2018-2027, (MILLONES DE USD)

TABLA 6 NUBE GLOBAL EN EL MERCADO DE MANTENIMIENTO PREDICTIVO, POR REGIÓN, 2018-2027, (MILLONES DE USD)

TABLA 7 MERCADO MUNDIAL DE MANTENIMIENTO PREDICTIVO, POR TAMAÑO DE ORGANIZACIÓN, 2018-2027 (MILLONES DE USD)

TABLA 8 GRAN ORGANIZACIÓN MUNDIAL EN EL MERCADO DE MANTENIMIENTO PREDICTIVO, POR REGIÓN, 2018-2027, (MILLONES DE USD)

TABLA 9 PEQUEÑAS Y MEDIUMORGANIZACIONES MUNDIALES EN EL MERCADO DE MANTENIMIENTO PREDICTIVO, POR REGIÓN, 2018-2027, (MILLONES DE USD)

TABLA 10 MERCADO MUNDIAL DE MANTENIMIENTO PREDICTIVO, POR VERTICAL, 2018-2027 (MILLONES DE USD)

TABLA 11 FABRICACIÓN MUNDIAL EN EL MERCADO DE MANTENIMIENTO PREDICTIVO, POR REGIÓN, 2018-2027, (MILLONES DE USD)

TABLA 12 ENERGÍA Y SERVICIOS PÚBLICOS MUNDIALES EN EL MERCADO DE MANTENIMIENTO PREDICTIVO, POR REGIÓN, 2018-2027, (MILLONES DE USD)

TABLA 13 GOBIERNO MUNDIAL EN EL MERCADO DE MANTENIMIENTO PREDICTIVO, POR REGIÓN, 2018-2027, (MILLONES DE USD)

TABLA 14 MERCADO MUNDIAL DE ATENCIÓN MÉDICA EN MANTENIMIENTO PREDICTIVO, POR REGIÓN, 2018-2027, (MILLONES DE USD)

TABLA 15 TRANSPORTE MUNDIAL EN EL MERCADO DE MANTENIMIENTO PREDICTIVO, POR REGIÓN, 2018-2027, (MILLONES DE USD)

TABLA 16 MERCADO GLOBAL AEROESPACIAL Y DEFENSA EN MANTENIMIENTO PREDICTIVO, POR REGIÓN, 2018-2027, (MILLONES DE USD)

TABLA 17 MERCADO GLOBAL DE OTROS EN MANTENIMIENTO PREDICTIVO, POR REGIÓN, 2018-2027, (MILLONES DE USD)

TABLA 18 MERCADO MUNDIAL DE MANTENIMIENTO PREDICTIVO, POR REGIÓN, 2018-2027 (MILLONES DE USD)

TABLA 19 MERCADO DE MANTENIMIENTO PREDICTIVO DE AMÉRICA DEL NORTE, POR PAÍS, 2018-2027 (MILLONES DE USD)

TABLA 20 MERCADO DE MANTENIMIENTO PREDICTIVO DE AMÉRICA DEL NORTE, POR COMPONENTE, 2018-2027 (MILLONES DE USD)

TABLA 21 SOLUCIONES DE AMÉRICA DEL NORTE EN EL MERCADO DE MANTENIMIENTO PREDICTIVO, POR TIPO, 2018-2027 (MILLONES DE USD)

TABLA 22 SERVICIOS DE AMÉRICA DEL NORTE EN EL MERCADO DE MANTENIMIENTO PREDICTIVO, POR TIPO, 2018-2027 (MILLONES DE USD)

TABLA 23 MERCADO DE MANTENIMIENTO PREDICTIVO DE AMÉRICA DEL NORTE, POR MODO DE IMPLEMENTACIÓN, 2018-2027 (MILLONES DE USD)

TABLA 24 MERCADO DE MANTENIMIENTO PREDICTIVO DE AMÉRICA DEL NORTE, POR TAMAÑO DE ORGANIZACIÓN, 2018-2027 (MILLONES DE USD)

TABLA 25 MERCADO DE MANTENIMIENTO PREDICTIVO DE AMÉRICA DEL NORTE, POR VERTICAL, 2018-2027 (MILLONES DE USD)

TABLA 26 MERCADO DE MANTENIMIENTO PREDICTIVO DE EE. UU., POR COMPONENTE, 2018-2027 (MILLONES DE USD)

TABLA 27 SOLUCIONES ESTADOUNIDENSES EN EL MERCADO DE MANTENIMIENTO PREDICTIVO, POR TIPO, 2018-2027 (MILLONES DE USD)

TABLA 28 SERVICIOS EN EL MERCADO DE MANTENIMIENTO PREDICTIVO, POR TIPO, 2018-2027 (MILLONES DE USD)

TABLA 29 MERCADO DE MANTENIMIENTO PREDICTIVO DE EE. UU., POR MODO DE IMPLEMENTACIÓN, 2018-2027 (MILLONES DE USD)

TABLA 30 MERCADO DE MANTENIMIENTO PREDICTIVO DE EE. UU., POR TAMAÑO DE ORGANIZACIÓN, 2018-2027 (MILLONES DE USD)

TABLA 31 MERCADO DE MANTENIMIENTO PREDICTIVO DE EE. UU., POR VERTICAL, 2018-2027 (MILLONES DE USD)

TABLA 32 MERCADO DE MANTENIMIENTO PREDICTIVO DE CANADÁ, POR COMPONENTE, 2018-2027 (MILLONES DE USD)

TABLA 33 SOLUCIONES DE CANADÁ EN EL MERCADO DE MANTENIMIENTO PREDICTIVO, POR TIPO, 2018-2027 (MILLONES DE USD)

TABLA 34 SERVICIOS DE CANADÁ EN EL MERCADO DE MANTENIMIENTO PREDICTIVO, POR TIPO, 2018-2027 (MILLONES DE USD)

TABLA 35 MERCADO DE MANTENIMIENTO PREDICTIVO DE CANADÁ, POR MODO DE IMPLEMENTACIÓN, 2018-2027 (MILLONES DE USD)

TABLA 36 MERCADO DE MANTENIMIENTO PREDICTIVO DE CANADÁ, POR TAMAÑO DE ORGANIZACIÓN, 2018-2027 (MILLONES DE USD)

TABLA 37 MERCADO DE MANTENIMIENTO PREDICTIVO DE CANADÁ, POR VERTICAL, 2018-2027 (MILLONES DE USD)

CUADRO 38 MERCADO DE MANTENIMIENTO PREDICTIVO EN MÉXICO, POR COMPONENTE, 2018-2027 (MILLONES DE USD)

TABLA 39 SOLUCIONES DE MÉXICO EN EL MERCADO DE MANTENIMIENTO PREDICTIVO, POR TIPO, 2018-2027 (MILLONES DE USD)

CUADRO 40 MERCADO DE SERVICIOS DE MANTENIMIENTO PREDICTIVO EN MÉXICO, POR TIPO, 2018-2027 (MILLONES DE USD)

TABLA 41 MERCADO DE MANTENIMIENTO PREDICTIVO EN MÉXICO, POR MODO DE IMPLEMENTACIÓN, 2018-2027 (MILLONES DE USD)

TABLA 42 MERCADO DE MANTENIMIENTO PREDICTIVO EN MÉXICO, POR TAMAÑO DE ORGANIZACIÓN, 2018-2027 (MILLONES DE USD)

TABLA 43 MERCADO DE MANTENIMIENTO PREDICTIVO EN MÉXICO, POR VERTICAL, 2018-2027 (MILLONES DE USD)

TABLA 44 MERCADO DE MANTENIMIENTO PREDICTIVO EN EUROPA, POR PAÍS, 2018-2027 (MILLONES DE USD)

TABLA 45 MERCADO DE MANTENIMIENTO PREDICTIVO EN EUROPA, POR COMPONENTE, 2018-2027 (MILLONES DE USD)

TABLA 46 SOLUCIONES EUROPEAS EN EL MERCADO DE MANTENIMIENTO PREDICTIVO, POR TIPO, 2018-2027 (MILLONES DE USD)

TABLA 47 SERVICIOS EUROPEOS EN EL MERCADO DE MANTENIMIENTO PREDICTIVO, POR TIPO, 2018-2027 (MILLONES DE USD)

TABLA 48 MERCADO DE MANTENIMIENTO PREDICTIVO EN EUROPA, POR MODO DE IMPLEMENTACIÓN, 2018-2027 (MILLONES DE USD)

TABLA 49 MERCADO DE MANTENIMIENTO PREDICTIVO EN EUROPA, POR TAMAÑO DE ORGANIZACIÓN, 2018-2027 (MILLONES DE USD)

TABLA 50 MERCADO DE MANTENIMIENTO PREDICTIVO EN EUROPA, POR VERTICAL, 2018-2027 (MILLONES DE USD)

TABLA 51 MERCADO DE MANTENIMIENTO PREDICTIVO DE ALEMANIA, POR COMPONENTE, 2018-2027 (MILLONES DE USD)

TABLA 52 SOLUCIONES DE ALEMANIA EN EL MERCADO DE MANTENIMIENTO PREDICTIVO, POR TIPO, 2018-2027 (MILLONES DE USD)

TABLA 53 SERVICIOS DE ALEMANIA EN EL MERCADO DE MANTENIMIENTO PREDICTIVO, POR TIPO, 2018-2027 (MILLONES DE USD)

TABLA 54 MERCADO DE MANTENIMIENTO PREDICTIVO DE ALEMANIA, POR MODO DE IMPLEMENTACIÓN, 2018-2027 (MILLONES DE USD)

TABLA 55 MERCADO DE MANTENIMIENTO PREDICTIVO DE ALEMANIA, POR TAMAÑO DE ORGANIZACIÓN, 2018-2027 (MILLONES DE USD)

TABLA 56 MERCADO DE MANTENIMIENTO PREDICTIVO DE ALEMANIA, POR VERTICAL, 2018-2027 (MILLONES DE USD)

TABLA 57 MERCADO DE MANTENIMIENTO PREDICTIVO DEL REINO UNIDO, POR COMPONENTE, 2018-2027 (MILLONES DE USD)

TABLA 58 SOLUCIONES DEL REINO UNIDO EN EL MERCADO DE MANTENIMIENTO PREDICTIVO, POR TIPO, 2018-2027 (MILLONES DE USD)

TABLA 59 SERVICIOS DEL REINO UNIDO EN EL MERCADO DE MANTENIMIENTO PREDICTIVO, POR TIPO, 2018-2027 (MILLONES DE USD)

TABLA 60 MERCADO DE MANTENIMIENTO PREDICTIVO DEL REINO UNIDO, POR MODO DE IMPLEMENTACIÓN, 2018-2027 (MILLONES DE USD)

TABLA 61 MERCADO DE MANTENIMIENTO PREDICTIVO DEL REINO UNIDO, POR TAMAÑO DE ORGANIZACIÓN, 2018-2027 (MILLONES DE USD)

TABLA 62 MERCADO DE MANTENIMIENTO PREDICTIVO DEL REINO UNIDO, POR VERTICAL, 2018-2027 (MILLONES DE USD)

TABLA 63 MERCADO DE MANTENIMIENTO PREDICTIVO DE FRANCIA, POR COMPONENTE, 2018-2027 (MILLONES DE USD)

TABLA 64 SOLUCIONES DE FRANCIA EN EL MERCADO DE MANTENIMIENTO PREDICTIVO, POR TIPO, 2018-2027 (MILLONES DE USD)

TABLA 65 SERVICIOS DE FRANCIA EN EL MERCADO DE MANTENIMIENTO PREDICTIVO, POR TIPO, 2018-2027 (MILLONES DE USD)

TABLA 66 MERCADO DE MANTENIMIENTO PREDICTIVO DE FRANCIA, POR MODO DE IMPLEMENTACIÓN, 2018-2027 (MILLONES DE USD)

TABLA 67 MERCADO DE MANTENIMIENTO PREDICTIVO DE FRANCIA, POR TAMAÑO DE ORGANIZACIÓN, 2018-2027 (MILLONES DE USD)

TABLA 68 MERCADO DE MANTENIMIENTO PREDICTIVO DE FRANCIA, POR VERTICAL, 2018-2027 (MILLONES DE USD)

TABLA 69 MERCADO DE MANTENIMIENTO PREDICTIVO DE RUSIA, POR COMPONENTE, 2018-2027 (MILLONES DE USD)

TABLA 70 SOLUCIONES DE RUSIA EN EL MERCADO DE MANTENIMIENTO PREDICTIVO, POR TIPO, 2018-2027 (MILLONES DE USD)

TABLA 71 SERVICIOS DE RUSIA EN EL MERCADO DE MANTENIMIENTO PREDICTIVO, POR TIPO, 2018-2027 (MILLONES DE USD)

TABLA 72 MERCADO DE MANTENIMIENTO PREDICTIVO DE RUSIA, POR MODO DE IMPLEMENTACIÓN, 2018-2027 (MILLONES DE USD)

TABLA 73 MERCADO DE MANTENIMIENTO PREDICTIVO DE RUSIA, POR TAMAÑO DE ORGANIZACIÓN, 2018-2027 (MILLONES DE USD)

TABLA 74 MERCADO DE MANTENIMIENTO PREDICTIVO DE RUSIA, POR VERTICAL, 2018-2027 (MILLONES DE USD)

TABLA 75 MERCADO DE MANTENIMIENTO PREDICTIVO DE ITALIA, POR COMPONENTE, 2018-2027 (MILLONES DE USD)

TABLA 76 SOLUCIONES DE ITALIA EN EL MERCADO DE MANTENIMIENTO PREDICTIVO, POR TIPO, 2018-2027 (MILLONES DE USD)

TABLA 77 SERVICIOS DE ITALIA EN EL MERCADO DE MANTENIMIENTO PREDICTIVO, POR TIPO, 2018-2027 (MILLONES DE USD)

TABLA 78 MERCADO DE MANTENIMIENTO PREDICTIVO DE ITALIA, POR MODO DE IMPLEMENTACIÓN, 2018-2027 (MILLONES DE USD)

TABLA 79 MERCADO DE MANTENIMIENTO PREDICTIVO DE ITALIA, POR TAMAÑO DE ORGANIZACIÓN, 2018-2027 (MILLONES DE USD)

TABLA 80 MERCADO DE MANTENIMIENTO PREDICTIVO DE ITALIA, POR VERTICAL, 2018-2027 (MILLONES DE USD)

TABLA 81 MERCADO DE MANTENIMIENTO PREDICTIVO EN ESPAÑA, POR COMPONENTE, 2018-2027 (MILLONES DE USD)

TABLA 82 SOLUCIONES DE ESPAÑA EN EL MERCADO DE MANTENIMIENTO PREDICTIVO, POR TIPO, 2018-2027 (MILLONES DE USD)

TABLA 83 SERVICIOS DE ESPAÑA EN EL MERCADO DE MANTENIMIENTO PREDICTIVO, POR TIPO, 2018-2027 (MILLONES DE USD)

TABLA 84 MERCADO DE MANTENIMIENTO PREDICTIVO EN ESPAÑA, POR MODO DE IMPLEMENTACIÓN, 2018-2027 (MILLONES DE USD)

TABLA 85 MERCADO DE MANTENIMIENTO PREDICTIVO EN ESPAÑA, POR TAMAÑO DE ORGANIZACIÓN, 2018-2027 (MILLONES DE USD)

TABLA 86 MERCADO DE MANTENIMIENTO PREDICTIVO DE ESPAÑA, POR VERTICAL, 2018-2027 (MILLONES DE USD)

TABLA 87 MERCADO DE MANTENIMIENTO PREDICTIVO DE LOS PAÍSES BAJOS, POR COMPONENTE, 2018-2027 (MILLONES DE USD)

TABLA 88 SOLUCIONES HOLANDAS EN EL MERCADO DE MANTENIMIENTO PREDICTIVO, POR TIPO, 2018-2027 (MILLONES DE USD)

TABLA 89 SERVICIOS HOLANDAS EN EL MERCADO DE MANTENIMIENTO PREDICTIVO, POR TIPO, 2018-2027 (MILLONES DE USD)

TABLA 90 MERCADO DE MANTENIMIENTO PREDICTIVO DE LOS PAÍSES BAJOS, POR MODO DE IMPLEMENTACIÓN, 2018-2027 (MILLONES DE USD)

TABLA 91 MERCADO DE MANTENIMIENTO PREDICTIVO DE LOS PAÍSES BAJOS, POR TAMAÑO DE LA ORGANIZACIÓN, 2018-2027 (MILLONES DE USD)

TABLA 92 MERCADO DE MANTENIMIENTO PREDICTIVO DE LOS PAÍSES BAJOS, POR VERTICAL, 2018-2027 (MILLONES DE USD)

TABLA 93 MERCADO DE MANTENIMIENTO PREDICTIVO DE SUIZA, POR COMPONENTE, 2018-2027 (MILLONES DE USD)

TABLA 94 SOLUCIONES SUIZAS EN EL MERCADO DE MANTENIMIENTO PREDICTIVO, POR TIPO, 2018-2027 (MILLONES DE USD)

TABLA 95 SERVICIOS DE SUIZA EN EL MERCADO DE MANTENIMIENTO PREDICTIVO, POR TIPO, 2018-2027 (MILLONES DE USD)

TABLA 96 MERCADO DE MANTENIMIENTO PREDICTIVO DE SUIZA, POR MODO DE IMPLEMENTACIÓN, 2018-2027 (MILLONES DE USD)

TABLA 97 MERCADO DE MANTENIMIENTO PREDICTIVO DE SUIZA, POR TAMAÑO DE ORGANIZACIÓN, 2018-2027 (MILLONES DE USD)

TABLA 98 MERCADO DE MANTENIMIENTO PREDICTIVO DE SUIZA, POR VERTICAL, 2018-2027 (MILLONES DE USD)

TABLA 99 MERCADO DE MANTENIMIENTO PREDICTIVO DE BÉLGICA, POR COMPONENTE, 2018-2027 (MILLONES DE USD)

TABLA 100 SOLUCIONES DE BÉLGICA EN EL MERCADO DE MANTENIMIENTO PREDICTIVO, POR TIPO, 2018-2027 (MILLONES DE USD)

TABLA 101 SERVICIOS DE BÉLGICA EN EL MERCADO DE MANTENIMIENTO PREDICTIVO, POR TIPO, 2018-2027 (MILLONES DE USD)

TABLA 102 MERCADO DE MANTENIMIENTO PREDICTIVO DE BÉLGICA, POR MODO DE IMPLEMENTACIÓN, 2018-2027 (MILLONES DE USD)

TABLA 103 MERCADO DE MANTENIMIENTO PREDICTIVO DE BÉLGICA, POR TAMAÑO DE LA ORGANIZACIÓN, 2018-2027 (MILLONES DE USD)

TABLA 104 MERCADO DE MANTENIMIENTO PREDICTIVO DE BÉLGICA, POR VERTICAL, 2018-2027 (MILLONES DE USD)

TABLA 105 MERCADO DE MANTENIMIENTO PREDICTIVO DE TURQUÍA, POR COMPONENTE, 2018-2027 (MILLONES DE USD)

TABLA 106 SOLUCIONES DE TURQUÍA EN EL MERCADO DE MANTENIMIENTO PREDICTIVO, POR TIPO, 2018-2027 (MILLONES DE USD)

TABLA 107 SERVICIOS DE TURQUÍA EN EL MERCADO DE MANTENIMIENTO PREDICTIVO, POR TIPO, 2018-2027 (MILLONES DE USD)

TABLA 108 MERCADO DE MANTENIMIENTO PREDICTIVO DE TURQUÍA, POR MODO DE IMPLEMENTACIÓN, 2018-2027 (MILLONES DE USD)

TABLA 109 MERCADO DE MANTENIMIENTO PREDICTIVO DE TURQUÍA, POR TAMAÑO DE ORGANIZACIÓN, 2018-2027 (MILLONES DE USD)

TABLA 110 MERCADO DE MANTENIMIENTO PREDICTIVO DE TURQUÍA, POR VERTICAL, 2018-2027 (MILLONES DE USD)

TABLA 111 MERCADO DE MANTENIMIENTO PREDICTIVO DEL RESTO DE EUROPA, POR COMPONENTE, 2018-2027 (MILLONES DE USD)

TABLA 112 MERCADO DE MANTENIMIENTO PREDICTIVO DE ASIA Y EL PACÍFICO, POR PAÍS, 2018-2027 (MILLONES DE USD)

TABLA 113 MERCADO DE MANTENIMIENTO PREDICTIVO DE ASIA Y EL PACÍFICO, POR COMPONENTE, 2018-2027 (MILLONES DE USD)

TABLA 114 SOLUCIONES DE ASIA Y EL PACÍFICO EN EL MERCADO DE MANTENIMIENTO PREDICTIVO, POR TIPO, 2018-2027 (MILLONES DE USD)

TABLA 115 SERVICIOS DE ASIA Y EL PACÍFICO EN EL MERCADO DE MANTENIMIENTO PREDICTIVO, POR TIPO, 2018-2027 (MILLONES DE USD)

TABLA 116 MERCADO DE MANTENIMIENTO PREDICTIVO DE ASIA Y EL PACÍFICO, POR MODO DE IMPLEMENTACIÓN, 2018-2027 (MILLONES DE USD)

TABLA 117 MERCADO DE MANTENIMIENTO PREDICTIVO DE ASIA Y EL PACÍFICO, POR TAMAÑO DE ORGANIZACIÓN, 2018-2027 (MILLONES DE USD)

TABLA 118 MERCADO DE MANTENIMIENTO PREDICTIVO DE ASIA Y EL PACÍFICO, POR VERTICAL, 2018-2027 (MILLONES DE USD)

TABLA 119 MERCADO DE MANTENIMIENTO PREDICTIVO DE CHINA, POR COMPONENTE, 2018-2027 (MILLONES DE USD)

TABLA 120 SOLUCIONES CHINA EN EL MERCADO DE MANTENIMIENTO PREDICTIVO, POR TIPO, 2018-2027 (MILLONES DE USD)

TABLA 121 SERVICIOS DE CHINA EN EL MERCADO DE MANTENIMIENTO PREDICTIVO, POR TIPO, 2018-2027 (MILLONES DE USD)

TABLA 122 MERCADO DE MANTENIMIENTO PREDICTIVO DE CHINA, POR MODO DE IMPLEMENTACIÓN, 2018-2027 (MILLONES DE USD)

TABLA 123 MERCADO DE MANTENIMIENTO PREDICTIVO DE CHINA, POR TAMAÑO DE ORGANIZACIÓN, 2018-2027 (MILLONES DE USD)

TABLA 124 MERCADO DE MANTENIMIENTO PREDICTIVO DE CHINA, POR VERTICAL, 2018-2027 (MILLONES DE USD)

TABLA 125 MERCADO DE MANTENIMIENTO PREDICTIVO DE JAPÓN, POR COMPONENTE, 2018-2027 (MILLONES DE USD)

TABLA 126 SOLUCIONES JAPONESAS EN EL MERCADO DE MANTENIMIENTO PREDICTIVO, POR TIPO, 2018-2027 (MILLONES DE USD)

TABLA 127 SERVICIOS DE JAPÓN EN EL MERCADO DE MANTENIMIENTO PREDICTIVO, POR TIPO, 2018-2027 (MILLONES DE USD)

TABLA 128 MERCADO DE MANTENIMIENTO PREDICTIVO DE JAPÓN, POR MODO DE IMPLEMENTACIÓN, 2018-2027 (MILLONES DE USD)

TABLA 129 MERCADO DE MANTENIMIENTO PREDICTIVO DE JAPÓN, POR TAMAÑO DE ORGANIZACIÓN, 2018-2027 (MILLONES DE USD)

TABLA 130 MERCADO DE MANTENIMIENTO PREDICTIVO DE JAPÓN, POR VERTICAL, 2018-2027 (MILLONES DE USD)

TABLA 131 MERCADO DE MANTENIMIENTO PREDICTIVO DE LA INDIA, POR COMPONENTE, 2018-2027 (MILLONES DE USD)

TABLA 132 SOLUCIONES DE LA INDIA EN EL MERCADO DE MANTENIMIENTO PREDICTIVO, POR TIPO, 2018-2027 (MILLONES DE USD)

TABLA 133 SERVICIOS DE LA INDIA EN EL MERCADO DE MANTENIMIENTO PREDICTIVO, POR TIPO, 2018-2027 (MILLONES DE USD)

TABLA 134 MERCADO DE MANTENIMIENTO PREDICTIVO DE LA INDIA, POR MODO DE IMPLEMENTACIÓN, 2018-2027 (MILLONES DE USD)

TABLA 135 MERCADO DE MANTENIMIENTO PREDICTIVO DE LA INDIA, POR TAMAÑO DE LA ORGANIZACIÓN, 2018-2027 (MILLONES DE USD)

TABLA 136 MERCADO DE MANTENIMIENTO PREDICTIVO DE LA INDIA, POR VERTICAL, 2018-2027 (MILLONES DE USD)

TABLA 137 MERCADO DE MANTENIMIENTO PREDICTIVO DE COREA DEL SUR, POR COMPONENTE, 2018-2027 (MILLONES DE USD)

TABLA 138 SOLUCIONES DE COREA DEL SUR EN EL MERCADO DE MANTENIMIENTO PREDICTIVO, POR TIPO, 2018-2027 (MILLONES DE USD)

TABLA 139 SERVICIOS DE COREA DEL SUR EN EL MERCADO DE MANTENIMIENTO PREDICTIVO, POR TIPO, 2018-2027 (MILLONES DE USD)

TABLA 140 MERCADO DE MANTENIMIENTO PREDICTIVO DE COREA DEL SUR, POR MODO DE IMPLEMENTACIÓN, 2018-2027 (MILLONES DE USD)

TABLA 141 MERCADO DE MANTENIMIENTO PREDICTIVO DE COREA DEL SUR, POR TAMAÑO DE ORGANIZACIÓN, 2018-2027 (MILLONES DE USD)

TABLA 142 MERCADO DE MANTENIMIENTO PREDICTIVO DE COREA DEL SUR, POR VERTICAL, 2018-2027 (MILLONES DE USD)

TABLA 143 MERCADO DE MANTENIMIENTO PREDICTIVO DE AUSTRALIA, POR COMPONENTE, 2018-2027 (MILLONES DE USD)

TABLA 144 SOLUCIONES DE AUSTRALIA EN EL MERCADO DE MANTENIMIENTO PREDICTIVO, POR TIPO, 2018-2027 (MILLONES DE USD)

TABLA 145 SERVICIOS DE AUSTRALIA EN EL MERCADO DE MANTENIMIENTO PREDICTIVO, POR TIPO, 2018-2027 (MILLONES DE USD)

TABLA 146 MERCADO DE MANTENIMIENTO PREDICTIVO DE AUSTRALIA, POR MODO DE IMPLEMENTACIÓN, 2018-2027 (MILLONES DE USD)

TABLA 147 MERCADO DE MANTENIMIENTO PREDICTIVO DE AUSTRALIA, POR TAMAÑO DE ORGANIZACIÓN, 2018-2027 (MILLONES DE USD)

TABLA 148 MERCADO DE MANTENIMIENTO PREDICTIVO DE AUSTRALIA, POR VERTICAL, 2018-2027 (MILLONES DE USD)

TABLA 149 MERCADO DE MANTENIMIENTO PREDICTIVO DE SINGAPUR, POR COMPONENTE, 2018-2027 (MILLONES DE USD)

TABLA 150 SOLUCIONES DE SINGAPUR EN EL MERCADO DE MANTENIMIENTO PREDICTIVO, POR TIPO, 2018-2027 (MILLONES DE USD)

TABLA 151 SERVICIOS DE SINGAPUR EN EL MERCADO DE MANTENIMIENTO PREDICTIVO, POR TIPO, 2018-2027 (MILLONES DE USD)

TABLA 152 MERCADO DE MANTENIMIENTO PREDICTIVO DE SINGAPUR, POR MODO DE IMPLEMENTACIÓN, 2018-2027 (MILLONES DE USD)

TABLA 153 MERCADO DE MANTENIMIENTO PREDICTIVO DE SINGAPUR, POR TAMAÑO DE LA ORGANIZACIÓN, 2018-2027 (MILLONES DE USD)

TABLA 154 MERCADO DE MANTENIMIENTO PREDICTIVO DE SINGAPUR, POR VERTICAL, 2018-2027 (MILLONES DE USD)

TABLA 155 MERCADO DE MANTENIMIENTO PREDICTIVO DE INDONESIA, POR COMPONENTE, 2018-2027 (MILLONES DE USD)

TABLA 156 SOLUCIONES DE INDONESIA EN EL MERCADO DE MANTENIMIENTO PREDICTIVO, POR TIPO, 2018-2027 (MILLONES DE USD)

TABLA 157 SERVICIOS DE INDONESIA EN EL MERCADO DE MANTENIMIENTO PREDICTIVO, POR TIPO, 2018-2027 (MILLONES DE USD)

TABLA 158 MERCADO DE MANTENIMIENTO PREDICTIVO DE INDONESIA, POR MODO DE IMPLEMENTACIÓN, 2018-2027 (MILLONES DE USD)

TABLA 159 MERCADO DE MANTENIMIENTO PREDICTIVO DE INDONESIA, POR TAMAÑO DE ORGANIZACIÓN, 2018-2027 (MILLONES DE USD)

TABLA 160 MERCADO DE MANTENIMIENTO PREDICTIVO DE INDONESIA, POR VERTICAL, 2018-2027 (MILLONES DE USD)

TABLA 161 MERCADO DE MANTENIMIENTO PREDICTIVO DE TAILANDIA, POR COMPONENTE, 2018-2027 (MILLONES DE USD)

TABLA 162 SOLUCIONES DE TAILANDIA EN EL MERCADO DE MANTENIMIENTO PREDICTIVO, POR TIPO, 2018-2027 (MILLONES DE USD)

TABLA 163 SERVICIOS DE TAILANDIA EN EL MERCADO DE MANTENIMIENTO PREDICTIVO, POR TIPO, 2018-2027 (MILLONES DE USD)

TABLA 164 MERCADO DE MANTENIMIENTO PREDICTIVO DE TAILANDIA, POR MODO DE IMPLEMENTACIÓN, 2018-2027 (MILLONES DE USD)

TABLA 165 MERCADO DE MANTENIMIENTO PREDICTIVO DE TAILANDIA, POR TAMAÑO DE ORGANIZACIÓN, 2018-2027 (MILLONES DE USD)

TABLA 166 MERCADO DE MANTENIMIENTO PREDICTIVO DE TAILANDIA, POR VERTICAL, 2018-2027 (MILLONES DE USD)

TABLA 167 MERCADO DE MANTENIMIENTO PREDICTIVO DE MALASIA, POR COMPONENTE, 2018-2027 (MILLONES DE USD)

TABLA 168 SOLUCIONES DE MALASIA EN EL MERCADO DE MANTENIMIENTO PREDICTIVO, POR TIPO, 2018-2027 (MILLONES DE USD)

TABLA 169 SERVICIOS DE MALASIA EN EL MERCADO DE MANTENIMIENTO PREDICTIVO, POR TIPO, 2018-2027 (MILLONES DE USD)

TABLA 170 MERCADO DE MANTENIMIENTO PREDICTIVO DE MALASIA, POR MODO DE IMPLEMENTACIÓN, 2018-2027 (MILLONES DE USD)

TABLA 171 MERCADO DE MANTENIMIENTO PREDICTIVO DE MALASIA, POR TAMAÑO DE ORGANIZACIÓN, 2018-2027 (MILLONES DE USD)

TABLA 172 MERCADO DE MANTENIMIENTO PREDICTIVO DE MALASIA, POR VERTICAL, 2018-2027 (MILLONES DE USD)

CUADRO 173 MERCADO DE MANTENIMIENTO PREDICTIVO DE FILIPINAS, POR COMPONENTE, 2018-2027 (MILLONES DE USD)

TABLA 174 SOLUCIONES DE FILIPINAS EN EL MERCADO DE MANTENIMIENTO PREDICTIVO, POR TIPO, 2018-2027 (MILLONES DE USD)

CUADRO 175 SERVICIOS DE FILIPINAS EN EL MERCADO DE MANTENIMIENTO PREDICTIVO, POR TIPO, 2018-2027 (MILLONES DE USD)

TABLA 176 MERCADO DE MANTENIMIENTO PREDICTIVO DE FILIPINAS, POR MODO DE IMPLEMENTACIÓN, 2018-2027 (MILLONES DE USD)

TABLA 177 MERCADO DE MANTENIMIENTO PREDICTIVO DE FILIPINAS, POR TAMAÑO DE ORGANIZACIÓN, 2018-2027 (MILLONES DE USD)

TABLA 178 MERCADO DE MANTENIMIENTO PREDICTIVO DE FILIPINAS, POR VERTICAL, 2018-2027 (MILLONES DE USD)

TABLA 179 RESTO DEL MERCADO DE MANTENIMIENTO PREDICTIVO DE ASIA Y EL PACÍFICO, POR COMPONENTE, 2018-2027 (MILLONES DE USD)

TABLA 180 MERCADO DE MANTENIMIENTO PREDICTIVO DE ORIENTE MEDIO Y ÁFRICA, POR PAÍS, 2018-2027 (MILLONES DE USD)

TABLA 181 MERCADO DE MANTENIMIENTO PREDICTIVO DE ORIENTE MEDIO Y ÁFRICA, POR COMPONENTE, 2018-2027 (MILLONES DE USD)

TABLA 182 SOLUCIONES DE ORIENTE MEDIO Y ÁFRICA EN EL MERCADO DE MANTENIMIENTO PREDICTIVO, POR TIPO, 2018-2027 (MILLONES DE USD)

TABLA 183 SERVICIOS DE ORIENTE MEDIO Y ÁFRICA EN EL MERCADO DE MANTENIMIENTO PREDICTIVO, POR TIPO, 2018-2027 (MILLONES DE USD)

TABLA 184 MERCADO DE MANTENIMIENTO PREDICTIVO DE ORIENTE MEDIO Y ÁFRICA, POR MODO DE IMPLEMENTACIÓN, 2018-2027 (MILLONES DE USD)

TABLA 185 MERCADO DE MANTENIMIENTO PREDICTIVO DE ORIENTE MEDIO Y ÁFRICA, POR TAMAÑO DE LA ORGANIZACIÓN, 2018-2027 (MILLONES DE USD)

TABLA 186 MERCADO DE MANTENIMIENTO PREDICTIVO DE ORIENTE MEDIO Y ÁFRICA, POR VERTICAL, 2018-2027 (MILLONES DE USD)

TABLA 187 MERCADO DE MANTENIMIENTO PREDICTIVO DE SUDÁFRICA, POR COMPONENTE, 2018-2027 (MILLONES DE USD)

TABLA 188 SOLUCIONES DE SUDÁFRICA EN EL MERCADO DE MANTENIMIENTO PREDICTIVO, POR TIPO, 2018-2027 (MILLONES DE USD)

TABLA 189 SERVICIOS DE SUDÁFRICA EN EL MERCADO DE MANTENIMIENTO PREDICTIVO, POR TIPO, 2018-2027 (MILLONES DE USD)

TABLA 190 MERCADO DE MANTENIMIENTO PREDICTIVO DE SUDÁFRICA, POR MODO DE IMPLEMENTACIÓN, 2018-2027 (MILLONES DE USD)

TABLA 191 MERCADO DE MANTENIMIENTO PREDICTIVO DE SUDÁFRICA, POR TAMAÑO DE ORGANIZACIÓN, 2018-2027 (MILLONES DE USD)

TABLA 192 MERCADO DE MANTENIMIENTO PREDICTIVO DE SUDÁFRICA, POR VERTICAL, 2018-2027 (MILLONES DE USD)

TABLA 193 MERCADO DE MANTENIMIENTO PREDICTIVO DE ARABIA SAUDITA, POR COMPONENTE, 2018-2027 (MILLONES DE USD)

TABLA 194 SOLUCIONES DE ARABIA SAUDITA EN EL MERCADO DE MANTENIMIENTO PREDICTIVO, POR TIPO, 2018-2027 (MILLONES DE USD)

TABLA 195 SERVICIOS DE ARABIA SAUDITA EN EL MERCADO DE MANTENIMIENTO PREDICTIVO, POR TIPO, 2018-2027 (MILLONES DE USD)

TABLA 196 MERCADO DE MANTENIMIENTO PREDICTIVO DE ARABIA SAUDITA, POR MODO DE IMPLEMENTACIÓN, 2018-2027 (MILLONES DE USD)

TABLA 197 MERCADO DE MANTENIMIENTO PREDICTIVO DE ARABIA SAUDITA, POR TAMAÑO DE ORGANIZACIÓN, 2018-2027 (MILLONES DE USD)

TABLA 198 MERCADO DE MANTENIMIENTO PREDICTIVO DE ARABIA SAUDITA, POR VERTICAL, 2018-2027 (MILLONES DE USD)

TABLA 199 MERCADO DE MANTENIMIENTO PREDICTIVO DE LOS EAU, POR COMPONENTE, 2018-2027 (MILLONES DE USD)

TABLA 200 SOLUCIONES DE LOS EAU EN EL MERCADO DE MANTENIMIENTO PREDICTIVO, POR TIPO, 2018-2027 (MILLONES DE USD)

TABLA 201 SERVICIOS DE LOS EAU EN EL MERCADO DE MANTENIMIENTO PREDICTIVO, POR TIPO, 2018-2027 (MILLONES DE USD)

TABLA 202 MERCADO DE MANTENIMIENTO PREDICTIVO DE LOS EAU, POR MODO DE IMPLEMENTACIÓN, 2018-2027 (MILLONES DE USD)

TABLA 203 MERCADO DE MANTENIMIENTO PREDICTIVO DE LOS EAU, POR TAMAÑO DE ORGANIZACIÓN, 2018-2027 (MILLONES DE USD)

TABLA 204 MERCADO DE MANTENIMIENTO PREDICTIVO DE LOS EAU, POR VERTICAL, 2018-2027 (MILLONES DE USD)

TABLA 205 MERCADO DE MANTENIMIENTO PREDICTIVO DE ISRAEL, POR COMPONENTE, 2018-2027 (MILLONES DE USD)

TABLA 206 SOLUCIONES DE ISRAEL EN EL MERCADO DE MANTENIMIENTO PREDICTIVO, POR TIPO, 2018-2027 (MILLONES DE USD)

TABLA 207 SERVICIOS DE ISRAEL EN EL MERCADO DE MANTENIMIENTO PREDICTIVO, POR TIPO, 2018-2027 (MILLONES DE USD)

TABLA 208 MERCADO DE MANTENIMIENTO PREDICTIVO DE ISRAEL, POR MODO DE IMPLEMENTACIÓN, 2018-2027 (MILLONES DE USD)

TABLA 209 MERCADO DE MANTENIMIENTO PREDICTIVO DE ISRAEL, POR TAMAÑO DE ORGANIZACIÓN, 2018-2027 (MILLONES DE USD)

TABLA 210 MERCADO DE MANTENIMIENTO PREDICTIVO DE ISRAEL, POR VERTICAL, 2018-2027 (MILLONES DE USD)

TABLA 211 MERCADO DE MANTENIMIENTO PREDICTIVO DE EGIPTO, POR COMPONENTE, 2018-2027 (MILLONES DE USD)

TABLA 212 SOLUCIONES DE EGIPTO EN EL MERCADO DE MANTENIMIENTO PREDICTIVO, POR TIPO, 2018-2027 (MILLONES DE USD)

TABLA 213 SERVICIOS DE EGIPTO EN EL MERCADO DE MANTENIMIENTO PREDICTIVO, POR TIPO, 2018-2027 (MILLONES DE USD)

TABLA 214 MERCADO DE MANTENIMIENTO PREDICTIVO DE EGIPTO, POR MODO DE IMPLEMENTACIÓN, 2018-2027 (MILLONES DE USD)

TABLA 215 MERCADO DE MANTENIMIENTO PREDICTIVO DE EGIPTO, POR TAMAÑO DE ORGANIZACIÓN, 2018-2027 (MILLONES DE USD)

TABLA 216 MERCADO DE MANTENIMIENTO PREDICTIVO DE EGIPTO, POR VERTICAL, 2018-2027 (MILLONES DE USD)

TABLA 217 MERCADO DE MANTENIMIENTO PREDICTIVO DEL RESTO DE ORIENTE MEDIO Y ÁFRICA, POR COMPONENTE, 2018-2027 (MILLONES DE USD)

CUADRO 218 MERCADO DE MANTENIMIENTO PREDICTIVO DE AMÉRICA DEL SUR, POR PAÍS, 2018-2027 (MILLONES DE USD)

CUADRO 219 MERCADO DE MANTENIMIENTO PREDICTIVO DE AMÉRICA DEL SUR, POR COMPONENTE, 2018-2027 (MILLONES DE USD)

TABLA 220 SOLUCIONES DE SUDAMÉRICA EN EL MERCADO DE MANTENIMIENTO PREDICTIVO, POR TIPO, 2018-2027 (MILLONES DE USD)

CUADRO 221 SERVICIOS DE SUDAMÉRICA EN EL MERCADO DE MANTENIMIENTO PREDICTIVO, POR TIPO, 2018-2027 (MILLONES DE USD)

TABLA 222 MERCADO DE MANTENIMIENTO PREDICTIVO DE AMÉRICA DEL SUR, POR MODO DE IMPLEMENTACIÓN, 2018-2027 (MILLONES DE USD)

TABLA 223 MERCADO DE MANTENIMIENTO PREDICTIVO DE AMÉRICA DEL SUR, POR TAMAÑO DE ORGANIZACIÓN, 2018-2027 (MILLONES DE USD)

TABLA 224 MERCADO DE MANTENIMIENTO PREDICTIVO DE AMÉRICA DEL SUR, POR VERTICAL, 2018-2027 (MILLONES DE USD)

CUADRO 225 MERCADO DE MANTENIMIENTO PREDICTIVO DE BRASIL, POR COMPONENTE, 2018-2027 (MILLONES DE USD)

TABLA 226 SOLUCIONES BRASIL EN EL MERCADO DE MANTENIMIENTO PREDICTIVO, POR TIPO, 2018-2027 (MILLONES DE USD)

CUADRO 227 SERVICIOS DE BRASIL EN EL MERCADO DE MANTENIMIENTO PREDICTIVO, POR TIPO, 2018-2027 (MILLONES DE USD)

TABLA 228 MERCADO DE MANTENIMIENTO PREDICTIVO DE BRASIL, POR MODO DE IMPLEMENTACIÓN, 2018-2027 (MILLONES DE USD)

TABLA 229 MERCADO DE MANTENIMIENTO PREDICTIVO DE BRASIL, POR TAMAÑO DE ORGANIZACIÓN, 2018-2027 (MILLONES DE USD)

TABLA 230 MERCADO DE MANTENIMIENTO PREDICTIVO DE BRASIL, POR VERTICAL, 2018-2027 (MILLONES DE USD)

CUADRO 231 MERCADO DE MANTENIMIENTO PREDICTIVO DE ARGENTINA, POR COMPONENTE, 2018-2027 (MILLONES DE USD)

TABLA 232 SOLUCIONES ARGENTINAS EN EL MERCADO DE MANTENIMIENTO PREDICTIVO, POR TIPO, 2018-2027 (MILLONES DE USD)

CUADRO 233 SERVICIOS ARGENTINA EN EL MERCADO DE MANTENIMIENTO PREDICTIVO, POR TIPO, 2018-2027 (MILLONES DE USD)

CUADRO 234 MERCADO DE MANTENIMIENTO PREDICTIVO DE ARGENTINA, POR MODO DE IMPLEMENTACIÓN, 2018-2027 (MILLONES DE USD)

CUADRO 235 MERCADO DE MANTENIMIENTO PREDICTIVO DE ARGENTINA, POR TAMAÑO DE ORGANIZACIÓN, 2018-2027 (MILLONES DE USD)

CUADRO 236 MERCADO DE MANTENIMIENTO PREDICTIVO DE ARGENTINA, POR VERTICAL, 2018-2027 (MILLONES DE USD)

CUADRO 237 MERCADO DE MANTENIMIENTO PREDICTIVO DEL RESTO DE SUDAMÉRICA, POR COMPONENTE, 2018-2027 (MILLONES DE USD)


Por favor complete el siguiente formulario para Infografías

Al hacer clic en el botón "Enviar", usted acepta la investigación de mercado de Data Bridge. política de privacidad y Términos y condiciones

Metodología de investigación:

La recopilación de datos y el análisis del año base se realizan mediante módulos de recopilación de datos con muestras de gran tamaño. La etapa incluye la obtención de información de mercado o datos relacionados a través de diversas fuentes y estrategias. Incluye examinar y planificar de antemano todos los datos adquiridos del pasado. Asimismo, abarca el examen de las inconsistencias de la información observadas en diferentes fuentes de información. Los datos de mercado se analizan y estiman utilizando modelos estadísticos y coherentes de mercado. Además, el análisis de la cuota de mercado y el análisis de tendencias clave son los principales factores de éxito en el informe de mercado. Para saber más, solicite una llamada de analista o envíe su consulta.

La metodología de investigación clave utilizada por el equipo de investigación de DBMR es la triangulación de datos, que implica extracción de datos, análisis del impacto de las variables de datos en el mercado y validación primaria (experto de la industria). Los modelos de datos incluyen cuadrícula de posicionamiento de proveedores, análisis de la línea de tiempo del mercado, descripción general y guía del mercado, cuadrícula de posicionamiento de la empresa, análisis de patentes, análisis de precios, análisis de participación de mercado de la empresa, estándares de medición, análisis global versus regional y de participación de proveedores. Para saber más sobre la metodología de investigación, envíe una consulta para hablar con nuestros expertos de la industria.

Por favor complete el siguiente formulario para Metodología de Investigación

Al hacer clic en el botón "Enviar", usted acepta la investigación de mercado de Data Bridge. política de privacidad y Términos y condiciones

Personalización disponible:

Data Bridge Market Research es líder en investigación formativa avanzada. Estamos orgullosos de brindar servicios a nuestros clientes nuevos y existentes con datos y análisis que coinciden y se adaptan a sus objetivos. El informe se puede personalizar para incluir análisis de tendencias de precios de marcas objetivo que comprendan el mercado de países adicionales (solicite la lista de países), datos de resultados de ensayos clínicos, revisión de la literatura, mercado renovado y análisis de la base de productos. El análisis de mercado de los competidores objetivo se puede analizar desde análisis basados ​​en tecnología hasta estrategias de cartera de mercado. Podemos agregar tantos competidores sobre los que necesite datos en el formato y estilo de datos que esté buscando. Nuestro equipo de analistas también puede proporcionarle datos en tablas dinámicas de archivos de Excel sin procesar (libro de datos) o puede ayudarlo a crear presentaciones a partir de los conjuntos de datos disponibles en el informe.

Complete el siguiente formulario para personalizar disponible

Al hacer clic en el botón "Enviar", usted acepta la investigación de mercado de Data Bridge. política de privacidad y Términos y condiciones

HAGA PREGUNTAS FRECUENTES

Se espera que el valor de mercado del mercado de mantenimiento predictivo
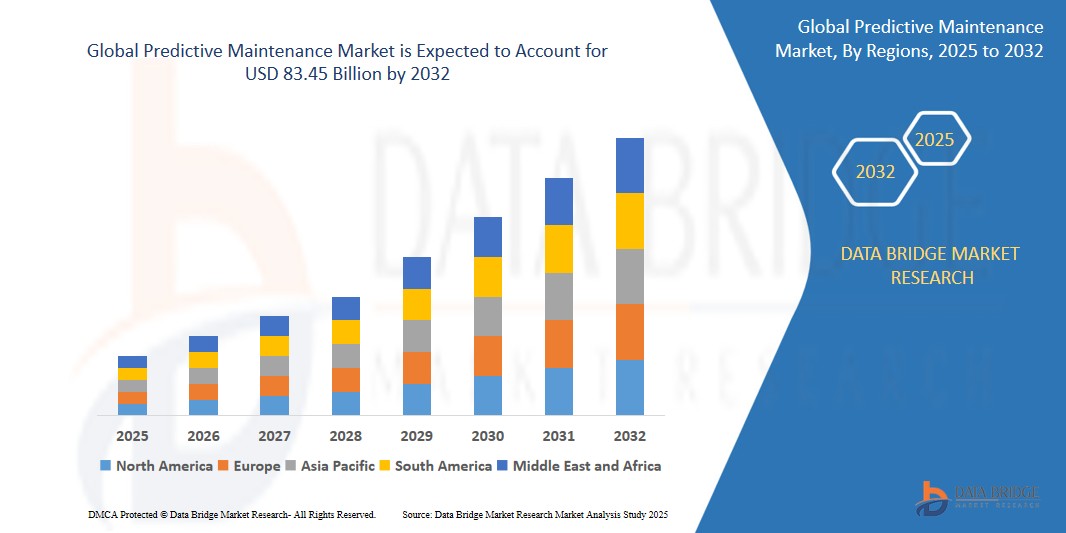
 sea de 36,01 mil millones de dólares para 2029.
El mercado de mantenimiento predictivo crecerá a una tasa compuesta anual del 32,30% durante el pronóstico para 2029.
Los principales actores que operan en el mercado de mantenimiento predictivo son Microsoft (EE. UU.), IBM (EE. UU.), SAP (Alemania), SAS Institute Inc. (EE. UU.), Software AG (Alemania), TIBCO Software Inc. (EE. UU.), Hewlett Packard Enterprise Development LP (EE. UU.), Altair Engineering Inc. (EE. UU.), Splunk Inc. (EE. UU.), Oracle (EE. UU.), Google (EE. UU.), Amazon Web Services, Inc. (EE. UU.), General Electric (EE. UU.), Schneider Electric ( Francia), Hitachi, Ltd. (Japón), PTC (EE. UU.), RapidMiner, Inc. (EE. UU.), Operational Excellence (OPEX) Group Ltd, (Reino Unido), Dingo (Australia), Factory5 (Rusia).
Los principales países cubiertos en el mercado de mantenimiento predictivo son EE. UU., Canadá y México en América del Norte, Alemania, Francia, Reino Unido, Países Bajos, Suiza, Bélgica, Rusia, Italia, España, Turquía, resto de Europa en Europa, China, Japón, India. , Corea del Sur, Singapur, Malasia, Australia, Tailandia, Indonesia, Filipinas, Resto de Asia-Pacífico (APAC), Arabia Saudita, Emiratos Árabes Unidos, Sudáfrica, Egipto, Israel, Resto de Medio Oriente y África (MEA) como parte de Medio Oriente y África (MEA), Brasil, Argentina y Resto de Sudamérica como parte de Sudamérica.
Informe de muestra gratuito

ELEGIR TIPO DE LICENCIA

  • 7000.00
  • 4800.00
  • 3000.00
  • 8000.00
  • 12000.00

Por qué elegirnos

Cobertura de la industria

DBMR trabaja en todo el mundo en múltiples industrias, lo que nos brinda conocimiento en todos los sectores verticales y brinda a nuestros clientes información no solo de su industria sino también de cómo otras industrias afectarán su ecosistema.

Cobertura Regional

La cobertura de Data Bridge no se limita a las economías desarrolladas o emergentes. Trabajamos en todo el mundo cubriendo la mayor variedad de países donde ninguna otra firma de investigación de mercado o consultoría de negocios ha realizado investigaciones; creando oportunidades de crecimiento para nuestros clientes en áreas aún desconocidas.

Cobertura Tecnológica

En el mundo actual, la tecnología impulsa el sentimiento del mercado, por lo que nuestra visión es brindar a nuestros clientes información no solo sobre las tecnologías desarrolladas, sino también sobre los cambios tecnológicos futuros e disruptivos a lo largo del ciclo de vida del producto, brindándoles oportunidades imprevistas en el mercado que crearán disrupciones en su industria. . Esto lleva a la innovación y a que nuestros clientes salgan ganadores.

Soluciones orientadas a objetivos

El objetivo de DBMR es ayudar a nuestros clientes a alcanzar sus objetivos a través de nuestras soluciones; por lo tanto, creamos de manera formativa las soluciones más adecuadas para las necesidades de nuestros clientes, ahorrándoles tiempo y esfuerzos para impulsar sus grandes estrategias.

Soporte de analista incomparable

Nuestros analistas se enorgullecen del éxito de nuestros clientes. A diferencia de otros, creemos en trabajar junto a nuestros clientes para lograr sus objetivos con soporte de analistas las 24 horas para determinar las necesidades correctas e inspirar la innovación a través del servicio.

Banner

testimonios de clientes