
Mercado mundial de indio, por producto (primario, secundario y tipo III), aplicación ( pantallas planas , materiales semiconductores, energía fotovoltaica, soldaduras, aleaciones, materiales de interfaz térmica y baterías): tendencias de la industria y pronóstico hasta 2030.
Análisis y perspectivas del mercado del indio
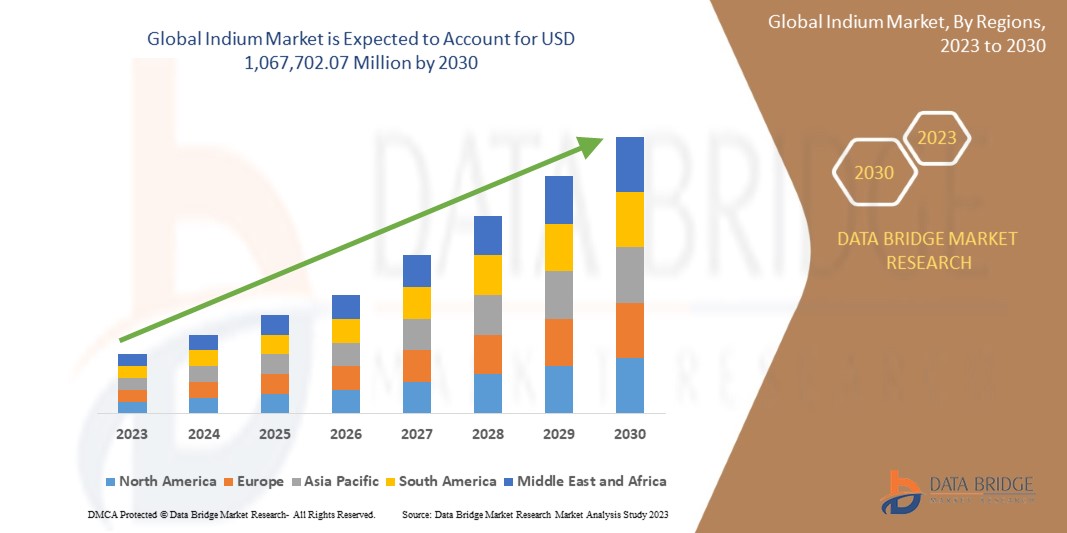
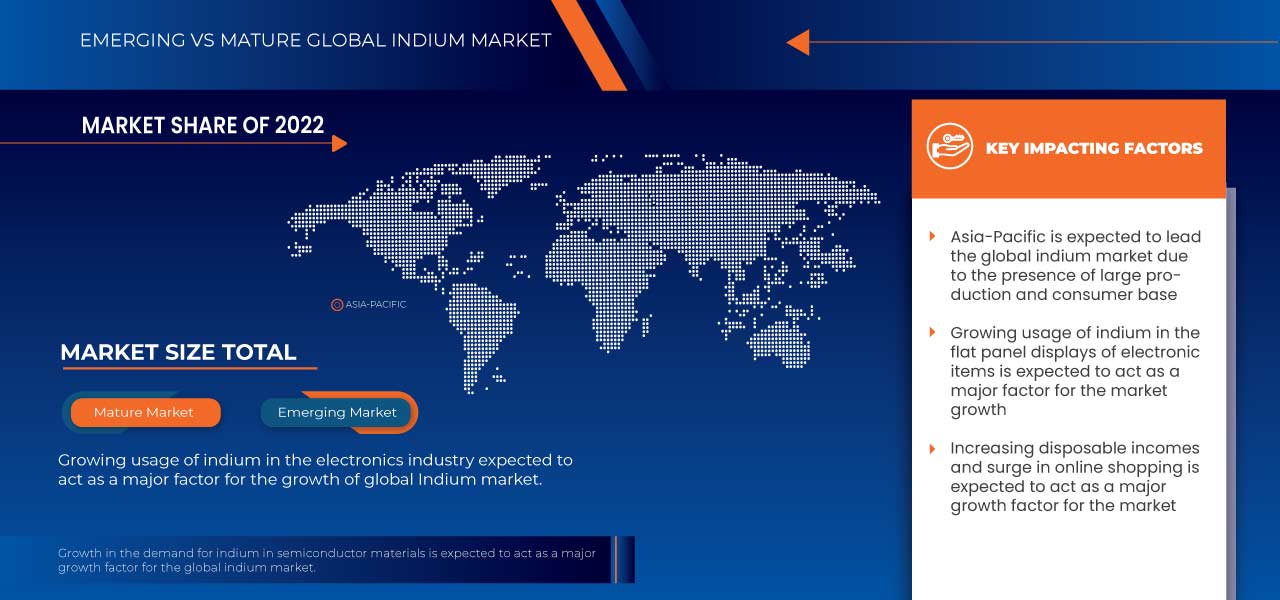
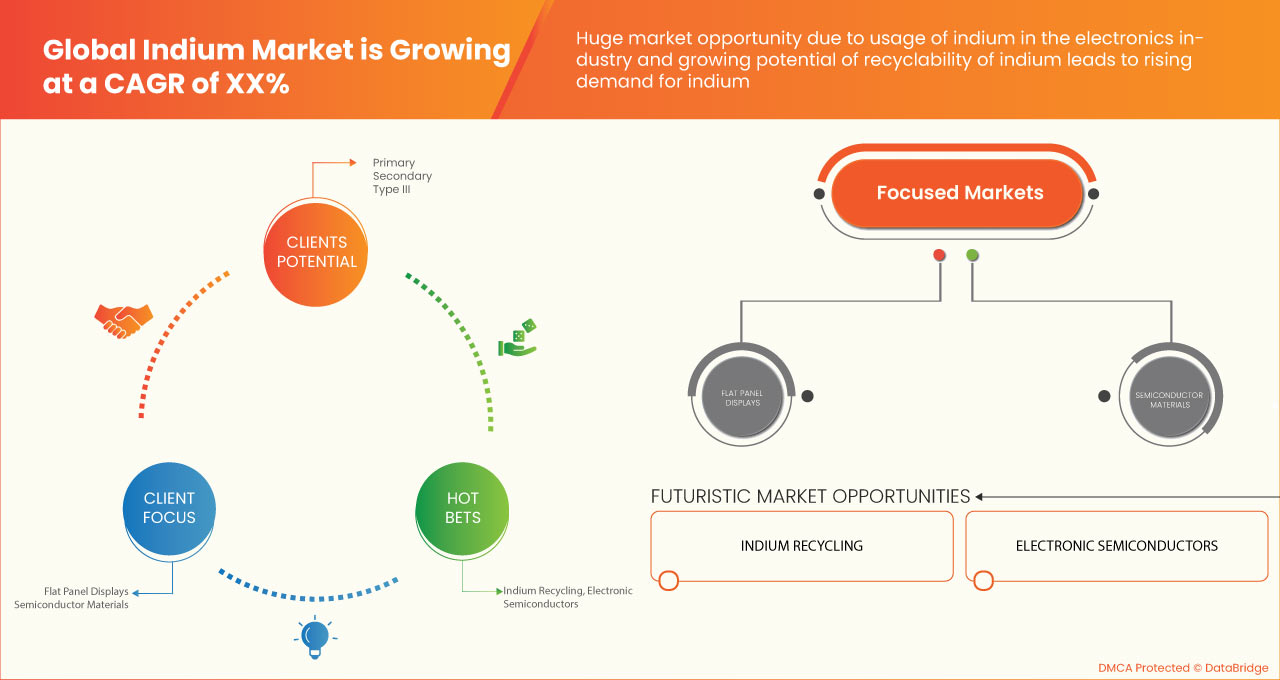
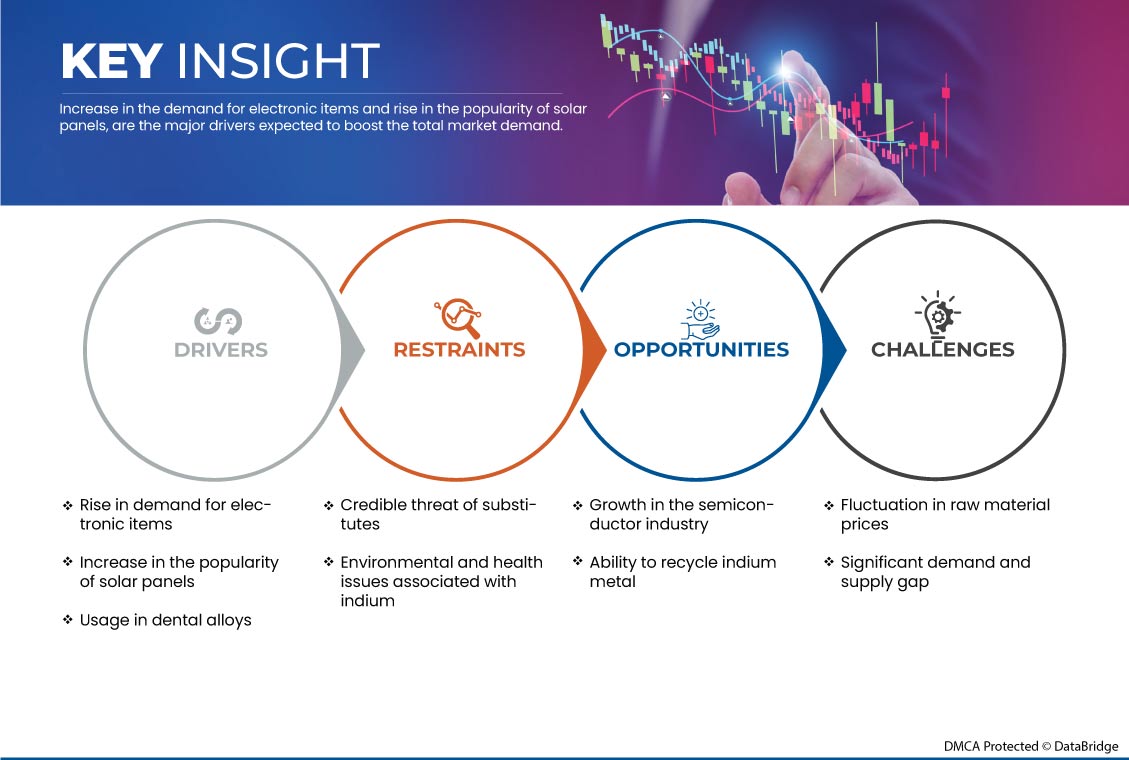
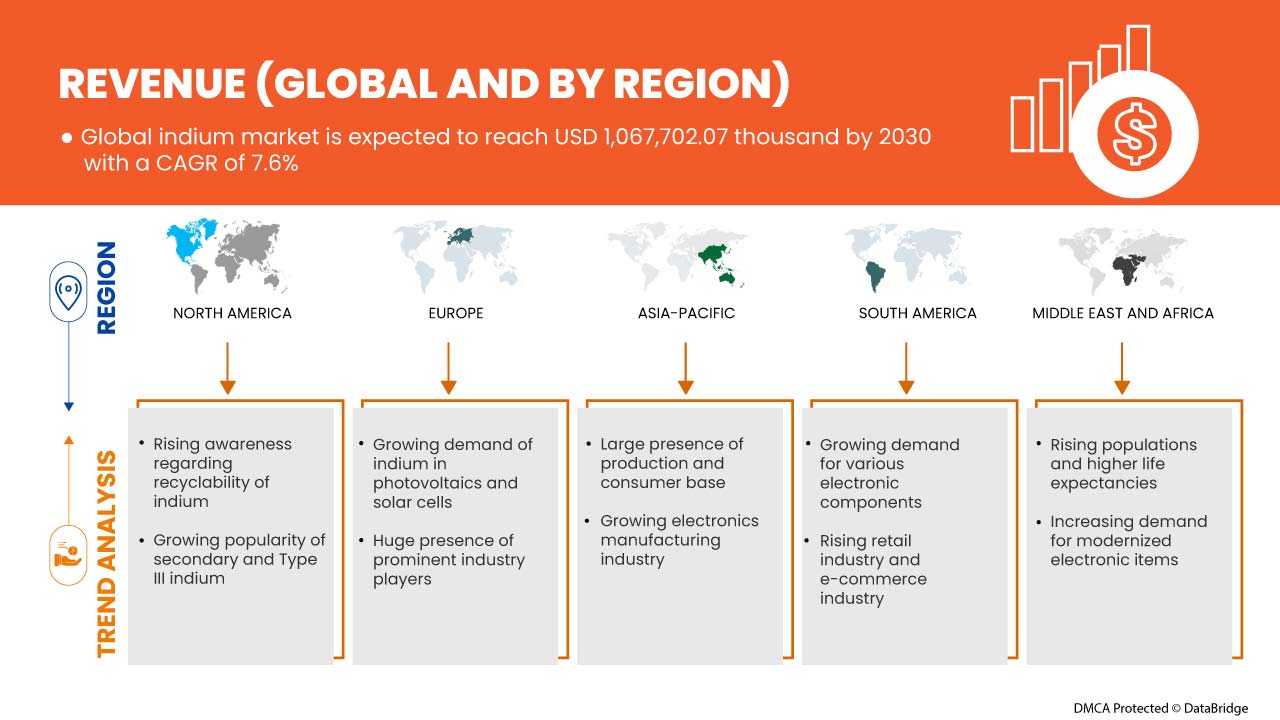
Se espera que el mercado mundial de indio gane un crecimiento significativo en el período de pronóstico de 2023 a 2030. Data Bridge Market Research analiza que el mercado está creciendo con una CAGR del 7,6% en el período de pronóstico de 2023 a 2030 y se espera que alcance los USD 1.067.702,07 millones para 2030. El principal factor que impulsa el crecimiento del mercado de indio es la creciente demanda de artículos electrónicos. Se espera que la creciente popularidad de los paneles solares y su uso en aleaciones dentales impulsen el crecimiento del mercado mundial de indio.
Se espera que el crecimiento de la industria de semiconductores y la capacidad de reciclar el metal indio brinden oportunidades en el mercado mundial del indio. Sin embargo, se prevé que las fluctuaciones en los precios de las materias primas y las brechas significativas entre la oferta y la demanda supongan un desafío para el crecimiento del mercado. Las principales limitaciones que pueden afectar negativamente al mercado mundial del indio son la amenaza creíble de los sustitutos y los problemas ambientales y de salud asociados con el indio.
El informe del mercado mundial del indio proporciona detalles sobre la participación de mercado, los nuevos desarrollos y el impacto de los actores del mercado nacional y localizado, analiza las oportunidades en términos de nuevos segmentos de ingresos, cambios en las regulaciones del mercado, aprobaciones de productos, decisiones estratégicas, lanzamientos de productos, expansiones geográficas e innovaciones tecnológicas en el mercado. Póngase en contacto con nosotros para obtener un informe de analistas para comprender el análisis y el escenario del mercado. Nuestro equipo lo ayudará a crear una solución que tenga un impacto en los ingresos para lograr su objetivo deseado.
|
Métrica del informe |
Detalles |
|
Período de pronóstico |
2023 a 2030 |
|
Año base |
2022 |
|
Años históricos |
2021 (Personalizable para 2019 - 2014) |
|
Unidades cuantitativas |
Ingresos en millones de USD |
|
Segmentos cubiertos |
Por producto (primario, secundario y tipo III), aplicación (pantallas planas, materiales semiconductores, energía fotovoltaica , soldaduras, aleaciones, materiales de interfaz térmica y baterías) |
|
Países cubiertos |
EE. UU., Canadá, México, Reino Unido, Rusia, Francia, España, Italia, Alemania, Turquía, Países Bajos, Suiza, Bélgica, Resto de Europa, Japón, China, Corea del Sur, India, Singapur, Tailandia, Indonesia, Malasia, Filipinas, Australia y Nueva Zelanda, Resto de Asia-Pacífico, Brasil, Argentina, Resto de Sudamérica, Egipto, Arabia Saudita, Emiratos Árabes Unidos, Sudáfrica, Israel y Resto de Medio Oriente y África |
|
Actores del mercado cubiertos |
Entre otras, se encuentran Nippon Rare Metal Inc., Umicore, Teck Resources Limited, Nyrstar, Avalon Advanced Materials Inc., Ahpmat.com., Indium Corporation, Lipmann Walton & Co. Ltd, Zhuzhou Keneng New Material Co., Ltd. Inc., ESPI Metals, AIM Metals & Alloys LP, DOWA Electronics Materials Co. Ltd. y Xinlian Environmental Protection Technology Co., Ltd.. |
Definición de mercado
El indio es un metal con diversas propiedades distintivas y es un metal blando de color blanco plateado que se encuentra en la naturaleza y se combina con zinc y otros metales. Tiene propiedades únicas, como una unión exclusiva con soldadura en frío, una alta tasa de transferencia térmica, sustancias no metálicas, propiedades confiables a temperaturas criogénicas y suavidad.
Dinámica del mercado mundial del indio
En esta sección se aborda la comprensión de los factores impulsores, las ventajas, las oportunidades, las limitaciones y los desafíos del mercado. Todo esto se analiza en detalle a continuación:
Conductores
- Aumento de la demanda de artículos electrónicos
La demanda de artículos electrónicos como teléfonos inteligentes , tabletas , pantallas planas, computadoras portátiles y monitores ha aumentado en todo el mundo. La demanda de estos productos electrónicos se atribuye a varias razones, como el desarrollo de nuevas tecnologías, el aumento de los ingresos disponibles y la mejora del nivel de vida que han animado a los clientes a comprarlos. La reciente pandemia de COVID-19 ha hecho florecer las ventas de estos productos, ya que la mayoría de los empleados y estudiantes trabajaban y estudiaban desde casa, respectivamente. Los avances tecnológicos han encontrado su uso en múltiples campos, incluido el desarrollo de aplicaciones, el software, la inteligencia artificial, la atención médica personalizada y la robótica, que han aumentado aún más la demanda de este tipo de equipos. Además, varios países en desarrollo están experimentando una transformación digital, lo que impulsa aún más las ventas de estos productos electrónicos.
- Aumento de la popularidad de los paneles solares
La luz solar es una fuente de energía renovable. La producción y el suministro de energía solar son indefinidos. En comparación con otras fuentes de energía, como los combustibles fósiles, que no son renovables, la producción de energía solar es más sencilla y menos costosa. El uso de la energía solar ni siquiera contribuye al calentamiento global. La arquitectura solar, la energía solar concentrada, las células y los paneles fotovoltaicos son algunos ejemplos de tecnología de energía solar.
El indio es un metal que se utiliza en la producción de paneles solares. Aunque la demanda de indio ha sido baja en los últimos tiempos, es necesario para la energía fotovoltaica de heterojunción. Debido a su transparencia óptica, propiedades de conductividad eléctrica y resistencia química a la humedad, los óxidos de indio y estaño son materiales ampliamente utilizados en paneles solares.
- Uso en aleaciones dentales
Las aleaciones que se utilizan para fabricar prótesis dentales suelen tener como metales principales oro, plata y paladio, además de un 0,5% a un 10% de indio añadido. La resistencia a la corrosión y la dureza de los implantes dentales se pueden aumentar considerablemente utilizando una cantidad mínima de indio metálico. Además, los empastes de amalgama dental suelen incluir indio. Para evitar que el empaste se vuelva peligroso, el indio ayuda a retener el mercurio. Por lo tanto, el indio ayuda a proteger a las personas de los efectos secundarios tóxicos del mercurio en los empastes de amalgama dental.
Oportunidades
- Crecimiento en la industria de semiconductores
El alto punto de ebullición, la resistencia a la corrosión y la baja resistencia son algunas de las propiedades del indio, por lo que se utiliza ampliamente en la industria de los semiconductores. Los compuestos a base de indio, como el tricloruro de indio, son bien conocidos por su uso en la construcción de capas de semiconductores, como circuitos electrónicos, láseres y LED. Además, el indio tiene aplicaciones en transistores de alta y baja temperatura. El indio también se utiliza en el montaje solar como semiconductor de cobre, indio, galio y seleniuro. Esta aplicación de alta gama del indio en las industrias creará aún más oportunidades para aumentar las ventas de los productos en los que se utiliza el indio.
- Capacidad de reciclar el metal indio
Debido a su rendimiento en semiconductores y optoelectrónica, el indio ha ganado cada vez más atención. El indio es un recurso estratégico crucial que la Comisión Europea ha catalogado como uno de los recursos clave. No existen minerales de indio propios, sino que se produce principalmente a partir de subproductos de plomo y zinc.
Como el indio se utiliza ampliamente en las pantallas LCD, se recicla el indio de dichos paneles. Las pantallas LCD dañadas se recogen y se desmontan de forma manual o automática.
Restricciones
- Cuestiones ambientales y de salud asociadas al indio
El indio ha contaminado y afectado negativamente al medio ambiente y a nuestra salud debido a su uso extensivo en diversas aplicaciones. La cantidad de indio en la corteza terrestre es de aproximadamente 0,052 ppm, y normalmente se recupera como subproducto de la fabricación de zinc y cobre porque no forma fácilmente sus minerales. Los impactos adversos de la minería son la deforestación, los hábitats de la pesca y la vida silvestre, el patrón irregular de las precipitaciones y la alteración ecológica. Además de las minas en sí, la infraestructura construida para ayudar a las operaciones mineras, como carreteras, líneas eléctricas y vías férreas, influye en las rutas de migración de los animales y empeora la diversidad del hábitat. Estos impactos ambientales negativos frenan el crecimiento del mercado mundial del indio.
- Baja concentración en la corteza terrestre y problemas relacionados con la extracción
El indio es un metal ampliamente aceptado que se aplica en diversos campos, como los artículos electrónicos de pantalla plana, los dispositivos fotovoltaicos y los dispositivos semiconductores. Debido a sus amplias aplicaciones, el indio es uno de los metales más demandados. Dentro de la corteza terrestre, el indio se encuentra en cantidades muy bajas, alrededor de 160 ppb en peso. La producción mundial de indio representa tan solo 800 toneladas por año. Además, una cantidad tan baja de indio ha aumentado el precio del indio puro hasta alcanzar los 900 dólares estadounidenses por kilogramo. Una producción tan baja, una menor concentración en la corteza terrestre y una alta demanda de indio por parte de las industrias han estado resistiendo el crecimiento del mercado mundial del indio.
Desafíos
- Fluctuación de los precios de las materias primas
El indio se utiliza a diario en productos como LED, dispositivos de pantalla plana, soldaduras, paneles solares y muchos más. Sin embargo, el indio es un subproducto obtenido de los minerales de cobre y zinc, por lo que no tiene minerales propios. Por lo tanto, el precio de producción del indio depende de la demanda y los precios de los metales obtenidos de dichos minerales. Además, es uno de los elementos más escasos que se encuentran en la corteza terrestre. Los precios del indio también varían en función de la competencia de los usuarios finales para obtenerlo.
Cualquier uso nuevo y popular podría cambiar significativamente la demanda general, que podría expandirse más rápidamente que la capacidad disponible. Esto podría continuar durante aproximadamente una década o más, dependiendo del tiempo necesario para aumentar drásticamente la capacidad de producción.
- Brecha significativa entre demanda y oferta
Una discrepancia entre la oferta y la demanda de un producto se conoce como brecha entre la oferta y la demanda. El indio, como metal de tierras raras, es uno de los más raros que se encuentran en la corteza terrestre. En el caso del indio, el 95 % de la producción se realiza a partir del procesamiento de minerales de zinc. La producción de indio se ve perjudicada porque no se produce en estado nativo. El indio se encuentra en minerales metálicos como el zinc y el estaño. Por lo tanto, la demanda y la oferta de indio también dependen de otros metales como el zinc. Esta brecha conduce además a la volatilidad de los precios de la materia prima del indio. Dicha volatilidad puede influir en los precios de los productos finales y hacer que fluctúen.
China produce más del 50% del indio refinado del mundo. En los últimos tres años, China ha producido alrededor de 1.000 TM de indio al año y también ha almacenado más de 3.000 TM .
Desarrollo reciente
- En diciembre de 2022, Umicore y PowerCo, una empresa de baterías de Volkswagen, ampliaron su colaboración en materiales para baterías. Están explorando un acuerdo estratégico de suministro a largo plazo para abastecer a la futura gigafábrica de baterías de PowerCo para vehículos eléctricos (VE) en América del Norte. Este desarrollo ayudará a fortalecer las operaciones de la empresa.
Alcance del mercado mundial del indio
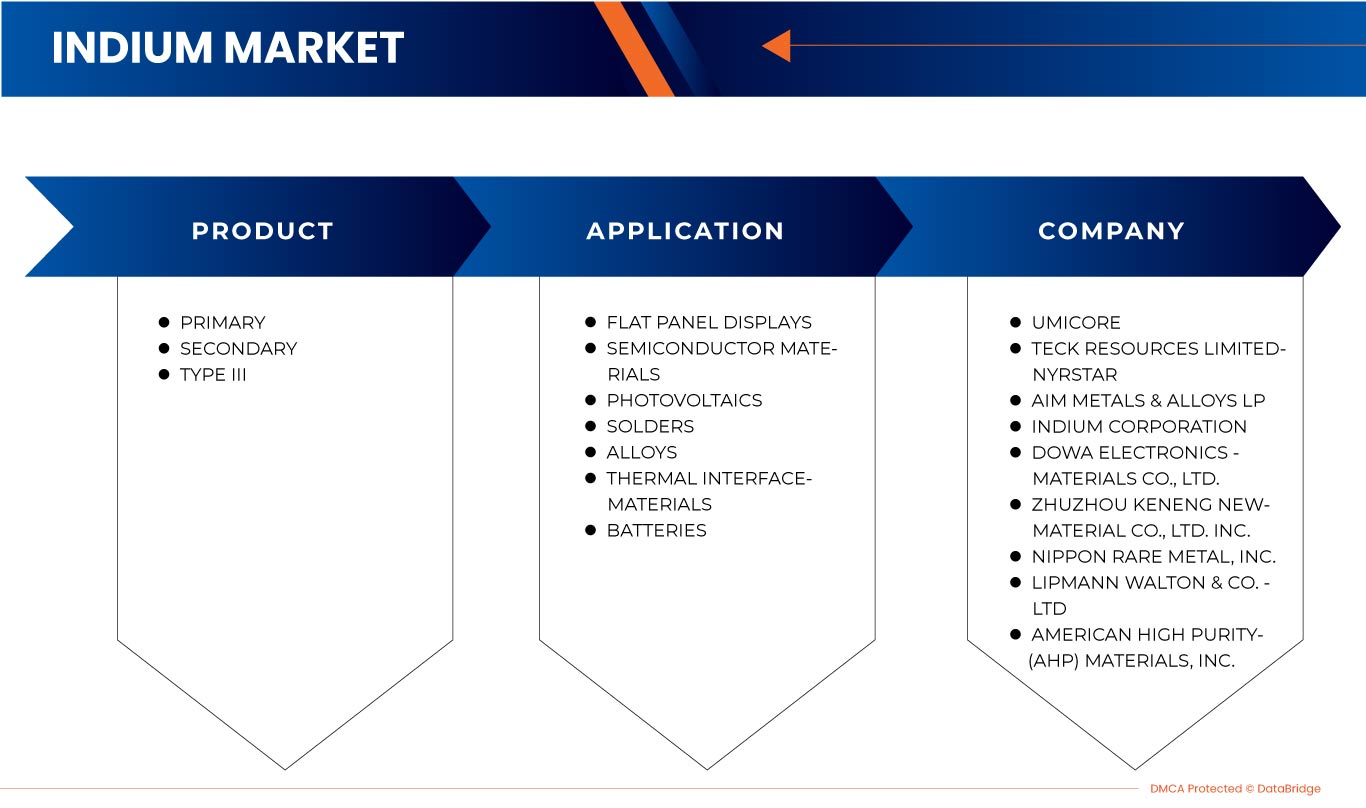
El mercado mundial del indio se clasifica en función del producto y la aplicación. El crecimiento entre estos segmentos le ayudará a analizar los principales segmentos de crecimiento en las industrias y brindará a los usuarios una valiosa descripción general del mercado y conocimientos del mercado para tomar decisiones estratégicas a fin de identificar las principales aplicaciones del mercado.
Producto
- Primario
- Secundario
- Tipo III
Según el producto, el mercado mundial de indio se clasifica en tres segmentos: primario, secundario y tipo III.
Solicitud
- Pantallas planas
- Materiales semiconductores
- Fotovoltaica
- Soldaduras
- Aleaciones
- Materiales de interfaz térmica
- Baterías
Según la aplicación, el mercado global de indio se clasifica en siete segmentos: pantallas planas, materiales semiconductores, energía fotovoltaica, soldaduras, aleaciones, materiales de interfaz térmica y baterías.
Análisis y perspectivas regionales del mercado mundial del indio
El mercado mundial del indio está segmentado según el producto y la aplicación.
Los países del mercado mundial de indio son EE. UU., Canadá, México, Reino Unido, Rusia, Francia, España, Italia, Alemania, Turquía, Países Bajos, Suiza, Bélgica, resto de Europa, Japón, China, Corea del Sur, India, Singapur, Tailandia, Indonesia, Malasia, Filipinas, Australia y Nueva Zelanda, y el resto de Asia-Pacífico, Brasil, Argentina, resto de Sudamérica, Egipto, Arabia Saudita, Emiratos Árabes Unidos, Sudáfrica, Israel y el resto de Medio Oriente y África.
Estados Unidos domina la región de América del Norte debido a la creciente demanda de artículos electrónicos. Se espera que Alemania domine el mercado de indio en Europa debido a la creciente demanda de indio en la región. Sudáfrica dominó el mercado de indio en Oriente Medio y África, aumentando el uso de indio en la región.
La sección de países del informe también proporciona factores individuales que impactan en el mercado y cambios en la regulación del mercado que afectan las tendencias actuales y futuras del mercado. El análisis de los puntos de datos de la cadena de valor aguas abajo y aguas arriba, las tendencias técnicas, el análisis de las cinco fuerzas de Porter y los estudios de casos son algunos de los indicadores utilizados para pronosticar el escenario del mercado para países individuales. Además, la presencia y disponibilidad de marcas globales y sus desafíos afrontados debido a la competencia grande o escasa de las marcas locales y nacionales, el impacto de los aranceles nacionales y las rutas comerciales se consideran al proporcionar un análisis de pronóstico de los datos del país.
Análisis del panorama competitivo y de la cuota de mercado mundial del indio
El panorama competitivo del mercado mundial del indio ofrece detalles por competidores. Los detalles incluidos son la descripción general de la empresa, las finanzas de la empresa, los ingresos generados, el potencial de mercado, la inversión en investigación y desarrollo, las nuevas iniciativas de mercado, los sitios e instalaciones de producción, las fortalezas y debilidades de la empresa, el lanzamiento de productos, los procesos de prueba de productos, las aprobaciones de productos, las patentes, la amplitud y la variedad de productos, el dominio de las aplicaciones y la curva de supervivencia de la tecnología. Los puntos de datos anteriores proporcionados solo están relacionados con el enfoque de la empresa en el mercado mundial del indio.
Entre los participantes destacados que operan en el mercado mundial del indio se encuentran Nippon Rare Metal, Inc., Umicore, Teck Resources Limited, Nyrstar, Avalon Advanced Materials Inc., Ahpmat.com. Indium Corporation, Lipmann Walton & Co. Ltd, Zhuzhou Keneng New Material Co., Ltd. Inc., ESPI Metals, AIM Metals & Alloys LP, DOWA Electronics Materials Co., Ltd. y Xinlian Environmental Protection Technology Co., Ltd., entre otros.
SKU-
Obtenga acceso en línea al informe sobre la primera nube de inteligencia de mercado del mundo

- Panel de análisis de datos interactivo
- Panel de análisis de empresas para oportunidades con alto potencial de crecimiento
- Acceso de analista de investigación para personalización y consultas
- Análisis de la competencia con panel interactivo
- Últimas noticias, actualizaciones y análisis de tendencias
- Aproveche el poder del análisis de referencia para un seguimiento integral de la competencia
Tabla de contenido
1 INTRODUCTION
1.1 OBJECTIVES OF THE STUDY
1.2 MARKET DEFINITION
1.3 OVERVIEW OF GLOBAL INDIUM MARKET
1.4 LIMITATIONS
1.5 MARKETS COVERED
2 MARKET SEGMENTATION
2.1 MARKETS COVERED
2.2 GEOGRAPHICAL SCOPE
2.3 YEARS CONSIDERED FOR THE STUDY
2.4 CURRENCY AND PRICING
2.5 DBMR TRIPOD DATA VALIDATION MODEL
2.6 PURITY LIFELINE CURVE
2.7 MULTIVARIATE MODELING
2.8 PRIMARY INTERVIEWS WITH KEY OPINION LEADERS
2.9 DBMR MARKET POSITION GRID
2.1 MARKET END-USER COVERAGE GRID
2.11 DBMR MARKET CHALLENGE MATRIX
2.12 DBMR VENDOR SHARE ANALYSIS
2.13 IMPORT-EXPORT DATA
2.14 SECONDARY SOURCES
2.15 ASSUMPTIONS
3 EXECUTIVE SUMMARY
4 PREMIUM INSIGHTS
4.1 IMPORT-EXPORT SCENARIO
4.2 PRICING ANALYSIS
4.3 PRODUCTION CONSUMPTION ANALYSIS
4.4 SUBSTITUTE COMPETITIVE ANALYSIS
4.5 REGULATION COVERAGE
5 MARKET OVERVIEW
5.1 DRIVERS
5.1.1 RISE IN DEMAND FOR ELECTRONIC ITEMS
5.1.2 INCREASE IN THE POPULARITY OF SOLAR PANELS
5.1.3 USAGE IN DENTAL ALLOYS
5.1.4 APPLICATION IN BALL BEARINGS MANUFACTURING AND FIRE SPRINKLER SYSTEM
5.2 RESTRAINTS
5.2.1 CREDIBLE THREAT OF SUBSTITUTES
5.2.2 ENVIRONMENTAL AND HEALTH ISSUES ASSOCIATED WITH INDIUM
5.2.3 LOW CONCENTRATION IN EARTH'S CRUST AND EXTRACTION-RELATED ISSUES
5.3 OPPORTUNITIES
5.3.1 GROWTH IN THE SEMICONDUCTOR INDUSTRY
5.3.2 ABILITY TO RECYCLE INDIUM METAL
5.4 CHALLENGES
5.4.1 FLUCTUATION IN RAW MATERIAL PRICES
5.4.2 SIGNIFICANT DEMAND AND SUPPLY GAP
6 GLOBAL INDIUM MARKET, BY PRODUCT
6.1 OVERVIEW
6.2 PRIMARY
6.3 SECONDARY
6.4 TYPE III
7 GLOBAL INDIUM MARKET, BY APPLICATION
7.1 OVERVIEW
7.2 FLAT PANEL DISPLAYS
7.2.1 TELEVISION & DIGITAL SIGNAGE
7.2.2 PC & LAPTOP
7.2.3 SMARTPHONE & TABLETS
7.2.4 VEHICLE DISPLAY
7.2.5 SMART WEARABLES
7.2.6 OTHERS
7.3 SEMICONDUCTOR MATERIALS
7.3.1 ALUMINIUM GALLIUM INDIUM PHOSPHIDE
7.3.2 INDIUM GALLIUM ARSENIDE
7.4 PHOTOVOLTAICS
7.4.1 GROUND MOUNTED
7.4.2 ROOFTOP
7.4.3 OTHERS
7.5 SOLDERS
7.5.1 WIRES
7.5.2 PASTE
7.5.3 PERFORMS
7.5.4 BARS
7.5.5 OTHERS
7.6 ALLOYS
7.6.1 INDIUM-TIN ALLOY
7.6.2 INDIUM-LEAD ALLOY
7.6.3 INDIUM-LEAD ALLOY
7.7 THERMAL INTERFACE MATERIALS
7.8 BATTERIES
7.8.1 AUTOMOTIVE
7.8.2 PORTABLE
7.8.3 INDUSTRIAL
8 GLOBAL INDIUM MARKET, BY REGION
8.1 OVERVIEW
8.2 ASIA-PACIFIC
8.2.1 CHINA
8.2.2 JAPAN
8.2.3 SOUTH KOREA
8.2.4 INDIA
8.2.5 AUSTRALIA & NEW ZEALAND
8.2.6 SINGAPORE
8.2.7 THAILAND
8.2.8 INDONESIA
8.2.9 MALAYSIA
8.2.10 PHILIPPINES
8.2.11 REST OF ASIA-PACIFIC
8.3 NORTH AMERICA
8.3.1 U.S.
8.3.2 CANADA
8.3.3 MEXICO
8.4 EUROPE
8.4.1 GERMANY
8.4.2 U.K.
8.4.3 FRANCE
8.4.4 ITALY
8.4.5 SPAIN
8.4.6 RUSSIA
8.4.7 TURKEY
8.4.8 NETHERLANDS
8.4.9 BELGIUM
8.4.10 SWITZERLAND
8.4.11 REST OF EUROPE
8.5 SOUTH AMERICA
8.5.1 BRAZIL
8.5.2 ARGENTINA
8.5.3 REST OF SOUTH AMERICA
8.6 MIDDLE EAST AND AFRICA
8.6.1 SOUTH AFRICA
8.6.2 ISRAEL
8.6.3 SAUDI ARABIA
8.6.4 UNITED ARAB EMIRATES
8.6.5 EGYPT
8.6.6 REST OF MIDDLE EAST AND AFRICA
9 GLOBAL INDIUM MARKET: COMPANY LANDSCAPE
9.1 COMPANY SHARE ANALYSIS: GLOBAL
9.2 COMPANY SHARE ANALYSIS: NORTH AMERICA
9.3 COMPANY SHARE ANALYSIS: EUROPE
9.4 COMPANY SHARE ANALYSIS: ASIA-PACIFIC
9.5 EXPANSION
9.6 COLLABORATION
9.7 AWARD
9.8 EVENTS
9.9 RECOGNITION
10 SWOT ANALYSIS
11 COMPANY PROFILES
11.1 UMICORE
11.1.1 COMPANY SNAPSHOT
11.1.2 REVENUE ANALYSIS
11.1.3 COMPANY SHARE ANALYSIS
11.1.4 PRODUCT PORTFOLIO
11.1.5 RECENT UPDATES
11.2 TECK RESOURCES LIMITED
11.2.1 COMPANY SNAPSHOT
11.2.2 REVENUE ANALYSIS
11.2.3 COMPANY SHARE ANALYSIS
11.2.4 PRODUCT PORTFOLIO
11.2.5 RECENT UPDATE
11.3 NYRSTAR
11.3.1 COMPANY SNAPSHOT
11.3.2 COMPANY SHARE ANALYSIS
11.3.3 PRODUCT PORTFOLIO
11.3.4 RECENT UPDATES
11.4 AIM METALS & ALLOYS LP
11.4.1 COMPANY SNAPSHOT
11.4.2 COMPANY SHARE ANALYSIS
11.4.3 PRODUCT PORTFOLIO
11.4.4 RECENT UPDATE
11.5 INDIUM CORPORATION
11.5.1 COMPANY SNAPSHOT
11.5.2 COMPANY SHARE ANALYSIS
11.5.3 PRODUCT PORTFOLIO
11.5.4 RECENT UPDATE
11.6 AHPMAT.COM
11.6.1 COMPANY SNAPSHOT
11.6.2 PRODUCT PORTFOLIO
11.6.3 RECENT UPDATES
11.7 AVALON ADVANCED MATERIALS INC.
11.7.1 COMPANY SNAPSHOT
11.7.2 PRODUCT PORTFOLIO
11.7.3 RECENT UPDATE
11.8 DOWA ELECTRONICS MATERIALS CO., LTD.
11.8.1 COMPANY SNAPSHOT
11.8.2 PRODUCT PORTFOLIO
11.8.3 RECENT UPDATES
11.9 ESPI METALS, INC.
11.9.1 COMPANY SNAPSHOT
11.9.2 PRODUCT PORTFOLIO
11.9.3 RECENT UPDATES
11.1 LIPMANN WALTON & CO. LTD
11.10.1 COMPANY SNAPSHOT
11.10.2 PRODUCT PORTFOLIO
11.10.3 RECENT UPDATES
11.11 NIPPON RARE METALS, INC.
11.11.1 COMPANY SNAPSHOT
11.11.2 PRODUCT PORTFOLIO
11.11.3 RECENT UPDATE
11.12 XINLIAN ENVIRONMENTAL PROTECTION TECHNOLOGY CO., LTD.
11.12.1 COMPANY SNAPSHOT
11.12.2 PRODUCT PORTFOLIO
11.12.3 RECENT UPDATES
11.13 ZHUZHOU KENENG NEW MATERIALS CO., LTD.
11.13.1 COMPANY SNAPSHOT
11.13.2 PRODUCT PORTFOLIO
11.13.3 RECENT UPDATE
12 QUESTIONNAIRE
13 RELATED REPORTS
Lista de Tablas
TABLE 1 IMPORT DATA OF ARTICLES OF NIOBIUM "COLUMBIUM", GALLIUM, INDIUM, VANADIUM, AND GERMANIUM, N.E.S.; HS CODE – 811299 (USD THOUSAND)
TABLE 2 EXPORT DATA OF ARTICLES OF NIOBIUM "COLUMBIUM", GALLIUM, INDIUM, VANADIUM, AND GERMANIUM, N.E.S.; HS CODE – 811299 (USD THOUSAND)
TABLE 3 SUBSTITUTE MATERIALS FOR INDIUM ALONG WITH THEIR CHARACTERISTICS, APPLICATIONS, AND MANUFACTURING COMPANIES
TABLE 4 REGULATORY FRAMEWORK
TABLE 5 GLOBAL INDIUM MARKET, BY PRODUCT, 2021-2030 (USD THOUSAND)
TABLE 6 GLOBAL INDIUM MARKET, BY PRODUCT, 2021-2030 (TONS)
TABLE 7 GLOBAL PRIMARY IN INDIUM MARKET, BY REGION, 2021-2030 (USD THOUSAND)
TABLE 8 GLOBAL PRIMARY IN INDIUM MARKET, BY REGION, 2021-2030 (TONS)
TABLE 9 GLOBAL SECONDARY IN INDIUM MARKET, BY REGION, 2021-2030 (USD THOUSAND)
TABLE 10 GLOBAL SECONDARY IN INDIUM MARKET, BY REGION, 2021-2030 (TONS)
TABLE 11 GLOBAL TYPE III IN INDIUM MARKET, BY REGION, 2021-2030 (USD THOUSAND)
TABLE 12 GLOBAL TYPE III IN INDIUM MARKET, BY REGION, 2021-2030 (TONS)
TABLE 13 GLOBAL INDIUM MARKET, BY APPLICATION, 2021-2030 (USD THOUSAND)
TABLE 14 GLOBAL FLAT PANEL DISPLAYS IN INDIUM MARKET, BY REGION, 2021-2030 (USD THOUSAND)
TABLE 15 GLOBAL FLAT PANEL DISPLAYS IN INDIUM MARKET, BY TYPE, 2021-2030 (USD THOUSAND)
TABLE 16 GLOBAL SEMICONDUCTOR MATERIALS IN INDIUM MARKET, BY REGION, 2021-2030 (USD THOUSAND)
TABLE 17 GLOBAL SEMICONDUCTOR MATERIALS IN INDIUM MARKET, BY TYPE, 2021-2030 (USD THOUSAND)
TABLE 18 GLOBAL PHOTOVOLTAICS IN INDIUM MARKET, BY REGION, 2021-2030 (USD THOUSAND)
TABLE 19 GLOBAL PHOTOVOLTAICS IN INDIUM MARKET, BY TYPE, 2021-2030 (USD THOUSAND)
TABLE 20 GLOBAL SOLDERS IN INDIUM MARKET, BY REGION, 2021-2030 (USD THOUSAND)
TABLE 21 GLOBAL SOLDERS IN INDIUM MARKET, BY TYPE, 2021-2030 (USD THOUSAND)
TABLE 22 GLOBAL ALLOYS IN INDIUM MARKET, BY REGION, 2021-2030 (USD THOUSAND)
TABLE 23 GLOBAL ALLOYS IN INDIUM MARKET, BY TYPE, 2021-2030 (USD THOUSAND)
TABLE 24 GLOBAL THERMAL INTERFACE MATERIALS IN INDIUM MARKET, BY REGION, 2021-2030 (USD THOUSAND)
TABLE 25 GLOBAL BATTERIES IN INDIUM MARKET, BY REGION, 2021-2030 (USD THOUSAND)
TABLE 26 GLOBAL BATTERIES IN INDIUM MARKET, BY TYPE, 2021-2030 (USD THOUSAND)
TABLE 27 GLOBAL INDIUM MARKET, BY REGION, 2021-2030 (USD THOUSAND)
TABLE 28 GLOBAL INDIUM MARKET, BY REGION, 2021-2030 (TONS)
TABLE 29 ASIA-PACIFIC INDIUM MARKET, BY COUNTRY, 2021-2030 (USD THOUSAND)
TABLE 30 ASIA-PACIFIC INDIUM MARKET, BY COUNTRY, 2021-2030 (TONS)
TABLE 31 ASIA-PACIFIC INDIUM MARKET, BY PRODUCT, 2021-2030 (USD THOUSAND)
TABLE 32 ASIA-PACIFIC INDIUM MARKET, BY PRODUCT, 2021-2030 (TONS)
TABLE 33 ASIA-PACIFIC INDIUM MARKET, BY APPLICATION, 2021-2030 (USD THOUSAND)
TABLE 34 ASIA-PACIFIC FLAT PANEL DISPLAYS IN INDIUM MARKET, BY TYPE, 2021-2030 (USD THOUSAND)
TABLE 35 ASIA-PACIFIC SEMICONDUCTOR MATERIALS IN INDIUM MARKET, BY TYPE, 2021-2030 (USD THOUSAND)
TABLE 36 ASIA-PACIFIC PHOTOVOLTAICS IN INDIUM MARKET, BY TYPE, 2021-2030 (USD THOUSAND)
TABLE 37 ASIA-PACIFIC SOLDERS IN INDIUM MARKET, BY TYPE, 2021-2030 (USD THOUSAND)
TABLE 38 ASIA-PACIFIC ALLOYS IN INDIUM MARKET, BY TYPE, 2021-2030 (USD THOUSAND)
TABLE 39 ASIA-PACIFIC BATTERIES IN INDIUM MARKET, BY TYPE, 2021-2030 (USD THOUSAND)
TABLE 40 CHINA INDIUM MARKET, BY PRODUCT, 2021-2030 (USD THOUSAND)
TABLE 41 CHINA INDIUM MARKET, BY PRODUCT, 2021-2030 (TONS)
TABLE 42 CHINA INDIUM MARKET, BY APPLICATION, 2021-2030 (USD THOUSAND)
TABLE 43 CHINA FLAT PANEL DISPLAYS IN INDIUM MARKET, BY TYPE, 2021-2030 (USD THOUSAND)
TABLE 44 CHINA SEMICONDUCTOR MATERIALS IN INDIUM MARKET, BY TYPE, 2021-2030 (USD THOUSAND)
TABLE 45 CHINA PHOTOVOLTAICS IN INDIUM MARKET, BY TYPE, 2021-2030 (USD THOUSAND)
TABLE 46 CHINA SOLDERS IN INDIUM MARKET, BY TYPE, 2021-2030 (USD THOUSAND)
TABLE 47 CHINA ALLOYS IN INDIUM MARKET, BY TYPE, 2021-2030 (USD THOUSAND)
TABLE 48 CHINA BATTERIES IN INDIUM MARKET, BY TYPE, 2021-2030 (USD THOUSAND)
TABLE 49 JAPAN INDIUM MARKET, BY PRODUCT, 2021-2030 (USD THOUSAND)
TABLE 50 JAPAN INDIUM MARKET, BY PRODUCT, 2021-2030 (TONS)
TABLE 51 JAPAN INDIUM MARKET, BY APPLICATION, 2021-2030 (USD THOUSAND)
TABLE 52 JAPAN FLAT PANEL DISPLAYS IN INDIUM MARKET, BY TYPE, 2021-2030 (USD THOUSAND)
TABLE 53 JAPAN SEMICONDUCTOR MATERIALS IN INDIUM MARKET, BY TYPE, 2021-2030 (USD THOUSAND)
TABLE 54 JAPAN PHOTOVOLTAICS IN INDIUM MARKET, BY TYPE, 2021-2030 (USD THOUSAND)
TABLE 55 JAPAN SOLDERS IN INDIUM MARKET, BY TYPE, 2021-2030 (USD THOUSAND)
TABLE 56 JAPAN ALLOYS IN INDIUM MARKET, BY TYPE, 2021-2030 (USD THOUSAND)
TABLE 57 JAPAN BATTERIES IN INDIUM MARKET, BY TYPE, 2021-2030 (USD THOUSAND)
TABLE 58 SOUTH KOREA INDIUM MARKET, BY PRODUCT, 2021-2030 (USD THOUSAND)
TABLE 59 SOUTH KOREA INDIUM MARKET, BY PRODUCT, 2021-2030 (TONS)
TABLE 60 SOUTH KOREA INDIUM MARKET, BY APPLICATION, 2021-2030 (USD THOUSAND)
TABLE 61 SOUTH KOREA FLAT PANEL DISPLAYS IN INDIUM MARKET, BY TYPE, 2021-2030 (USD THOUSAND)
TABLE 62 SOUTH KOREA SEMICONDUCTOR MATERIALS IN INDIUM MARKET, BY TYPE, 2021-2030 (USD THOUSAND)
TABLE 63 SOUTH KOREA PHOTOVOLTAICS IN INDIUM MARKET, BY TYPE, 2021-2030 (USD THOUSAND)
TABLE 64 SOUTH KOREA SOLDERS IN INDIUM MARKET, BY TYPE, 2021-2030 (USD THOUSAND)
TABLE 65 SOUTH KOREA ALLOYS IN INDIUM MARKET, BY TYPE, 2021-2030 (USD THOUSAND)
TABLE 66 SOUTH KOREA BATTERIES IN INDIUM MARKET, BY TYPE, 2021-2030 (USD THOUSAND)
TABLE 67 INDIA INDIUM MARKET, BY PRODUCT, 2021-2030 (USD THOUSAND)
TABLE 68 INDIA INDIUM MARKET, BY PRODUCT, 2021-2030 (TONS)
TABLE 69 INDIA INDIUM MARKET, BY APPLICATION, 2021-2030 (USD THOUSAND)
TABLE 70 INDIA FLAT PANEL DISPLAYS IN INDIUM MARKET, BY TYPE, 2021-2030 (USD THOUSAND)
TABLE 71 INDIA SEMICONDUCTOR MATERIALS IN INDIUM MARKET, BY TYPE, 2021-2030 (USD THOUSAND)
TABLE 72 INDIA PHOTOVOLTAICS IN INDIUM MARKET, BY TYPE, 2021-2030 (USD THOUSAND)
TABLE 73 INDIA SOLDERS IN INDIUM MARKET, BY TYPE, 2021-2030 (USD THOUSAND)
TABLE 74 INDIA ALLOYS IN INDIUM MARKET, BY TYPE, 2021-2030 (USD THOUSAND)
TABLE 75 INDIA BATTERIES IN INDIUM MARKET, BY TYPE, 2021-2030 (USD THOUSAND)
TABLE 76 AUSTRALIA & NEW ZEALAND INDIUM MARKET, BY PRODUCT, 2021-2030 (USD THOUSAND)
TABLE 77 AUSTRALIA & NEW ZEALAND INDIUM MARKET, BY PRODUCT, 2021-2030 (TONS)
TABLE 78 AUSTRALIA & NEW ZEALAND INDIUM MARKET, BY APPLICATION, 2021-2030 (USD THOUSAND)
TABLE 79 AUSTRALIA & NEW ZEALAND FLAT PANEL DISPLAYS IN INDIUM MARKET, BY TYPE, 2021-2030 (USD THOUSAND)
TABLE 80 AUSTRALIA & NEW ZEALAND SEMICONDUCTOR MATERIALS IN INDIUM MARKET, BY TYPE, 2021-2030 (USD THOUSAND)
TABLE 81 AUSTRALIA & NEW ZEALAND PHOTOVOLTAICS IN INDIUM MARKET, BY TYPE, 2021-2030 (USD THOUSAND)
TABLE 82 AUSTRALIA & NEW ZEALAND SOLDERS IN INDIUM MARKET, BY TYPE, 2021-2030 (USD THOUSAND)
TABLE 83 AUSTRALIA & NEW ZEALAND ALLOYS IN INDIUM MARKET, BY TYPE, 2021-2030 (USD THOUSAND)
TABLE 84 AUSTRALIA & NEW ZEALAND BATTERIES IN INDIUM MARKET, BY TYPE, 2021-2030 (USD THOUSAND)
TABLE 85 SINGAPORE INDIUM MARKET, BY PRODUCT, 2021-2030 (USD THOUSAND)
TABLE 86 SINGAPORE INDIUM MARKET, BY PRODUCT, 2021-2030 (TONS)
TABLE 87 SINGAPORE INDIUM MARKET, BY APPLICATION, 2021-2030 (USD THOUSAND)
TABLE 88 SINGAPORE FLAT PANEL DISPLAYS IN INDIUM MARKET, BY TYPE, 2021-2030 (USD THOUSAND)
TABLE 89 SINGAPORE SEMICONDUCTOR MATERIALS IN INDIUM MARKET, BY TYPE, 2021-2030 (USD THOUSAND)
TABLE 90 SINGAPORE PHOTOVOLTAICS IN INDIUM MARKET, BY TYPE, 2021-2030 (USD THOUSAND)
TABLE 91 SINGAPORE SOLDERS IN INDIUM MARKET, BY TYPE, 2021-2030 (USD THOUSAND)
TABLE 92 SINGAPORE ALLOYS IN INDIUM MARKET, BY TYPE, 2021-2030 (USD THOUSAND)
TABLE 93 SINGAPORE BATTERIES IN INDIUM MARKET, BY TYPE, 2021-2030 (USD THOUSAND)
TABLE 94 THAILAND INDIUM MARKET, BY PRODUCT, 2021-2030 (USD THOUSAND)
TABLE 95 THAILAND INDIUM MARKET, BY PRODUCT, 2021-2030 (TONS)
TABLE 96 THAILAND INDIUM MARKET, BY APPLICATION, 2021-2030 (USD THOUSAND)
TABLE 97 THAILAND FLAT PANEL DISPLAYS IN INDIUM MARKET, BY TYPE, 2021-2030 (USD THOUSAND)
TABLE 98 THAILAND SEMICONDUCTOR MATERIALS IN INDIUM MARKET, BY TYPE, 2021-2030 (USD THOUSAND)
TABLE 99 THAILAND PHOTOVOLTAICS IN INDIUM MARKET, BY TYPE, 2021-2030 (USD THOUSAND)
TABLE 100 THAILAND SOLDERS IN INDIUM MARKET, BY TYPE, 2021-2030 (USD THOUSAND)
TABLE 101 THAILAND ALLOYS IN INDIUM MARKET, BY TYPE, 2021-2030 (USD THOUSAND)
TABLE 102 THAILAND BATTERIES IN INDIUM MARKET, BY TYPE, 2021-2030 (USD THOUSAND)
TABLE 103 INDONESIA INDIUM MARKET, BY PRODUCT, 2021-2030 (USD THOUSAND)
TABLE 104 INDONESIA INDIUM MARKET, BY PRODUCT, 2021-2030 (TONS)
TABLE 105 INDONESIA INDIUM MARKET, BY APPLICATION, 2021-2030 (USD THOUSAND)
TABLE 106 INDONESIA FLAT PANEL DISPLAYS IN INDIUM MARKET, BY TYPE, 2021-2030 (USD THOUSAND)
TABLE 107 INDONESIA SEMICONDUCTOR MATERIALS IN INDIUM MARKET, BY TYPE, 2021-2030 (USD THOUSAND)
TABLE 108 INDONESIA PHOTOVOLTAICS IN INDIUM MARKET, BY TYPE, 2021-2030 (USD THOUSAND)
TABLE 109 INDONESIA SOLDERS IN INDIUM MARKET, BY TYPE, 2021-2030 (USD THOUSAND)
TABLE 110 INDONESIA ALLOYS IN INDIUM MARKET, BY TYPE, 2021-2030 (USD THOUSAND)
TABLE 111 INDONESIA BATTERIES IN INDIUM MARKET, BY TYPE, 2021-2030 (USD THOUSAND)
TABLE 112 MALAYSIA INDIUM MARKET, BY PRODUCT, 2021-2030 (USD THOUSAND)
TABLE 113 MALAYSIA INDIUM MARKET, BY PRODUCT, 2021-2030 (TONS)
TABLE 114 MALAYSIA INDIUM MARKET, BY APPLICATION, 2021-2030 (USD THOUSAND)
TABLE 115 MALAYSIA FLAT PANEL DISPLAYS IN INDIUM MARKET, BY TYPE, 2021-2030 (USD THOUSAND)
TABLE 116 MALAYSIA SEMICONDUCTOR MATERIALS IN INDIUM MARKET, BY TYPE, 2021-2030 (USD THOUSAND)
TABLE 117 MALAYSIA PHOTOVOLTAICS IN INDIUM MARKET, BY TYPE, 2021-2030 (USD THOUSAND)
TABLE 118 MALAYSIA SOLDERS IN INDIUM MARKET, BY TYPE, 2021-2030 (USD THOUSAND)
TABLE 119 MALAYSIA ALLOYS IN INDIUM MARKET, BY TYPE, 2021-2030 (USD THOUSAND)
TABLE 120 MALAYSIA BATTERIES IN INDIUM MARKET, BY TYPE, 2021-2030 (USD THOUSAND)
TABLE 121 PHILIPPINES INDIUM MARKET, BY PRODUCT, 2021-2030 (USD THOUSAND)
TABLE 122 PHILIPPINES INDIUM MARKET, BY PRODUCT, 2021-2030 (TONS)
TABLE 123 PHILIPPINES INDIUM MARKET, BY APPLICATION, 2021-2030 (USD THOUSAND)
TABLE 124 PHILIPPINES FLAT PANEL DISPLAYS IN INDIUM MARKET, BY TYPE, 2021-2030 (USD THOUSAND)
TABLE 125 PHILIPPINES SEMICONDUCTOR MATERIALS IN INDIUM MARKET, BY TYPE, 2021-2030 (USD THOUSAND)
TABLE 126 PHILIPPINES PHOTOVOLTAICS IN INDIUM MARKET, BY TYPE, 2021-2030 (USD THOUSAND)
TABLE 127 PHILIPPINES SOLDERS IN INDIUM MARKET, BY TYPE, 2021-2030 (USD THOUSAND)
TABLE 128 PHILIPPINES ALLOYS IN INDIUM MARKET, BY TYPE, 2021-2030 (USD THOUSAND)
TABLE 129 PHILIPPINES BATTERIES IN INDIUM MARKET, BY TYPE, 2021-2030 (USD THOUSAND)
TABLE 130 REST OF ASIA-PACIFIC INDIUM MARKET, BY PRODUCT, 2021-2030 (USD THOUSAND)
TABLE 131 REST OF ASIA-PACIFIC INDIUM MARKET, BY PRODUCT, 2021-2030 (TONS)
TABLE 132 NORTH AMERICA INDIUM MARKET, BY COUNTRY, 2021-2030 (USD THOUSAND)
TABLE 133 NORTH AMERICA INDIUM MARKET, BY COUNTRY, 2021-2030 (TONS)
TABLE 134 NORTH AMERICA INDIUM MARKET, BY PRODUCT, 2021-2030 (USD THOUSAND)
TABLE 135 NORTH AMERICA INDIUM MARKET, BY PRODUCT, 2021-2030 (TONS)
TABLE 136 NORTH AMERICA INDIUM MARKET, BY APPLICATION, 2021-2030 (USD THOUSAND)
TABLE 137 NORTH AMERICA FLAT PANEL DISPLAYS IN INDIUM MARKET, BY TYPE, 2021-2030 (USD THOUSAND)
TABLE 138 NORTH AMERICA SEMICONDUCTOR MATERIALS IN INDIUM MARKET, BY TYPE, 2021-2030 (USD THOUSAND)
TABLE 139 NORTH AMERICA PHOTOVOLTAICS IN INDIUM MARKET, BY TYPE, 2021-2030 (USD THOUSAND)
TABLE 140 NORTH AMERICA SOLDERS IN INDIUM MARKET, BY TYPE, 2021-2030 (USD THOUSAND)
TABLE 141 NORTH AMERICA ALLOYS IN INDIUM MARKET, BY TYPE, 2021-2030 (USD THOUSAND)
TABLE 142 NORTH AMERICA BATTERIES IN INDIUM MARKET, BY TYPE, 2021-2030 (USD THOUSAND)
TABLE 143 U.S. INDIUM MARKET, BY PRODUCT, 2021-2030 (USD THOUSAND)
TABLE 144 U.S. INDIUM MARKET, BY PRODUCT, 2021-2030 (TONS)
TABLE 145 U.S. INDIUM MARKET, BY APPLICATION, 2021-2030 (USD THOUSAND)
TABLE 146 U.S. FLAT PANEL DISPLAYS IN INDIUM MARKET, BY TYPE, 2021-2030 (USD THOUSAND)
TABLE 147 U.S. SEMICONDUCTOR MATERIALS IN INDIUM MARKET, BY TYPE, 2021-2030 (USD THOUSAND)
TABLE 148 U.S. PHOTOVOLTAICS IN INDIUM MARKET, BY TYPE, 2021-2030 (USD THOUSAND)
TABLE 149 U.S. SOLDERS IN INDIUM MARKET, BY TYPE, 2021-2030 (USD THOUSAND)
TABLE 150 U.S. ALLOYS IN INDIUM MARKET, BY TYPE, 2021-2030 (USD THOUSAND)
TABLE 151 U.S. BATTERIES IN INDIUM MARKET, BY TYPE, 2021-2030 (USD THOUSAND)
TABLE 152 CANADA INDIUM MARKET, BY PRODUCT, 2021-2030 (USD THOUSAND)
TABLE 153 CANADA INDIUM MARKET, BY PRODUCT, 2021-2030 (TONS)
TABLE 154 CANADA INDIUM MARKET, BY APPLICATION, 2021-2030 (USD THOUSAND)
TABLE 155 CANADA FLAT PANEL DISPLAYS IN INDIUM MARKET, BY TYPE, 2021-2030 (USD THOUSAND)
TABLE 156 CANADA SEMICONDUCTOR MATERIALS IN INDIUM MARKET, BY TYPE, 2021-2030 (USD THOUSAND)
TABLE 157 CANADA PHOTOVOLTAICS IN INDIUM MARKET, BY TYPE, 2021-2030 (USD THOUSAND)
TABLE 158 CANADA SOLDERS IN INDIUM MARKET, BY TYPE, 2021-2030 (USD THOUSAND)
TABLE 159 CANADA ALLOYS IN INDIUM MARKET, BY TYPE, 2021-2030 (USD THOUSAND)
TABLE 160 CANADA BATTERIES IN INDIUM MARKET, BY TYPE, 2021-2030 (USD THOUSAND)
TABLE 161 MEXICO INDIUM MARKET, BY PRODUCT, 2021-2030 (USD THOUSAND)
TABLE 162 MEXICO INDIUM MARKET, BY PRODUCT, 2021-2030 (TONS)
TABLE 163 MEXICO INDIUM MARKET, BY APPLICATION, 2021-2030 (USD THOUSAND)
TABLE 164 MEXICO FLAT PANEL DISPLAYS IN INDIUM MARKET, BY TYPE, 2021-2030 (USD THOUSAND)
TABLE 165 MEXICO SEMICONDUCTOR MATERIALS IN INDIUM MARKET, BY TYPE, 2021-2030 (USD THOUSAND)
TABLE 166 MEXICO PHOTOVOLTAICS IN INDIUM MARKET, BY TYPE, 2021-2030 (USD THOUSAND)
TABLE 167 MEXICO SOLDERS IN INDIUM MARKET, BY TYPE, 2021-2030 (USD THOUSAND)
TABLE 168 MEXICO ALLOYS IN INDIUM MARKET, BY TYPE, 2021-2030 (USD THOUSAND)
TABLE 169 MEXICO BATTERIES IN INDIUM MARKET, BY TYPE, 2021-2030 (USD THOUSAND)
TABLE 170 EUROPE INDIUM MARKET, BY COUNTRY, 2021-2030 (USD THOUSAND)
TABLE 171 EUROPE INDIUM MARKET, BY COUNTRY, 2021-2030 (TONS)
TABLE 172 EUROPE INDIUM MARKET, BY PRODUCT, 2021-2030 (USD THOUSAND)
TABLE 173 EUROPE INDIUM MARKET, BY PRODUCT, 2021-2030 (TONS)
TABLE 174 EUROPE INDIUM MARKET, BY APPLICATION, 2021-2030 (USD THOUSAND)
TABLE 175 EUROPE FLAT PANEL DISPLAYS IN INDIUM MARKET, BY TYPE, 2021-2030 (USD THOUSAND)
TABLE 176 EUROPE SEMICONDUCTOR MATERIALS IN INDIUM MARKET, BY TYPE, 2021-2030 (USD THOUSAND)
TABLE 177 EUROPE PHOTOVOLTAICS IN INDIUM MARKET, BY TYPE, 2021-2030 (USD THOUSAND)
TABLE 178 EUROPE SOLDERS IN INDIUM MARKET, BY TYPE, 2021-2030 (USD THOUSAND)
TABLE 179 EUROPE ALLOYS IN INDIUM MARKET, BY TYPE, 2021-2030 (USD THOUSAND)
TABLE 180 EUROPE BATTERIES IN INDIUM MARKET, BY TYPE, 2021-2030 (USD THOUSAND)
TABLE 181 GERMANY INDIUM MARKET, BY PRODUCT, 2021-2030 (USD THOUSAND)
TABLE 182 GERMANY INDIUM MARKET, BY PRODUCT, 2021-2030 (TONS)
TABLE 183 GERMANY INDIUM MARKET, BY APPLICATION, 2021-2030 (USD THOUSAND)
TABLE 184 GERMANY FLAT PANEL DISPLAYS IN INDIUM MARKET, BY TYPE, 2021-2030 (USD THOUSAND)
TABLE 185 GERMANY SEMICONDUCTOR MATERIALS IN INDIUM MARKET, BY TYPE, 2021-2030 (USD THOUSAND)
TABLE 186 GERMANY PHOTOVOLTAICS IN INDIUM MARKET, BY TYPE, 2021-2030 (USD THOUSAND)
TABLE 187 GERMANY SOLDERS IN INDIUM MARKET, BY TYPE, 2021-2030 (USD THOUSAND)
TABLE 188 GERMANY ALLOYS IN INDIUM MARKET, BY TYPE, 2021-2030 (USD THOUSAND)
TABLE 189 GERMANY BATTERIES IN INDIUM MARKET, BY TYPE, 2021-2030 (USD THOUSAND)
TABLE 190 U.K. INDIUM MARKET, BY PRODUCT, 2021-2030 (USD THOUSAND)
TABLE 191 U.K. INDIUM MARKET, BY PRODUCT, 2021-2030 (TONS)
TABLE 192 U.K. INDIUM MARKET, BY APPLICATION, 2021-2030 (USD THOUSAND)
TABLE 193 U.K. FLAT PANEL DISPLAYS IN INDIUM MARKET, BY TYPE, 2021-2030 (USD THOUSAND)
TABLE 194 U.K. SEMICONDUCTOR MATERIALS IN INDIUM MARKET, BY TYPE, 2021-2030 (USD THOUSAND)
TABLE 195 U.K. PHOTOVOLTAICS IN INDIUM MARKET, BY TYPE, 2021-2030 (USD THOUSAND)
TABLE 196 U.K. SOLDERS IN INDIUM MARKET, BY TYPE, 2021-2030 (USD THOUSAND)
TABLE 197 U.K. ALLOYS IN INDIUM MARKET, BY TYPE, 2021-2030 (USD THOUSAND)
TABLE 198 U.K. BATTERIES IN INDIUM MARKET, BY TYPE, 2021-2030 (USD THOUSAND)
TABLE 199 FRANCE INDIUM MARKET, BY PRODUCT, 2021-2030 (USD THOUSAND)
TABLE 200 FRANCE INDIUM MARKET, BY PRODUCT, 2021-2030 (TONS)
TABLE 201 FRANCE INDIUM MARKET, BY APPLICATION, 2021-2030 (USD THOUSAND)
TABLE 202 FRANCE FLAT PANEL DISPLAYS IN INDIUM MARKET, BY TYPE, 2021-2030 (USD THOUSAND)
TABLE 203 FRANCE SEMICONDUCTOR MATERIALS IN INDIUM MARKET, BY TYPE, 2021-2030 (USD THOUSAND)
TABLE 204 FRANCE PHOTOVOLTAICS IN INDIUM MARKET, BY TYPE, 2021-2030 (USD THOUSAND)
TABLE 205 FRANCE SOLDERS IN INDIUM MARKET, BY TYPE, 2021-2030 (USD THOUSAND)
TABLE 206 FRANCE ALLOYS IN INDIUM MARKET, BY TYPE, 2021-2030 (USD THOUSAND)
TABLE 207 FRANCE BATTERIES IN INDIUM MARKET, BY TYPE, 2021-2030 (USD THOUSAND)
TABLE 208 ITALY INDIUM MARKET, BY PRODUCT, 2021-2030 (USD THOUSAND)
TABLE 209 ITALY INDIUM MARKET, BY PRODUCT, 2021-2030 (TONS)
TABLE 210 ITALY INDIUM MARKET, BY APPLICATION, 2021-2030 (USD THOUSAND)
TABLE 211 ITALY FLAT PANEL DISPLAYS IN INDIUM MARKET, BY TYPE, 2021-2030 (USD THOUSAND)
TABLE 212 ITALY SEMICONDUCTOR MATERIALS IN INDIUM MARKET, BY TYPE, 2021-2030 (USD THOUSAND)
TABLE 213 ITALY PHOTOVOLTAICS IN INDIUM MARKET, BY TYPE, 2021-2030 (USD THOUSAND)
TABLE 214 ITALY SOLDERS IN INDIUM MARKET, BY TYPE, 2021-2030 (USD THOUSAND)
TABLE 215 ITALY ALLOYS IN INDIUM MARKET, BY TYPE, 2021-2030 (USD THOUSAND)
TABLE 216 ITALY BATTERIES IN INDIUM MARKET, BY TYPE, 2021-2030 (USD THOUSAND)
TABLE 217 SPAIN INDIUM MARKET, BY PRODUCT, 2021-2030 (USD THOUSAND)
TABLE 218 SPAIN INDIUM MARKET, BY PRODUCT, 2021-2030 (TONS)
TABLE 219 SPAIN INDIUM MARKET, BY APPLICATION, 2021-2030 (USD THOUSAND)
TABLE 220 SPAIN FLAT PANEL DISPLAYS IN INDIUM MARKET, BY TYPE, 2021-2030 (USD THOUSAND)
TABLE 221 SPAIN SEMICONDUCTOR MATERIALS IN INDIUM MARKET, BY TYPE, 2021-2030 (USD THOUSAND)
TABLE 222 SPAIN PHOTOVOLTAICS IN INDIUM MARKET, BY TYPE, 2021-2030 (USD THOUSAND)
TABLE 223 SPAIN SOLDERS IN INDIUM MARKET, BY TYPE, 2021-2030 (USD THOUSAND)
TABLE 224 SPAIN ALLOYS IN INDIUM MARKET, BY TYPE, 2021-2030 (USD THOUSAND)
TABLE 225 SPAIN BATTERIES IN INDIUM MARKET, BY TYPE, 2021-2030 (USD THOUSAND)
TABLE 226 RUSSIA INDIUM MARKET, BY PRODUCT, 2021-2030 (USD THOUSAND)
TABLE 227 RUSSIA INDIUM MARKET, BY PRODUCT, 2021-2030 (TONS)
TABLE 228 RUSSIA INDIUM MARKET, BY APPLICATION, 2021-2030 (USD THOUSAND)
TABLE 229 RUSSIA FLAT PANEL DISPLAYS IN INDIUM MARKET, BY TYPE, 2021-2030 (USD THOUSAND)
TABLE 230 RUSSIA SEMICONDUCTOR MATERIALS IN INDIUM MARKET, BY TYPE, 2021-2030 (USD THOUSAND)
TABLE 231 RUSSIA PHOTOVOLTAICS IN INDIUM MARKET, BY TYPE, 2021-2030 (USD THOUSAND)
TABLE 232 RUSSIA SOLDERS IN INDIUM MARKET, BY TYPE, 2021-2030 (USD THOUSAND)
TABLE 233 RUSSIA ALLOYS IN INDIUM MARKET, BY TYPE, 2021-2030 (USD THOUSAND)
TABLE 234 RUSSIA BATTERIES IN INDIUM MARKET, BY TYPE, 2021-2030 (USD THOUSAND)
TABLE 235 TURKEY INDIUM MARKET, BY PRODUCT, 2021-2030 (USD THOUSAND)
TABLE 236 TURKEY INDIUM MARKET, BY PRODUCT, 2021-2030 (TONS)
TABLE 237 TURKEY INDIUM MARKET, BY APPLICATION, 2021-2030 (USD THOUSAND)
TABLE 238 TURKEY FLAT PANEL DISPLAYS IN INDIUM MARKET, BY TYPE, 2021-2030 (USD THOUSAND)
TABLE 239 TURKEY SEMICONDUCTOR MATERIALS IN INDIUM MARKET, BY TYPE, 2021-2030 (USD THOUSAND)
TABLE 240 TURKEY PHOTOVOLTAICS IN INDIUM MARKET, BY TYPE, 2021-2030 (USD THOUSAND)
TABLE 241 TURKEY SOLDERS IN INDIUM MARKET, BY TYPE, 2021-2030 (USD THOUSAND)
TABLE 242 TURKEY ALLOYS IN INDIUM MARKET, BY TYPE, 2021-2030 (USD THOUSAND)
TABLE 243 TURKEY BATTERIES IN INDIUM MARKET, BY TYPE, 2021-2030 (USD THOUSAND)
TABLE 244 NETHERLANDS INDIUM MARKET, BY PRODUCT, 2021-2030 (USD THOUSAND)
TABLE 245 NETHERLANDS INDIUM MARKET, BY PRODUCT, 2021-2030 (TONS)
TABLE 246 NETHERLANDS INDIUM MARKET, BY APPLICATION, 2021-2030 (USD THOUSAND)
TABLE 247 NETHERLANDS FLAT PANEL DISPLAYS IN INDIUM MARKET, BY TYPE, 2021-2030 (USD THOUSAND)
TABLE 248 NETHERLANDS SEMICONDUCTOR MATERIALS IN INDIUM MARKET, BY TYPE, 2021-2030 (USD THOUSAND)
TABLE 249 NETHERLANDS PHOTOVOLTAICS IN INDIUM MARKET, BY TYPE, 2021-2030 (USD THOUSAND)
TABLE 250 NETHERLANDS SOLDERS IN INDIUM MARKET, BY TYPE, 2021-2030 (USD THOUSAND)
TABLE 251 NETHERLANDS ALLOYS IN INDIUM MARKET, BY TYPE, 2021-2030 (USD THOUSAND)
TABLE 252 NETHERLANDS BATTERIES IN INDIUM MARKET, BY TYPE, 2021-2030 (USD THOUSAND)
TABLE 253 BELGIUM INDIUM MARKET, BY PRODUCT, 2021-2030 (USD THOUSAND)
TABLE 254 BELGIUM INDIUM MARKET, BY PRODUCT, 2021-2030 (TONS)
TABLE 255 BELGIUM INDIUM MARKET, BY APPLICATION, 2021-2030 (USD THOUSAND)
TABLE 256 BELGIUM FLAT PANEL DISPLAYS IN INDIUM MARKET, BY TYPE, 2021-2030 (USD THOUSAND)
TABLE 257 BELGIUM SEMICONDUCTOR MATERIALS IN INDIUM MARKET, BY TYPE, 2021-2030 (USD THOUSAND)
TABLE 258 BELGIUM PHOTOVOLTAICS IN INDIUM MARKET, BY TYPE, 2021-2030 (USD THOUSAND)
TABLE 259 BELGIUM SOLDERS IN INDIUM MARKET, BY TYPE, 2021-2030 (USD THOUSAND)
TABLE 260 BELGIUM ALLOYS IN INDIUM MARKET, BY TYPE, 2021-2030 (USD THOUSAND)
TABLE 261 BELGIUM BATTERIES IN INDIUM MARKET, BY TYPE, 2021-2030 (USD THOUSAND)
TABLE 262 SWITZERLAND INDIUM MARKET, BY PRODUCT, 2021-2030 (USD THOUSAND)
TABLE 263 SWITZERLAND INDIUM MARKET, BY PRODUCT, 2021-2030 (TONS)
TABLE 264 SWITZERLAND INDIUM MARKET, BY APPLICATION, 2021-2030 (USD THOUSAND)
TABLE 265 SWITZERLAND FLAT PANEL DISPLAYS IN INDIUM MARKET, BY TYPE, 2021-2030 (USD THOUSAND)
TABLE 266 SWITZERLAND SEMICONDUCTOR MATERIALS IN INDIUM MARKET, BY TYPE, 2021-2030 (USD THOUSAND)
TABLE 267 SWITZERLAND PHOTOVOLTAICS IN INDIUM MARKET, BY TYPE, 2021-2030 (USD THOUSAND)
TABLE 268 SWITZERLAND SOLDERS IN INDIUM MARKET, BY TYPE, 2021-2030 (USD THOUSAND)
TABLE 269 SWITZERLAND ALLOYS IN INDIUM MARKET, BY TYPE, 2021-2030 (USD THOUSAND)
TABLE 270 SWITZERLAND BATTERIES IN INDIUM MARKET, BY TYPE, 2021-2030 (USD THOUSAND)
TABLE 271 REST OF EUROPE INDIUM MARKET, BY PRODUCT, 2021-2030 (USD THOUSAND)
TABLE 272 REST OF EUROPE INDIUM MARKET, BY PRODUCT, 2021-2030 (TONS)
TABLE 273 SOUTH AMERICA INDIUM MARKET, BY COUNTRY, 2021-2030 (USD THOUSAND)
TABLE 274 SOUTH AMERICA INDIUM MARKET, BY COUNTRY, 2021-2030 (TONS)
TABLE 275 SOUTH AMERICA INDIUM MARKET, BY PRODUCT, 2021-2030 (USD THOUSAND)
TABLE 276 SOUTH AMERICA INDIUM MARKET, BY PRODUCT, 2021-2030 (TONS)
TABLE 277 SOUTH AMERICA INDIUM MARKET, BY APPLICATION, 2021-2030 (USD THOUSAND)
TABLE 278 SOUTH AMERICA FLAT PANEL DISPLAYS IN INDIUM MARKET, BY TYPE, 2021-2030 (USD THOUSAND)
TABLE 279 SOUTH AMERICA SEMICONDUCTOR MATERIALS IN INDIUM MARKET, BY TYPE, 2021-2030 (USD THOUSAND)
TABLE 280 SOUTH AMERICA PHOTOVOLTAICS IN INDIUM MARKET, BY TYPE, 2021-2030 (USD THOUSAND)
TABLE 281 SOUTH AMERICA SOLDERS IN INDIUM MARKET, BY TYPE, 2021-2030 (USD THOUSAND)
TABLE 282 SOUTH AMERICA ALLOYS IN INDIUM MARKET, BY TYPE, 2021-2030 (USD THOUSAND)
TABLE 283 SOUTH AMERICA BATTERIES IN INDIUM MARKET, BY TYPE, 2021-2030 (USD THOUSAND)
TABLE 284 BRAZIL INDIUM MARKET, BY PRODUCT, 2021-2030 (USD THOUSAND)
TABLE 285 BRAZIL INDIUM MARKET, BY PRODUCT, 2021-2030 (TONS)
TABLE 286 BRAZIL INDIUM MARKET, BY APPLICATION, 2021-2030 (USD THOUSAND)
TABLE 287 BRAZIL FLAT PANEL DISPLAYS IN INDIUM MARKET, BY TYPE, 2021-2030 (USD THOUSAND)
TABLE 288 BRAZIL SEMICONDUCTOR MATERIALS IN INDIUM MARKET, BY TYPE, 2021-2030 (USD THOUSAND)
TABLE 289 BRAZIL PHOTOVOLTAICS IN INDIUM MARKET, BY TYPE, 2021-2030 (USD THOUSAND)
TABLE 290 BRAZIL SOLDERS IN INDIUM MARKET, BY TYPE, 2021-2030 (USD THOUSAND)
TABLE 291 BRAZIL ALLOYS IN INDIUM MARKET, BY TYPE, 2021-2030 (USD THOUSAND)
TABLE 292 BRAZIL BATTERIES IN INDIUM MARKET, BY TYPE, 2021-2030 (USD THOUSAND)
TABLE 293 ARGENTINA INDIUM MARKET, BY PRODUCT, 2021-2030 (USD THOUSAND)
TABLE 294 ARGENTINA INDIUM MARKET, BY PRODUCT, 2021-2030 (TONS)
TABLE 295 ARGENTINA INDIUM MARKET, BY APPLICATION, 2021-2030 (USD THOUSAND)
TABLE 296 ARGENTINA FLAT PANEL DISPLAYS IN INDIUM MARKET, BY TYPE, 2021-2030 (USD THOUSAND)
TABLE 297 ARGENTINA SEMICONDUCTOR MATERIALS IN INDIUM MARKET, BY TYPE, 2021-2030 (USD THOUSAND)
TABLE 298 ARGENTINA PHOTOVOLTAICS IN INDIUM MARKET, BY TYPE, 2021-2030 (USD THOUSAND)
TABLE 299 ARGENTINA SOLDERS IN INDIUM MARKET, BY TYPE, 2021-2030 (USD THOUSAND)
TABLE 300 ARGENTINA ALLOYS IN INDIUM MARKET, BY TYPE, 2021-2030 (USD THOUSAND)
TABLE 301 ARGENTINA BATTERIES IN INDIUM MARKET, BY TYPE, 2021-2030 (USD THOUSAND)
TABLE 302 REST OF SOUTH AMERICA INDIUM MARKET, BY PRODUCT, 2021-2030 (USD THOUSAND)
TABLE 303 REST OF SOUTH AMERICA INDIUM MARKET, BY PRODUCT, 2021-2030 (TONS)
TABLE 304 MIDDLE EAST AND AFRICA INDIUM MARKET, BY COUNTRY, 2021-2030 (USD THOUSAND)
TABLE 305 MIDDLE EAST AND AFRICA INDIUM MARKET, BY COUNTRY, 2021-2030 (TONS)
TABLE 306 MIDDLE EAST AND AFRICA INDIUM MARKET, BY PRODUCT, 2021-2030 (USD THOUSAND)
TABLE 307 MIDDLE EAST AND AFRICA INDIUM MARKET, BY PRODUCT, 2021-2030 (TONS)
TABLE 308 MIDDLE EAST AND AFRICA INDIUM MARKET, BY APPLICATION, 2021-2030 (USD THOUSAND)
TABLE 309 MIDDLE EAST AND AFRICA FLAT PANEL DISPLAYS IN INDIUM MARKET, BY TYPE, 2021-2030 (USD THOUSAND)
TABLE 310 MIDDLE EAST AND AFRICA SEMICONDUCTOR MATERIALS IN INDIUM MARKET, BY TYPE, 2021-2030 (USD THOUSAND)
TABLE 311 MIDDLE EAST AND AFRICA PHOTOVOLTAICS IN INDIUM MARKET, BY TYPE, 2021-2030 (USD THOUSAND)
TABLE 312 MIDDLE EAST AND AFRICA SOLDERS IN INDIUM MARKET, BY TYPE, 2021-2030 (USD THOUSAND)
TABLE 313 MIDDLE EAST AND AFRICA ALLOYS IN INDIUM MARKET, BY TYPE, 2021-2030 (USD THOUSAND)
TABLE 314 MIDDLE EAST AND AFRICA BATTERIES IN INDIUM MARKET, BY TYPE, 2021-2030 (USD THOUSAND)
TABLE 315 SOUTH AFRICA INDIUM MARKET, BY PRODUCT, 2021-2030 (USD THOUSAND)
TABLE 316 SOUTH AFRICA INDIUM MARKET, BY PRODUCT, 2021-2030 (TONS)
TABLE 317 SOUTH AFRICA INDIUM MARKET, BY APPLICATION, 2021-2030 (USD THOUSAND)
TABLE 318 SOUTH AFRICA FLAT PANEL DISPLAYS IN INDIUM MARKET, BY TYPE, 2021-2030 (USD THOUSAND)
TABLE 319 SOUTH AFRICA SEMICONDUCTOR MATERIALS IN INDIUM MARKET, BY TYPE, 2021-2030 (USD THOUSAND)
TABLE 320 SOUTH AFRICA PHOTOVOLTAICS IN INDIUM MARKET, BY TYPE, 2021-2030 (USD THOUSAND)
TABLE 321 SOUTH AFRICA SOLDERS IN INDIUM MARKET, BY TYPE, 2021-2030 (USD THOUSAND)
TABLE 322 SOUTH AFRICA ALLOYS IN INDIUM MARKET, BY TYPE, 2021-2030 (USD THOUSAND)
TABLE 323 SOUTH AFRICA BATTERIES IN INDIUM MARKET, BY TYPE, 2021-2030 (USD THOUSAND)
TABLE 324 ISRAEL INDIUM MARKET, BY PRODUCT, 2021-2030 (USD THOUSAND)
TABLE 325 ISRAEL INDIUM MARKET, BY PRODUCT, 2021-2030 (TONS)
TABLE 326 ISRAEL INDIUM MARKET, BY APPLICATION, 2021-2030 (USD THOUSAND)
TABLE 327 ISRAEL FLAT PANEL DISPLAYS IN INDIUM MARKET, BY TYPE, 2021-2030 (USD THOUSAND)
TABLE 328 ISRAEL SEMICONDUCTOR MATERIALS IN INDIUM MARKET, BY TYPE, 2021-2030 (USD THOUSAND)
TABLE 329 ISRAEL PHOTOVOLTAICS IN INDIUM MARKET, BY TYPE, 2021-2030 (USD THOUSAND)
TABLE 330 ISRAEL SOLDERS IN INDIUM MARKET, BY TYPE, 2021-2030 (USD THOUSAND)
TABLE 331 ISRAEL ALLOYS IN INDIUM MARKET, BY TYPE, 2021-2030 (USD THOUSAND)
TABLE 332 ISRAEL BATTERIES IN INDIUM MARKET, BY TYPE, 2021-2030 (USD THOUSAND)
TABLE 333 SAUDI ARABIA INDIUM MARKET, BY PRODUCT, 2021-2030 (USD THOUSAND)
TABLE 334 SAUDI ARABIA INDIUM MARKET, BY PRODUCT, 2021-2030 (TONS)
TABLE 335 SAUDI ARABIA INDIUM MARKET, BY APPLICATION, 2021-2030 (USD THOUSAND)
TABLE 336 SAUDI ARABIA FLAT PANEL DISPLAYS IN INDIUM MARKET, BY TYPE, 2021-2030 (USD THOUSAND)
TABLE 337 SAUDI ARABIA SEMICONDUCTOR MATERIALS IN INDIUM MARKET, BY TYPE, 2021-2030 (USD THOUSAND)
TABLE 338 SAUDI ARABIA PHOTOVOLTAICS IN INDIUM MARKET, BY TYPE, 2021-2030 (USD THOUSAND)
TABLE 339 SAUDI ARABIA SOLDERS IN INDIUM MARKET, BY TYPE, 2021-2030 (USD THOUSAND)
TABLE 340 SAUDI ARABIA ALLOYS IN INDIUM MARKET, BY TYPE, 2021-2030 (USD THOUSAND)
TABLE 341 SAUDI ARABIA BATTERIES IN INDIUM MARKET, BY TYPE, 2021-2030 (USD THOUSAND)
TABLE 342 UNITED ARAB EMIRATES INDIUM MARKET, BY PRODUCT, 2021-2030 (USD THOUSAND)
TABLE 343 UNITED ARAB EMIRATES INDIUM MARKET, BY PRODUCT, 2021-2030 (TONS)
TABLE 344 UNITED ARAB EMIRATES INDIUM MARKET, BY APPLICATION, 2021-2030 (USD THOUSAND)
TABLE 345 UNITED ARAB EMIRATES FLAT PANEL DISPLAYS IN INDIUM MARKET, BY TYPE, 2021-2030 (USD THOUSAND)
TABLE 346 UNITED ARAB EMIRATES SEMICONDUCTOR MATERIALS IN INDIUM MARKET, BY TYPE, 2021-2030 (USD THOUSAND)
TABLE 347 UNITED ARAB EMIRATES PHOTOVOLTAICS IN INDIUM MARKET, BY TYPE, 2021-2030 (USD THOUSAND)
TABLE 348 UNITED ARAB EMIRATES SOLDERS IN INDIUM MARKET, BY TYPE, 2021-2030 (USD THOUSAND)
TABLE 349 UNITED ARAB EMIRATES ALLOYS IN INDIUM MARKET, BY TYPE, 2021-2030 (USD THOUSAND)
TABLE 350 UNITED ARAB EMIRATES BATTERIES IN INDIUM MARKET, BY TYPE, 2021-2030 (USD THOUSAND)
TABLE 351 EGYPT INDIUM MARKET, BY PRODUCT, 2021-2030 (USD THOUSAND)
TABLE 352 EGYPT INDIUM MARKET, BY PRODUCT, 2021-2030 (TONS)
TABLE 353 EGYPT INDIUM MARKET, BY APPLICATION, 2021-2030 (USD THOUSAND)
TABLE 354 EGYPT FLAT PANEL DISPLAYS IN INDIUM MARKET, BY TYPE, 2021-2030 (USD THOUSAND)
TABLE 355 EGYPT SEMICONDUCTOR MATERIALS IN INDIUM MARKET, BY TYPE, 2021-2030 (USD THOUSAND)
TABLE 356 EGYPT PHOTOVOLTAICS IN INDIUM MARKET, BY TYPE, 2021-2030 (USD THOUSAND)
TABLE 357 EGYPT SOLDERS IN INDIUM MARKET, BY TYPE, 2021-2030 (USD THOUSAND)
TABLE 358 EGYPT ALLOYS IN INDIUM MARKET, BY TYPE, 2021-2030 (USD THOUSAND)
TABLE 359 EGYPT BATTERIES IN INDIUM MARKET, BY TYPE, 2021-2030 (USD THOUSAND)
TABLE 360 REST OF MIDDLE EAST AND AFRICA INDIUM MARKET, BY PRODUCT, 2021-2030 (USD THOUSAND)
TABLE 361 REST OF MIDDLE EAST AND AFRICA INDIUM MARKET, BY PRODUCT, 2021-2030 (TONS)
Lista de figuras
FIGURE 1 GLOBAL INDIUM MARKET
FIGURE 2 GLOBAL INDIUM MARKET: DATA TRIANGULATION
FIGURE 3 GLOBAL INDIUM MARKET: DROC ANALYSIS
FIGURE 4 GLOBAL INDIUM MARKET: GLOBAL VS REGIONAL MARKET ANALYSIS
FIGURE 5 GLOBAL INDIUM MARKET: COMPANY RESEARCH ANALYSIS
FIGURE 6 GLOBAL INDIUM MARKET: THE PRODUCT LIFE LINE CURVE
FIGURE 7 GLOBAL INDIUM MARKET: MULTIVARIATE MODELLING
FIGURE 8 GLOBAL INDIUM MARKET: INTERVIEW DEMOGRAPHICS
FIGURE 9 GLOBAL INDIUM MARKET: DBMR MARKET POSITION GRID
FIGURE 10 GLOBAL INDIUM MARKET: MARKET END-USER COVERAGE GRID
FIGURE 11 GLOBAL INDIUM MARKET: THE MARKET CHALLENGE MATRIX
FIGURE 12 GLOBAL INDIUM MARKET: VENDOR SHARE ANALYSIS
FIGURE 13 GLOBAL INDIUM MARKET: SEGMENTATION
FIGURE 14 ASIA-PACIFIC IS EXPECTED TO DOMINATE THE GLOBAL INDIUM MARKET, WHILE NORTH AMERICA IS EXPECTED TO GROW WITH THE HIGHEST CAGR IN THE FORECAST PERIOD
FIGURE 15 RISING DEMAND FOR ELECTRONIC ITEMS IS EXPECTED TO DRIVE THE GLOBAL INDIUM MARKET IN THE FORECAST PERIOD
FIGURE 16 PRIMARY SEGMENT IS EXPECTED TO ACCOUNT FOR THE LARGEST SHARE OF THE GLOBAL INDIUM MARKET IN 2022 & 2029
FIGURE 17 ASIA PACIFIC IS THE FASTEST-GROWING MARKET FOR INDIUM MARKET MANUFACTURERS IN THE FORECAST PERIOD
FIGURE 18 IMPORT-EXPORT SCENARIO (USD THOUSAND)
FIGURE 19 PRICE ANALYSIS FOR THE GLOBAL INDIUM MARKET (USD/KG)
FIGURE 20 DRIVERS, RESTRAINTS, OPPORTUNITIES, AND CHALLENGES OF THE GLOBAL INDIUM MARKET
FIGURE 21 GLOBAL INDIUM MARKET: BY PRODUCT, 2022
FIGURE 22 GLOBAL INDIUM MARKET: BY APPLICATION, 2022
FIGURE 23 GLOBAL INDIUM MARKET: SNAPSHOT (2022)
FIGURE 24 GLOBAL INDIUM MARKET: BY REGION (2022)
FIGURE 25 GLOBAL INDIUM MARKET: BY REGION (2023 & 2030)
FIGURE 26 GLOBAL INDIUM MARKET: BY REGION (2022 & 2030)
FIGURE 27 GLOBAL INDIUM MARKET: BY PRODUCT (2023-2030)
FIGURE 28 ASIA-PACIFIC INDIUM MARKET: SNAPSHOT (2022)
FIGURE 29 ASIA-PACIFIC INDIUM MARKET: BY COUNTRY (2022)
FIGURE 30 ASIA-PACIFIC INDIUM MARKET: BY COUNTRY (2023 & 2030)
FIGURE 31 ASIA-PACIFIC INDIUM MARKET: BY COUNTRY (2022 & 2030)
FIGURE 32 ASIA-PACIFIC INDIUM MARKET: BY PRODUCT (2023 - 2030)
FIGURE 33 NORTH AMERICA INDIUM MARKET: SNAPSHOT (2022)
FIGURE 34 NORTH AMERICA INDIUM MARKET: BY COUNTRY (2022)
FIGURE 35 NORTH AMERICA INDIUM MARKET: BY COUNTRY (2023 & 2030)
FIGURE 36 NORTH AMERICA INDIUM MARKET: BY COUNTRY (2022 & 2030)
FIGURE 37 NORTH AMERICA INDIUM MARKET: BY PRODUCT (2023 - 2030)
FIGURE 38 EUROPE INDIUM MARKET: SNAPSHOT (2022)
FIGURE 39 EUROPE INDIUM MARKET: BY COUNTRY (2022)
FIGURE 40 EUROPE INDIUM MARKET: BY COUNTRY (2023 & 2030)
FIGURE 41 EUROPE INDIUM MARKET: BY COUNTRY (2022 & 2030)
FIGURE 42 EUROPE INDIUM MARKET: BY PRODUCT (2023 - 2030)
FIGURE 43 SOUTH AMERICA INDIUM MARKET: SNAPSHOT (2022)
FIGURE 44 SOUTH AMERICA INDIUM MARKET: BY COUNTRY (2022)
FIGURE 45 SOUTH AMERICA INDIUM MARKET: BY COUNTRY (2023 & 2030)
FIGURE 46 SOUTH AMERICA INDIUM MARKET: BY COUNTRY (2022 & 2030)
FIGURE 47 SOUTH AMERICA INDIUM MARKET: BY PRODUCT (2023 - 2030)
FIGURE 48 MIDDLE EAST AND AFRICA INDIUM MARKET: SNAPSHOT (2022)
FIGURE 49 MIDDLE EAST AND AFRICA INDIUM MARKET: BY COUNTRY (2022)
FIGURE 50 MIDDLE EAST AND AFRICA INDIUM MARKET: BY COUNTRY (2023 & 2030)
FIGURE 51 MIDDLE EAST AND AFRICA INDIUM MARKET: BY COUNTRY (2022 & 2030)
FIGURE 52 MIDDLE EAST AND AFRICA INDIUM MARKET: BY PRODUCT (2023 - 2030)
FIGURE 53 GLOBAL INDIUM MARKET: COMPANY SHARE 2022 (%)
FIGURE 54 NORTH AMERICA INDIUM MARKET: COMPANY SHARE 2022 (%)
FIGURE 55 EUROPE INDIUM MARKET: COMPANY SHARE 2022 (%)
FIGURE 56 ASIA-PACIFIC INDIUM MARKET: COMPANY SHARE 2022 (%)
Metodología de investigación
La recopilación de datos y el análisis del año base se realizan utilizando módulos de recopilación de datos con muestras de gran tamaño. La etapa incluye la obtención de información de mercado o datos relacionados a través de varias fuentes y estrategias. Incluye el examen y la planificación de todos los datos adquiridos del pasado con antelación. Asimismo, abarca el examen de las inconsistencias de información observadas en diferentes fuentes de información. Los datos de mercado se analizan y estiman utilizando modelos estadísticos y coherentes de mercado. Además, el análisis de la participación de mercado y el análisis de tendencias clave son los principales factores de éxito en el informe de mercado. Para obtener más información, solicite una llamada de un analista o envíe su consulta.
La metodología de investigación clave utilizada por el equipo de investigación de DBMR es la triangulación de datos, que implica la extracción de datos, el análisis del impacto de las variables de datos en el mercado y la validación primaria (experto en la industria). Los modelos de datos incluyen cuadrícula de posicionamiento de proveedores, análisis de línea de tiempo de mercado, descripción general y guía del mercado, cuadrícula de posicionamiento de la empresa, análisis de patentes, análisis de precios, análisis de participación de mercado de la empresa, estándares de medición, análisis global versus regional y de participación de proveedores. Para obtener más información sobre la metodología de investigación, envíe una consulta para hablar con nuestros expertos de la industria.
Personalización disponible
Data Bridge Market Research es líder en investigación formativa avanzada. Nos enorgullecemos de brindar servicios a nuestros clientes existentes y nuevos con datos y análisis que coinciden y se adaptan a sus objetivos. El informe se puede personalizar para incluir análisis de tendencias de precios de marcas objetivo, comprensión del mercado de países adicionales (solicite la lista de países), datos de resultados de ensayos clínicos, revisión de literatura, análisis de mercado renovado y base de productos. El análisis de mercado de competidores objetivo se puede analizar desde análisis basados en tecnología hasta estrategias de cartera de mercado. Podemos agregar tantos competidores sobre los que necesite datos en el formato y estilo de datos que esté buscando. Nuestro equipo de analistas también puede proporcionarle datos en archivos de Excel sin procesar, tablas dinámicas (libro de datos) o puede ayudarlo a crear presentaciones a partir de los conjuntos de datos disponibles en el informe.

