

Global Bioactive Ingredient Market
Tamaño del mercado en miles de millones de dólares
Tasa de crecimiento anual compuesta (CAGR) :
% 
 USD
47.41 Billion
USD
85.82 Billion
2024
2032
USD
47.41 Billion
USD
85.82 Billion
2024
2032
| 2025 –2032 | |
| USD 47.41 Billion | |
| USD 85.82 Billion | |
| % | |
|
Mercado global de ingredientes bioactivos, por tipo de ingrediente (prebióticos, probióticos, aminoácidos, péptidos, omega 3 y lípidos estructurados, fitoquímicos y extractos de plantas, minerales, vitaminas, fibras y carbohidratos especiales, carotenoides y antioxidantes, entre otros), aplicación (alimentos funcionales, suplementos dietéticos, suplementos gomosos, nutrición animal, cuidado personal, productos farmacéuticos, entre otros), fuente (vegetal, animal y microbiana): tendencias de la industria y pronóstico hasta 2032.
Tamaño del mercado de ingredientes bioactivos
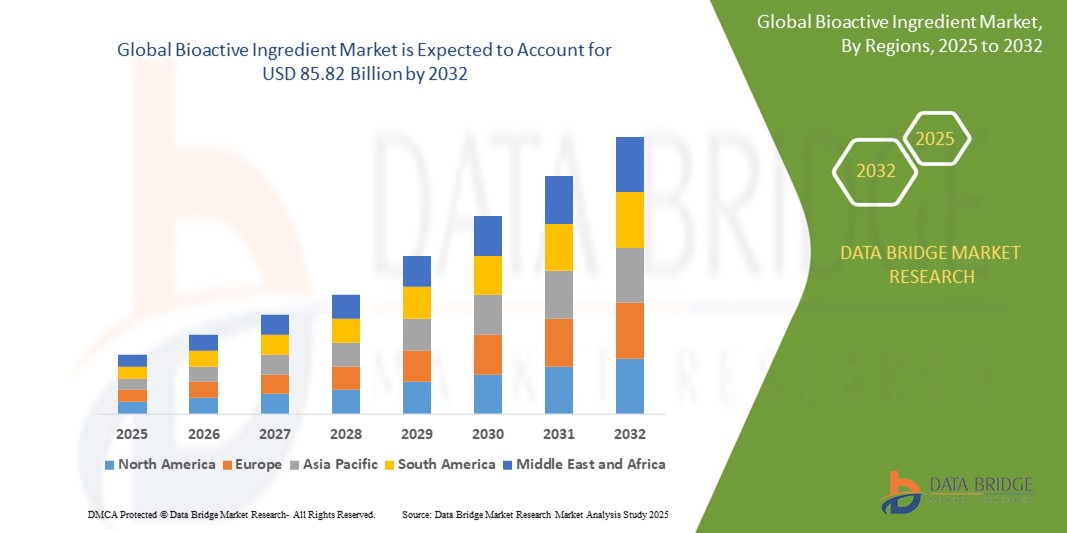
- El tamaño del mercado global de ingredientes bioactivos se valoró en USD 47,41 mil millones en 2024 y se espera que alcance los USD 85,82 mil millones para 2032 , con una CAGR de 7,70% durante el período de pronóstico.
- El crecimiento del mercado está impulsado principalmente por la creciente conciencia de los consumidores sobre la salud y el bienestar, la creciente demanda de alimentos funcionales y suplementos dietéticos y los avances en las tecnologías de extracción y formulación de compuestos bioactivos.
- La creciente preferencia por ingredientes naturales y sostenibles en el cuidado personal y las aplicaciones farmacéuticas está impulsando aún más la adopción de ingredientes bioactivos, posicionándolos como una piedra angular de los productos centrados en la salud.
Análisis del mercado de ingredientes bioactivos
- Los ingredientes bioactivos, que abarcan compuestos con propiedades que promueven la salud, son parte integral de los alimentos funcionales, suplementos dietéticos y productos de cuidado personal, y ofrecen beneficios como una mejor inmunidad, salud digestiva y efectos antienvejecimiento.
- El aumento de la demanda de ingredientes bioactivos está impulsado por el creciente enfoque del consumidor en la atención médica preventiva, la creciente prevalencia de enfermedades crónicas y la creciente adopción de productos de origen vegetal y de etiqueta limpia.
- Norteamérica tuvo la mayor cuota de mercado, con un 38,5 %, en 2024, impulsada por el alto gasto de los consumidores en productos de salud y bienestar, la sólida presencia de actores clave del sector y una infraestructura avanzada de I+D. Estados Unidos lidera la adopción de ingredientes bioactivos, especialmente en alimentos funcionales y suplementos dietéticos.
- Se anticipa que Asia-Pacífico será la región de más rápido crecimiento durante el período de pronóstico, impulsada por la creciente conciencia sobre la salud, el aumento de los ingresos disponibles y la rápida urbanización en países como China e India.
- El segmento de fibras y carbohidratos especiales tuvo la mayor participación en los ingresos del mercado con un 24,95 % en 2024, impulsado por su papel fundamental en la salud digestiva, la prevención de enfermedades cardíacas y la versatilidad en aplicaciones como alimentos funcionales y suplementos dietéticos.
Alcance del informe y segmentación del mercado de ingredientes bioactivos
|
Atributos |
Perspectivas clave del mercado de ingredientes bioactivos |
|
Segmentos cubiertos |
|
|
Países cubiertos |
América del norte
Europa
Asia-Pacífico
Oriente Medio y África
Sudamerica
|
|
Actores clave del mercado |
|
|
Oportunidades de mercado |
|
|
Conjuntos de información de datos de valor añadido |
Además de los conocimientos sobre escenarios de mercado, como valor de mercado, tasa de crecimiento, segmentación, cobertura geográfica y actores principales, los informes de mercado seleccionados por Data Bridge Market Research también incluyen análisis en profundidad de expertos, análisis de precios, análisis de participación de marca, encuesta de consumidores, análisis demográfico, análisis de la cadena de suministro, análisis de la cadena de valor, descripción general de materias primas/consumibles, criterios de selección de proveedores, análisis PESTLE, análisis de Porter y marco regulatorio. |
Tendencias del mercado de ingredientes bioactivos
“Aumento de la integración de la IA y el análisis de macrodatos”
- El mercado global de ingredientes bioactivos está experimentando una tendencia notable hacia la integración de la Inteligencia Artificial (IA) y el análisis de Big Data.
- Estas tecnologías permiten un análisis avanzado de datos de salud del consumidor, la eficacia de los ingredientes y las tendencias del mercado, lo que proporciona conocimientos más profundos sobre el desarrollo de productos y soluciones nutricionales personalizadas.
- Se están desarrollando plataformas impulsadas por IA para analizar las preferencias de los consumidores y los resultados de salud, lo que permite a los fabricantes adaptar los ingredientes bioactivos para obtener beneficios de salud específicos, como la salud intestinal o el apoyo inmunológico.
- Por ejemplo, las empresas están aprovechando la IA para optimizar la formulación de alimentos funcionales y suplementos dietéticos mediante el análisis de los patrones dietéticos de los consumidores y los datos de salud para crear productos personalizados.
- Esta tendencia mejora la propuesta de valor de los ingredientes bioactivos, haciéndolos más atractivos para los consumidores preocupados por la salud y para industrias como la nutracéutica y el cuidado personal.
- Los algoritmos de IA pueden procesar grandes conjuntos de datos sobre interacciones de ingredientes, biodisponibilidad y comentarios de los consumidores para mejorar la eficacia y la innovación del producto.
Dinámica del mercado de ingredientes bioactivos
Conductor
Creciente demanda de alimentos funcionales y atención médica preventiva
- La creciente demanda de los consumidores de alimentos funcionales, suplementos dietéticos y productos de cuidado personal enriquecidos con ingredientes bioactivos, como probióticos, ácidos grasos omega-3 y extractos de plantas, es un impulsor clave del mercado mundial de ingredientes bioactivos.
- Los ingredientes bioactivos mejoran los beneficios para la salud al apoyar la inmunidad, mejorar la salud intestinal, reducir la inflamación y abordar afecciones crónicas como la obesidad y las enfermedades cardiovasculares.
- Las iniciativas gubernamentales que promueven la salud y el bienestar, particularmente en regiones como Asia-Pacífico y Europa, están fomentando la adopción de ingredientes bioactivos en aplicaciones alimentarias y farmacéuticas.
- La proliferación de IoT y los avances en las tecnologías de la cadena de suministro están permitiendo una producción y distribución más rápidas de ingredientes bioactivos, lo que respalda la escalabilidad para los fabricantes.
- Las empresas incorporan cada vez más ingredientes bioactivos como fitoquímicos y antioxidantes como componentes estándar o premium en sus productos para satisfacer las expectativas de los consumidores de soluciones naturales y que mejoren la salud.
Restricción/Desafío
Altos costos de desarrollo y preocupaciones por el cumplimiento normativo
- La importante inversión inicial requerida para la investigación, el desarrollo y la producción de ingredientes bioactivos, incluida la extracción, la formulación y las pruebas, puede ser una barrera para la entrada al mercado, en particular para los fabricantes a pequeña escala en los mercados emergentes.
- El desarrollo y la integración de ingredientes bioactivos en alimentos funcionales, suplementos o productos de cuidado personal pueden ser complejos y costosos debido a la necesidad de tecnologías avanzadas como la microencapsulación.
- La seguridad de los datos y el cumplimiento normativo plantean grandes desafíos, ya que las aplicaciones de ingredientes bioactivos implican la recopilación y el análisis de datos confidenciales sobre la salud de los consumidores, lo que genera inquietudes sobre la privacidad, las violaciones de datos y el cumplimiento de regulaciones estrictas como el RGPD en Europa.
- El panorama regulatorio fragmentado en los distintos países, con diferentes estándares de seguridad, eficacia y etiquetado de ingredientes bioactivos, complica las operaciones de los fabricantes y proveedores de servicios globales.
- Estos factores pueden disuadir la expansión del mercado, en particular en regiones con alta sensibilidad a los costos o entornos regulatorios estrictos, lo que limita la adopción entre los consumidores y fabricantes preocupados por los precios.
Alcance del mercado de ingredientes bioactivos
El mercado está segmentado según el tipo de ingrediente, la aplicación y la fuente.
- Por tipo de ingrediente
Según el tipo de ingrediente, el mercado se segmenta en prebióticos, probióticos, aminoácidos, péptidos, omega-3 y lípidos estructurados, fitoquímicos y extractos de plantas, minerales, vitaminas, fibras y carbohidratos especiales, carotenoides y antioxidantes, entre otros. El segmento de fibras y carbohidratos especiales obtuvo la mayor participación en los ingresos del mercado, con un 24,95 % en 2024, gracias a su papel fundamental en la salud digestiva, la prevención de enfermedades cardíacas y su versatilidad en aplicaciones como alimentos funcionales y suplementos dietéticos. Su capacidad para reducir el riesgo de enfermedades crónicas, como la diabetes tipo 2, impulsa aún más la demanda.
Se prevé que el segmento de probióticos experimente su mayor crecimiento entre 2025 y 2032, impulsado por la creciente concienciación de los consumidores sobre los beneficios para la salud intestinal y su creciente incorporación en alimentos, bebidas y suplementos funcionales. Los avances en tecnología microbiana y la demanda de productos que refuerzan el sistema inmunitario aceleran su adopción.
- Por aplicación
Según su aplicación, el mercado se segmenta en alimentos funcionales, suplementos dietéticos, gomitas, nutrición animal, cuidado personal, productos farmacéuticos y otros. El segmento de suplementos dietéticos dominó con una participación en los ingresos del 31,2 % en 2024, impulsado por la creciente demanda de atención médica preventiva y nutrición personalizada. Los suplementos que incorporan vitaminas, minerales y probióticos satisfacen diversas necesidades de salud, como la inmunidad y la digestión.
Se prevé que el segmento de alimentos funcionales experimente la tasa de crecimiento más rápida, del 8,1 %, entre 2025 y 2032, impulsada por una mayor concienciación sobre la salud y la demanda de productos enriquecidos con nutrientes, como barritas energéticas, bebidas fortificadas y snacks. Las innovaciones en la integración de compuestos bioactivos mejoran el atractivo de los productos y la expansión del mercado.
- Por fuente
Según el origen, el mercado se segmenta en vegetales, animales y microbianos. El segmento de origen vegetal obtuvo la mayor cuota de mercado, con un 58,7%, en 2024, gracias a la creciente popularidad de las dietas basadas en plantas, el veganismo y la abundancia de compuestos bioactivos como fitoquímicos y polifenoles en frutas, verduras y cereales. La preferencia del consumidor por ingredientes naturales y orgánicos impulsa aún más este segmento.
Se prevé que el segmento de fuentes microbianas experimente un crecimiento significativo entre 2025 y 2032, impulsado por los avances en las tecnologías de fermentación y el creciente uso de probióticos y otros compuestos de origen microbiano en alimentos y suplementos funcionales. Su escalabilidad y eficacia en aplicaciones sanitarias impulsan el crecimiento del mercado.
Análisis regional del mercado de ingredientes bioactivos
- Norteamérica tuvo la mayor cuota de mercado, con un 38,5 %, en 2024, impulsada por el alto gasto de los consumidores en productos de salud y bienestar, la sólida presencia de actores clave del sector y una infraestructura avanzada de I+D. Estados Unidos lidera la adopción de ingredientes bioactivos, especialmente en alimentos funcionales y suplementos dietéticos.
- Los consumidores priorizan los ingredientes bioactivos como los probióticos, los ácidos grasos omega-3 y los extractos de plantas por sus beneficios para la salud, que incluyen una mejor inmunidad, la salud digestiva y la prevención de enfermedades crónicas, particularmente en regiones con alta conciencia de la salud.
- El crecimiento está respaldado por avances en tecnologías de extracción de ingredientes, como una biodisponibilidad mejorada y formulaciones novedosas, junto con una creciente adopción en los segmentos de alimentos funcionales y cuidado personal.
Perspectiva del mercado de ingredientes bioactivos de EE. UU.
El mercado estadounidense de ingredientes bioactivos captó la mayor participación en los ingresos, con un 75%, en 2024 en Norteamérica, impulsado por la creciente concienciación de los consumidores sobre los beneficios para la salud, como la protección UV y el refuerzo inmunitario. La tendencia hacia la nutrición personalizada y los productos de etiqueta limpia impulsa aún más la expansión del mercado. La integración de ingredientes bioactivos, como vitaminas y probióticos, tanto en aplicaciones minoristas como farmacéuticas complementa el crecimiento del mercado.
Perspectiva del mercado europeo de ingredientes bioactivos
Se prevé un rápido crecimiento del mercado europeo de ingredientes bioactivos, impulsado por estrictas regulaciones que promueven la salud y la seguridad en alimentos y cosméticos. Los consumidores buscan ingredientes como fitoquímicos y antioxidantes que mejoran el bienestar y ofrecen beneficios antienvejecimiento. El crecimiento es notable en alimentos funcionales y productos de cuidado personal, con países como Alemania y Francia mostrando una adopción significativa debido a la creciente preocupación por el medio ambiente y los estilos de vida saludables.
Perspectiva del mercado de ingredientes bioactivos del Reino Unido
Se prevé un fuerte crecimiento del mercado británico de ingredientes bioactivos, impulsado por la demanda de alimentos funcionales y productos de cuidado personal que mejoran la salud y la estética en entornos urbanos y suburbanos. La mayor concienciación sobre beneficios como la salud digestiva y la protección de la piel fomenta su adopción. La evolución de las regulaciones, que equilibran las afirmaciones sobre la salud con el cumplimiento normativo, influye aún más en las preferencias de los consumidores.
Análisis del mercado alemán de ingredientes bioactivos
Se espera que Alemania experimente un crecimiento significativo en el mercado de ingredientes bioactivos, gracias a sus avanzados sectores alimentario y farmacéutico y a la gran atención de los consumidores a la salud preventiva y el bienestar. Los consumidores alemanes prefieren ingredientes tecnológicamente avanzados, como péptidos y carotenoides, que refuerzan el sistema inmunitario y reducen el riesgo de enfermedades crónicas. La integración de estos ingredientes en alimentos funcionales premium y suplementos posventa impulsa el crecimiento sostenido del mercado.
Perspectiva del mercado de ingredientes bioactivos de Asia-Pacífico
Se prevé que la región Asia-Pacífico experimente la tasa de crecimiento más rápida, impulsada por la expansión de la producción de alimentos y bebidas y el aumento de la renta disponible en países como China, India y Japón. La creciente concienciación sobre los beneficios para la salud, como el refuerzo inmunitario y la salud cognitiva, impulsa la demanda de ingredientes como probióticos y extractos de plantas. Las iniciativas gubernamentales que promueven la salud nutricional y el abastecimiento sostenible incentivan aún más el uso de ingredientes bioactivos avanzados.
Perspectiva del mercado de ingredientes bioactivos en Japón
Se prevé un rápido crecimiento del mercado japonés de ingredientes bioactivos debido a la fuerte preferencia de los consumidores por ingredientes de alta calidad y con respaldo científico que mejoran la salud y el bienestar. La presencia de importantes fabricantes de alimentos y productos farmacéuticos y la integración de ingredientes como los péptidos bioactivos en alimentos funcionales aceleran la penetración en el mercado. El creciente interés en los suplementos que promueven la belleza desde el interior también contribuye a este crecimiento.
Análisis del mercado de ingredientes bioactivos de China
China posee la mayor participación en el mercado de ingredientes bioactivos de Asia-Pacífico, impulsada por la rápida urbanización, la creciente concienciación sobre la salud y la creciente demanda de alimentos funcionales y suplementos dietéticos. La creciente clase media del país y su enfoque en la atención médica preventiva impulsan la adopción de ingredientes como fibras y ácidos grasos omega-3. La sólida capacidad de fabricación nacional y los precios competitivos mejoran el acceso al mercado.
Cuota de mercado de ingredientes bioactivos
La industria de ingredientes bioactivos está liderada principalmente por empresas bien establecidas, entre las que se incluyen:
- DSM (Países Bajos)
- BASF SE (Alemania)
- Kerry Group plc. (Irlanda)
- DuPont (EE. UU.)
- ADM (EE. UU.)
- Evonik Industries AG (Alemania)
- Cargill, Incorporated (EE. UU.)
- Arla Food Ingredients Group P/S (Dinamarca)
- Corporación FMC (EE. UU.)
- Grupo Sunrise Nutrachem (China)
- Adisseo (Francia)
- Chr. Hansen A/S (Dinamarca)
- Sabinsa (Estados Unidos)
- Ajinomoto Co., Inc (Japón)
- Ingredion (EE. UU.)
¿Cuáles son los desarrollos recientes en el mercado global de ingredientes bioactivos?
- En mayo de 2025, Givaudan adquirió los activos biotecnológicos de Amyris, lo que reforzó su experiencia en el desarrollo y la expansión de ingredientes sostenibles. Esta estrategia fortalece las capacidades de Givaudan en la creación de ingredientes bioactivos mediante fermentación, respondiendo a la creciente demanda de productos naturales y ecológicos por parte de los consumidores. La adquisición incluye la avanzada tecnología de biofabricación de Amyris, que permite la producción de ingredientes biofermentados de alto rendimiento para los mercados de belleza, salud y bienestar. Givaudan busca aprovechar esta alianza para impulsar la innovación en soluciones sostenibles.
- En marzo de 2025, Lonza Group AG reforzó su capacidad de fabricación biofarmacéutica con la apertura de una nueva planta en Visp, Suiza, dedicada a ingredientes farmacéuticos activos de alta potencia (HPAPI). Esta expansión responde a la creciente demanda de moléculas bioactivas complejas, especialmente en oncología y terapias especializadas. La planta de Visp alberga salas de producción avanzadas, lo que permite un desarrollo de fármacos eficiente y su comercialización. La inversión de Lonza refuerza su liderazgo global en la fabricación farmacéutica, garantizando soluciones de vanguardia para las necesidades médicas en constante evolución.
- En febrero de 2025, Royal DSM se asoció con Avril, un importante grupo agroindustrial francés, para desarrollar y comercializar ingredientes proteicos sostenibles para la industria de alimentos y bebidas. Esta colaboración combina la experiencia de DSM en biotecnología con la experiencia de Avril en el procesamiento de semillas oleaginosas, con el objetivo de introducir proteínas bioactivas innovadoras de origen vegetal. La alianza responde a la creciente demanda de soluciones alimentarias más saludables y ecológicas, impulsando avances en fuentes de proteínas alternativas. Al aprovechar sus fortalezas combinadas, DSM y Avril buscan mejorar la oferta nutricional y promover la sostenibilidad en la producción de alimentos.
- En marzo de 2023, Symrise lanzó una nueva gama de ingredientes bioactivos para su línea de productos "Belleza desde dentro", dirigida al creciente mercado de la nutricosmética. Esta colección incluye bioactivos de origen natural, como colágeno tipo I, vitaminas C y A, y polifenoles de diversas frutas, diseñados para apoyar el antienvejecimiento de la piel, la luminosidad y el cuidado del cabello y las uñas. Los ingredientes buscan potenciar los beneficios de la belleza desde dentro hacia fuera, complementando las rutinas tradicionales de cuidado de la piel. La innovación de Symrise responde a la demanda de los consumidores de soluciones de belleza holísticas y sostenibles.
- En enero de 2023, FrieslandCampina Ingredients se asoció con Triplebar Bio Inc. para desarrollar y escalar proteínas celulares mediante fermentación de precisión. Esta colaboración busca impulsar soluciones proteicas sostenibles, respondiendo a la creciente demanda de innovación nutricional. FrieslandCampina aprovecha su experiencia en el procesamiento de proteínas lácteas, mientras que Triplebar aporta sus capacidades biotecnológicas para crear proteínas bioactivas que contribuyen a la salud y la nutrición humanas. Esta alianza refuerza su compromiso con la tecnología alimentaria a prueba de futuro, garantizando la producción de proteínas de alta calidad con un impacto ambiental mínimo.
SKU-
Obtenga acceso en línea al informe sobre la primera nube de inteligencia de mercado del mundo

- Panel de análisis de datos interactivo
- Panel de análisis de empresas para oportunidades con alto potencial de crecimiento
- Acceso de analista de investigación para personalización y consultas
- Análisis de la competencia con panel interactivo
- Últimas noticias, actualizaciones y análisis de tendencias
- Aproveche el poder del análisis de referencia para un seguimiento integral de la competencia
Metodología de investigación
La recopilación de datos y el análisis del año base se realizan utilizando módulos de recopilación de datos con muestras de gran tamaño. La etapa incluye la obtención de información de mercado o datos relacionados a través de varias fuentes y estrategias. Incluye el examen y la planificación de todos los datos adquiridos del pasado con antelación. Asimismo, abarca el examen de las inconsistencias de información observadas en diferentes fuentes de información. Los datos de mercado se analizan y estiman utilizando modelos estadísticos y coherentes de mercado. Además, el análisis de la participación de mercado y el análisis de tendencias clave son los principales factores de éxito en el informe de mercado. Para obtener más información, solicite una llamada de un analista o envíe su consulta.
La metodología de investigación clave utilizada por el equipo de investigación de DBMR es la triangulación de datos, que implica la extracción de datos, el análisis del impacto de las variables de datos en el mercado y la validación primaria (experto en la industria). Los modelos de datos incluyen cuadrícula de posicionamiento de proveedores, análisis de línea de tiempo de mercado, descripción general y guía del mercado, cuadrícula de posicionamiento de la empresa, análisis de patentes, análisis de precios, análisis de participación de mercado de la empresa, estándares de medición, análisis global versus regional y de participación de proveedores. Para obtener más información sobre la metodología de investigación, envíe una consulta para hablar con nuestros expertos de la industria.
Personalización disponible
Data Bridge Market Research es líder en investigación formativa avanzada. Nos enorgullecemos de brindar servicios a nuestros clientes existentes y nuevos con datos y análisis que coinciden y se adaptan a sus objetivos. El informe se puede personalizar para incluir análisis de tendencias de precios de marcas objetivo, comprensión del mercado de países adicionales (solicite la lista de países), datos de resultados de ensayos clínicos, revisión de literatura, análisis de mercado renovado y base de productos. El análisis de mercado de competidores objetivo se puede analizar desde análisis basados en tecnología hasta estrategias de cartera de mercado. Podemos agregar tantos competidores sobre los que necesite datos en el formato y estilo de datos que esté buscando. Nuestro equipo de analistas también puede proporcionarle datos en archivos de Excel sin procesar, tablas dinámicas (libro de datos) o puede ayudarlo a crear presentaciones a partir de los conjuntos de datos disponibles en el informe.

