

Global Anti Friction Coating Market
Tamaño del mercado en miles de millones de dólares
Tasa de crecimiento anual compuesta (CAGR) :
% 
 USD
712.23 Million
USD
1,308.56 Million
2025
2033
USD
712.23 Million
USD
1,308.56 Million
2025
2033
| 2026 –2033 | |
| USD 712.23 Million | |
| USD 1,308.56 Million | |
| % | |
|
Segmentación del mercado global de recubrimientos antifricción por producto (MOS₂, PTFE, grafito, FEP, PFA y disulfuro de tungsteno), naturaleza (base solvente y base agua), aplicación (autopartes, elementos de transmisión de potencia, rodamientos, componentes de municiones, componentes y actuadores de válvulas, entre otros), uso final (automotriz, aeroespacial, marítimo, construcción, atención médica, entre otros): tendencias de la industria y pronóstico hasta 2033.
Tamaño del mercado de recubrimientos antifricción
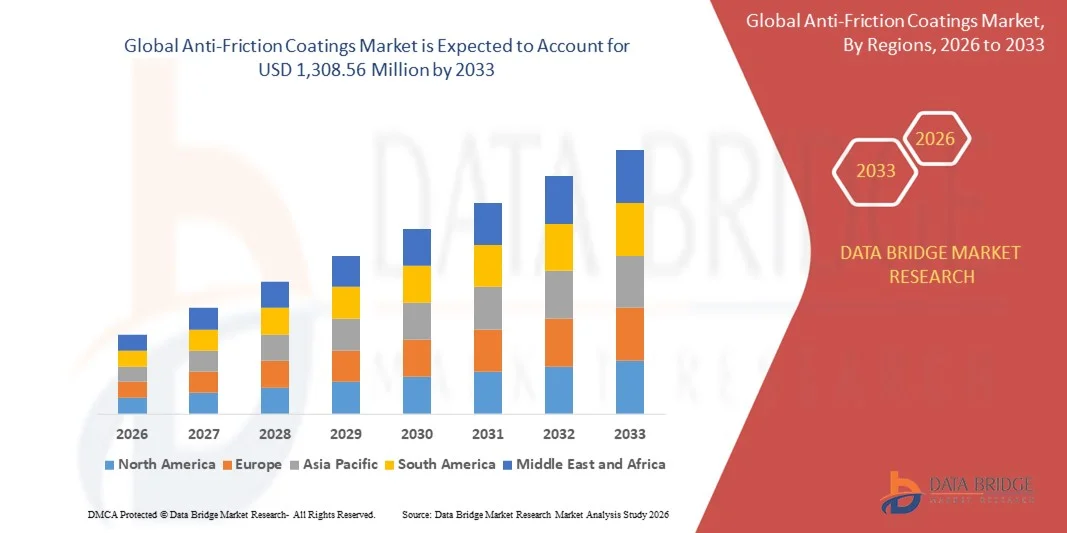
- El tamaño del mercado global de recubrimientos antifricción se valoró en USD 712,23 millones en 2025 y se espera que alcance los USD 1.308,56 millones para 2033 , con una CAGR del 7,90 % durante el período de pronóstico.
- El crecimiento del mercado está impulsado en gran medida por la creciente demanda de recubrimientos resistentes al desgaste y energéticamente eficientes en los sectores de la automoción, la aeroespacial y la maquinaria industrial.
- La creciente adopción de tecnologías avanzadas de ingeniería de superficies para mejorar el rendimiento de los equipos y reducir los costos de mantenimiento está impulsando aún más la expansión del mercado.
Análisis del mercado de recubrimientos antifricción
- El mercado está siendo testigo de innovaciones en las formulaciones de recubrimientos, incluidos lubricantes secos, lubricantes de película sólida y recubrimientos compuestos, para satisfacer diversos requisitos industriales.
- Las crecientes inversiones en I+D para recubrimientos de alto rendimiento y respetuosos con el medio ambiente están fomentando su adopción en múltiples aplicaciones y regiones.
- América del Norte dominó el mercado de recubrimientos antifricción con la mayor participación en los ingresos del 38,75 % en 2025, impulsada por la creciente demanda de maquinaria energéticamente eficiente, componentes automotrices y soluciones de automatización industrial.
- Se espera que la región de Asia y el Pacífico sea testigo de la mayor tasa de crecimiento en el mercado mundial de recubrimientos antifricción , impulsada por la expansión de la producción automotriz, el aumento de la automatización industrial y la creciente demanda de componentes de maquinaria duraderos y de bajo mantenimiento.
- El segmento de PTFE registró la mayor participación en ingresos del mercado en 2025, impulsado por sus excelentes propiedades de baja fricción, resistencia química y amplia aplicabilidad en componentes automotrices, industriales y aeroespaciales. Los recubrimientos de PTFE son los preferidos para mejorar el rendimiento, reducir el desgaste y prolongar la vida útil de maquinaria crítica.
Alcance del informe y segmentación del mercado de recubrimientos antifricción
|
Atributos |
Recubrimientos antifricción: Perspectivas clave del mercado |
|
Segmentos cubiertos |
|
|
Países cubiertos |
Norteamérica
Europa
Asia-Pacífico
Oriente Medio y África
Sudamérica
|
|
Actores clave del mercado |
|
|
Oportunidades de mercado |
|
|
Conjuntos de información de datos de valor añadido |
Además de los conocimientos sobre escenarios de mercado como valor de mercado, tasa de crecimiento, segmentación, cobertura geográfica y actores principales, los informes de mercado seleccionados por Data Bridge Market Research también incluyen análisis de importación y exportación, descripción general de la capacidad de producción, análisis del consumo de producción, análisis de tendencias de precios, escenario de cambio climático, análisis de la cadena de suministro, análisis de la cadena de valor, descripción general de materias primas/consumibles, criterios de selección de proveedores, análisis PESTLE, análisis de Porter y marco regulatorio. |
Tendencias del mercado de recubrimientos antifricción
Creciente adopción de recubrimientos antifricción en aplicaciones automotrices e industriales
- La creciente tendencia hacia los recubrimientos antifricción está transformando la maquinaria y los componentes automotrices al reducir el desgaste, aumentar la durabilidad y optimizar la eficiencia energética. Estos recubrimientos permiten una mayor vida útil de los equipos y menores costos de mantenimiento, lo que se traduce en una mayor eficiencia operativa y una reducción del tiempo de inactividad. Además, ayudan a minimizar la generación de calor, lo que mejora la seguridad y la confiabilidad de la maquinaria de alta velocidad, mejorando aún más el rendimiento operativo.
- La alta demanda de recubrimientos de baja fricción y alto rendimiento en motores, sistemas de engranajes y maquinaria industrial está acelerando su adopción en plantas de fabricación y talleres automotrices. Estos recubrimientos son particularmente eficaces para minimizar las pérdidas por fricción, mejorando así la eficiencia del combustible y el rendimiento mecánico. Además, contribuyen a prolongar los intervalos de mantenimiento y a reducir el consumo de lubricante, lo que reduce el costo total de propiedad y mejora la productividad.
- La versatilidad y facilidad de aplicación de los recubrimientos antifricción modernos los hacen atractivos tanto para pequeños fabricantes como para grandes empresas industriales. Las empresas se benefician de menores costos operativos y una mayor confiabilidad de los equipos, lo que impulsa su penetración en el mercado. Además, los recubrimientos son compatibles con una amplia gama de sustratos y pueden personalizarse para aplicaciones industriales específicas, lo que amplía su utilidad y su potencial de mercado.
- Por ejemplo, en 2023, varios fabricantes de componentes automotrices en Alemania informaron una reducción del desgaste del motor y una mayor eficiencia tras implementar recubrimientos antifricción avanzados en componentes críticos, lo que resultó en menos reclamaciones de garantía y una mayor satisfacción del cliente. Se observaron mejoras similares en equipos industriales pesados en Asia, donde la maquinaria recubierta experimentó ciclos operativos más largos y menos averías imprevistas, lo que mejoró la productividad operativa general.
- Si bien los recubrimientos antifricción impulsan la innovación en eficiencia mecánica y ahorro energético, su impacto depende de la investigación continua de materiales, la optimización de los procesos de aplicación y el cumplimiento de las normativas ambientales. Los fabricantes deben centrarse en formulaciones ecológicas y soluciones rentables para aprovechar al máximo la creciente demanda del mercado. La adopción continua de tecnologías de recubrimiento avanzadas también permite a las empresas obtener una ventaja competitiva mediante la mejora de la calidad del producto y la fiabilidad del rendimiento.
Dinámica del mercado de recubrimientos antifricción
Impulsor
Creciente demanda de eficiencia energética y mayor vida útil de los equipos
- El creciente interés en reducir el consumo energético y mejorar la eficiencia operativa está impulsando la adopción de recubrimientos antifricción en los sectores automotriz, aeroespacial e industrial. Estos recubrimientos reducen las pérdidas por fricción, lo que se traduce en un importante ahorro energético y menores costes operativos. Además, prolongan la vida útil de los componentes críticos, proporcionando a las empresas beneficios financieros mensurables a lo largo del tiempo.
- Las regulaciones gubernamentales que promueven la eficiencia del combustible y la sostenibilidad ambiental están acelerando aún más el crecimiento del mercado. Las empresas automotrices e industriales invierten cada vez más en recubrimientos avanzados para cumplir con las normas de emisiones y prolongar la vida útil de sus productos. Además, los incentivos regulatorios para las prácticas de fabricación ecológica animan a las empresas a adoptar recubrimientos ecológicos y de baja fricción como parte de sus iniciativas de sostenibilidad.
- La expansión de la automatización industrial y la maquinaria de alta velocidad también impulsa la demanda, ya que los recubrimientos antifricción mejoran el rendimiento de los equipos en condiciones de alta carga y temperatura. Los recubrimientos permiten un funcionamiento fiable en entornos hostiles, reduciendo las tasas de fallos y el tiempo de inactividad. Esta tendencia es especialmente notable en sectores como el aeroespacial y la fabricación pesada, donde la fiabilidad de los equipos incide directamente en la productividad y los costes operativos.
- Por ejemplo, en 2022, varios fabricantes estadounidenses de equipos industriales aplicaron recubrimientos antifricción en cajas de engranajes de alta velocidad, lo que mejoró el rendimiento, redujo el consumo de energía y prolongó la vida útil de los componentes. Además, aplicaciones similares en componentes de turbinas eólicas europeas demostraron una mayor eficiencia y menores requisitos de mantenimiento, lo que ilustra los beneficios de los recubrimientos para diversas industrias.
- Si bien la creciente concienciación y el apoyo regulatorio impulsan la expansión del mercado, la I+D continua, la optimización de costos y la adopción de materiales ecológicos siguen siendo esenciales para un crecimiento sostenido. Las empresas que invierten en tecnologías de recubrimiento de última generación están mejor posicionadas para abordar las cambiantes demandas del mercado y aprovechar las oportunidades en las aplicaciones industriales y automotrices emergentes.
Restricción/Desafío
Altos costos de materiales y complejidad de aplicación
- El alto costo de los recubrimientos antifricción avanzados, como las formulaciones cerámicas y de lubricantes sólidos, limita su adopción entre los fabricantes a pequeña escala y las industrias sensibles a los costos. Los materiales especializados y los requisitos de preparación de superficies aumentan los gastos operativos y las barreras de entrada. Además, la fluctuación de los precios de las materias primas para los polvos especiales puede afectar los costos generales de fabricación, lo que limita aún más a los actores más pequeños
- En muchas regiones, la aplicación de recubrimientos antifricción requiere personal cualificado y un control preciso del proceso. La falta de personal capacitado y de una infraestructura de aplicación avanzada limita su adopción generalizada, especialmente en los mercados emergentes. Las empresas también pueden enfrentarse a dificultades para mantener una calidad constante del recubrimiento en la producción a gran escala, lo que puede afectar la fiabilidad del rendimiento y la confianza del cliente.
- Los desafíos en la cadena de suministro de polvos y aditivos de recubrimiento especiales pueden interrumpir los cronogramas de producción y aumentar los costos. La disponibilidad inconsistente de materias primas afecta la escalabilidad y la entrega puntual de los productos recubiertos a los clientes. Además, las limitaciones logísticas en el transporte de materiales de recubrimiento sensibles a la temperatura o peligrosos pueden provocar retrasos en la producción y mayores riesgos operativos.
- Por ejemplo, en 2023, varios proveedores de recubrimientos industriales en Asia sufrieron retrasos y mayores costos de producción debido a la escasez de polvos lubricantes avanzados, lo que afectó la producción general del mercado y los plazos de entrega de los clientes. Se registraron desafíos similares en América del Norte, donde la disponibilidad limitada de variantes de recubrimientos ecológicos ralentizó su adopción en proyectos ambientalmente sensibles.
- Si bien las innovaciones tecnológicas continúan mejorando el rendimiento y la facilidad de aplicación de los recubrimientos, abordar los costos de capital, los requisitos de habilidades y las limitaciones de la cadena de suministro es crucial para una adopción más amplia y un crecimiento sostenible del mercado. Las empresas que se centran en soluciones de recubrimiento automatizadas y el abastecimiento local de materias primas están mejor posicionadas para superar estas barreras y expandir su presencia en el mercado.
Alcance del mercado de recubrimientos antifricción
El mercado de recubrimientos antifricción está segmentado según el producto, la naturaleza, la aplicación y el uso final.
- Por producto
Según el producto, el mercado está segmentado en MOS2, PTFE, grafito, FEP, PFA y disulfuro de tungsteno. El segmento de PTFE tuvo la mayor participación en ingresos del mercado en 2025, impulsado por sus excelentes propiedades de baja fricción, resistencia química y amplia aplicabilidad en componentes automotrices, industriales y aeroespaciales. Los recubrimientos de PTFE son los preferidos para mejorar el rendimiento, reducir el desgaste y prolongar la vida útil de la maquinaria crítica
Se prevé que el segmento MOS2 experimente el mayor crecimiento entre 2026 y 2033, impulsado por su superior capacidad de carga y estabilidad a altas temperaturas, lo que lo hace ideal para aplicaciones de alta resistencia en motores de automóviles, componentes de transmisión de potencia y maquinaria industrial. Los recubrimientos MOS2 son especialmente populares por reducir la fricción en condiciones extremas, mejorar la eficiencia operativa y minimizar los costos de mantenimiento.
- Por naturaleza
Según la naturaleza, el mercado se segmenta en base a disolventes y base agua. El segmento base agua tuvo la mayor participación en 2025, impulsado por las crecientes regulaciones ambientales y la preferencia por soluciones de recubrimiento ecológicas. Los recubrimientos base agua ofrecen emisiones reducidas de COV, mayor seguridad en el lugar de trabajo y cumplimiento de los estándares de sostenibilidad
Se prevé que el segmento de recubrimientos a base de solventes experimente el mayor crecimiento entre 2026 y 2033, impulsado por su alta adhesión, alto rendimiento en condiciones adversas y su idoneidad para aplicaciones industriales y automotrices críticas. Los recubrimientos a base de solventes siguen siendo los preferidos donde se requiere durabilidad y una resistencia operativa extrema.
- Por aplicación
Según la aplicación, el mercado se segmenta en piezas de automoción, artículos de transmisión de potencia, rodamientos, componentes de munición, componentes de válvulas y actuadores, entre otros. El segmento de piezas de automoción tuvo la mayor cuota de mercado en 2025 debido a la creciente demanda de componentes ligeros y de alto rendimiento y a los estrictos estándares de eficiencia automotriz. Los recubrimientos antifricción mejoran la eficiencia del combustible, reducen el desgaste y mejoran la fiabilidad de los sistemas automotrices
Se prevé que el segmento de transmisión de potencia experimente el mayor crecimiento entre 2026 y 2033, impulsado por la creciente automatización industrial y la demanda de cajas de engranajes y maquinaria de alta eficiencia. Los recubrimientos reducen la fricción, mejoran la eficiencia energética y minimizan el tiempo de inactividad, lo que los hace cruciales en las operaciones industriales modernas.
- Por uso final
Según el uso final, el mercado se segmenta en automoción, aeroespacial, marítimo, construcción, atención médica y otros. El segmento automotriz tuvo la mayor participación en los ingresos en 2025, impulsado por la creciente producción de vehículos, la adopción de tecnologías de bajo consumo de combustible y el enfoque en la reducción de los costos de mantenimiento. Los recubrimientos antifricción mejoran el rendimiento del motor, la vida útil de los componentes y la eficiencia general del vehículo
Se prevé que el segmento aeroespacial experimente el mayor crecimiento entre 2026 y 2033, impulsado por la creciente necesidad de componentes ligeros y de alto rendimiento capaces de soportar temperaturas y tensiones extremas. Los recubrimientos proporcionan lubricación superior, resistencia al desgaste y eficiencia energética, aspectos fundamentales para las aplicaciones aeroespaciales.
Análisis regional del mercado de recubrimientos antifricción
- América del Norte dominó el mercado de recubrimientos antifricción con la mayor participación en los ingresos del 38,75 % en 2025, impulsada por la creciente demanda de maquinaria energéticamente eficiente, componentes automotrices y soluciones de automatización industrial.
- Los fabricantes y usuarios finales de la región valoran mucho el rendimiento, la durabilidad y los beneficios de ahorro de energía que ofrecen los recubrimientos antifricción avanzados, que ayudan a reducir los costos de mantenimiento y mejorar la eficiencia operativa.
- Esta adopción generalizada está respaldada además por una alta inversión industrial, una fuerza laboral tecnológicamente capacitada y estándares regulatorios estrictos que promueven procesos de fabricación sustentables y eficientes, estableciendo los recubrimientos antifricción como una solución preferida en múltiples industrias.
Perspectiva del mercado de recubrimientos antifricción en EE. UU.
El mercado estadounidense de recubrimientos antifricción captó la mayor participación en los ingresos en 2025 en Norteamérica, impulsado por el creciente enfoque en la reducción del consumo energético y la prolongación de la vida útil de los equipos. Los sectores automotriz, aeroespacial e industrial están adoptando activamente recubrimientos que mejoran el rendimiento mecánico y reducen el desgaste. La creciente inversión en maquinaria de alta velocidad, sistemas de transmisión de potencia y componentes de precisión, junto con el énfasis regulatorio en la eficiencia del combustible y la reducción de emisiones, impulsa aún más el mercado. Además, las innovaciones en formulaciones de recubrimientos ecológicos y las tecnologías de aplicación avanzadas contribuyen significativamente a la expansión del mercado.
Análisis del mercado europeo de recubrimientos antifricción
Se prevé que el mercado europeo de recubrimientos antifricción experimente su mayor crecimiento entre 2026 y 2033, impulsado principalmente por las estrictas normativas ambientales y de eficiencia, junto con la modernización de los sectores industrial y automotriz. La adopción de recubrimientos en maquinaria, rodamientos y componentes automotrices energéticamente eficientes está en aumento a medida que los fabricantes se esfuerzan por cumplir con los objetivos de sostenibilidad. Los consumidores y actores industriales europeos también se ven atraídos por la mayor vida útil de los equipos y la reducción de los costos operativos que ofrecen estos recubrimientos. La región está experimentando un crecimiento en las aplicaciones automotrices, aeroespaciales e industriales, con la incorporación de recubrimientos antifricción tanto en nuevas instalaciones de fabricación como en proyectos de modernización.
Análisis del mercado de recubrimientos antifricción en el Reino Unido
Se prevé que el mercado británico de recubrimientos antifricción experimente su mayor crecimiento entre 2026 y 2033, impulsado por la creciente tendencia a la automatización industrial y la demanda de componentes de alto rendimiento y bajo mantenimiento. El creciente énfasis en la eficiencia energética y el cumplimiento normativo ambiental está animando a las empresas a adoptar recubrimientos avanzados para aplicaciones de automoción, aeroespacial y maquinaria industrial. Se prevé que la avanzada infraestructura de fabricación del Reino Unido, combinada con una sólida capacidad de I+D, siga impulsando el crecimiento del mercado.
Análisis del mercado alemán de recubrimientos antifricción
Se prevé que el mercado alemán de recubrimientos antifricción experimente su mayor crecimiento entre 2026 y 2033, impulsado por la adopción de ingeniería de precisión y maquinaria de alta tecnología, junto con la apuesta por la sostenibilidad y las soluciones de eficiencia energética. La sólida base industrial alemana, especialmente en los sectores automotriz y manufacturero, promueve la integración de recubrimientos antifricción avanzados. La función de estos recubrimientos en la reducción del desgaste, la prolongación de la vida útil de los componentes y la mejora de la eficiencia energética se alinea con las normas industriales y las regulaciones ambientales locales, lo que impulsa su adopción constante en el mercado.
Análisis del mercado de recubrimientos antifricción en Asia-Pacífico
Se prevé que el mercado de recubrimientos antifricción en Asia-Pacífico experimente su mayor crecimiento entre 2026 y 2033, impulsado por la creciente industrialización, la rápida producción de automóviles y maquinaria, y los avances tecnológicos en países como China, Japón e India. El creciente énfasis de la región en la eficiencia energética, los componentes de bajo mantenimiento y las prácticas industriales sostenibles está impulsando la adopción de recubrimientos antifricción avanzados. Además, el surgimiento de Asia-Pacífico como centro de fabricación de componentes automotrices e industriales está mejorando la asequibilidad y la accesibilidad, ampliando el mercado a una base de clientes más amplia.
Análisis del mercado de recubrimientos antifricción en Japón
Se prevé que el mercado japonés de recubrimientos antifricción experimente su mayor crecimiento entre 2026 y 2033 debido a la cultura de fabricación de alta tecnología del país, la demanda de maquinaria de precisión y el énfasis en la eficiencia energética. Los fabricantes japoneses están adoptando cada vez más recubrimientos para aplicaciones automotrices, aeroespaciales e industriales con el fin de reducir la fricción, prolongar la vida útil de los componentes y reducir los costos operativos. Las innovaciones en formulaciones ecológicas y técnicas de aplicación avanzadas impulsan aún más su adopción en los sectores residencial, comercial e industrial.
Análisis del mercado de recubrimientos antifricción en China
El mercado chino de recubrimientos antifricción representó la mayor cuota de mercado en ingresos en Asia-Pacífico en 2025, gracias a la rápida industrialización del país, la expansión de la base manufacturera de automóviles y maquinaria, y la creciente apuesta por soluciones de eficiencia energética. Los recubrimientos antifricción se están popularizando en autopartes, componentes de transmisión de potencia y maquinaria industrial, lo que contribuye a un menor mantenimiento, un mejor rendimiento mecánico y a los objetivos de sostenibilidad. Los incentivos gubernamentales para prácticas de fabricación energéticamente eficientes y respetuosas con el medio ambiente, junto con una sólida capacidad de producción nacional, son factores clave que impulsan el mercado en China.
Cuota de mercado de recubrimientos antifricción
La industria de recubrimientos antifricción está liderada principalmente por empresas bien establecidas, entre las que se incluyen:
- DuPont (EE. UU.)
- Parker Hannifin Corp (EE. UU.)
- CARL BECHEM GMBH (Alemania)
- ASV Mutichemie Private Limited (India)
- Whitmore Manufacturing LLC (EE. UU.)
- FUCHS LUBRITECH GmbH (Alemania)
- Lubrizol Corporation (EE. UU.)
- Klüber Lubrication (Alemania)
- Royal DSM NV (Países Bajos)
- Evonik Industries AG (Alemania)
Últimos avances en el mercado mundial de recubrimientos antifricción
- En mayo de 2021, DuPont lanzó la grasa MOLYKOTE G-1079, un recubrimiento antifricción con reducción de ruido, diseñado específicamente para aplicaciones de contacto deslizante en actuadores, incluidos los vehículos eléctricos de nueva generación. La nueva formulación mejora el rendimiento tanto en movimientos rápidos con cargas elevadas como en movimientos lentos con cargas reducidas, lo que mejora la eficiencia operativa y la longevidad de los componentes. Esta innovación fortalece la cartera de productos de DuPont y se espera que impulse las ventas en el mercado al satisfacer la creciente demanda de lubricantes avanzados de alto rendimiento en los sectores automotriz e industrial.
- En abril de 2021, Whitmore Manufacturing, LLC presentó Lustor, un sistema escalable de almacenamiento y dispensación de lubricantes. Esta unidad compacta y duradera prolonga la vida útil de los lubricantes y se adapta a prácticamente cualquier ubicación industrial, ofreciendo mayor eficiencia y facilidad de uso. Este desarrollo facilita la optimización operativa para clientes industriales y fortalece la presencia de Whitmore Manufacturing en el mercado, contribuyendo positivamente al crecimiento de los ingresos y a la adopción de soluciones de lubricación avanzadas.
SKU-
Obtenga acceso en línea al informe sobre la primera nube de inteligencia de mercado del mundo

- Panel de análisis de datos interactivo
- Panel de análisis de empresas para oportunidades con alto potencial de crecimiento
- Acceso de analista de investigación para personalización y consultas
- Análisis de la competencia con panel interactivo
- Últimas noticias, actualizaciones y análisis de tendencias
- Aproveche el poder del análisis de referencia para un seguimiento integral de la competencia
Metodología de investigación
La recopilación de datos y el análisis del año base se realizan utilizando módulos de recopilación de datos con muestras de gran tamaño. La etapa incluye la obtención de información de mercado o datos relacionados a través de varias fuentes y estrategias. Incluye el examen y la planificación de todos los datos adquiridos del pasado con antelación. Asimismo, abarca el examen de las inconsistencias de información observadas en diferentes fuentes de información. Los datos de mercado se analizan y estiman utilizando modelos estadísticos y coherentes de mercado. Además, el análisis de la participación de mercado y el análisis de tendencias clave son los principales factores de éxito en el informe de mercado. Para obtener más información, solicite una llamada de un analista o envíe su consulta.
La metodología de investigación clave utilizada por el equipo de investigación de DBMR es la triangulación de datos, que implica la extracción de datos, el análisis del impacto de las variables de datos en el mercado y la validación primaria (experto en la industria). Los modelos de datos incluyen cuadrícula de posicionamiento de proveedores, análisis de línea de tiempo de mercado, descripción general y guía del mercado, cuadrícula de posicionamiento de la empresa, análisis de patentes, análisis de precios, análisis de participación de mercado de la empresa, estándares de medición, análisis global versus regional y de participación de proveedores. Para obtener más información sobre la metodología de investigación, envíe una consulta para hablar con nuestros expertos de la industria.
Personalización disponible
Data Bridge Market Research es líder en investigación formativa avanzada. Nos enorgullecemos de brindar servicios a nuestros clientes existentes y nuevos con datos y análisis que coinciden y se adaptan a sus objetivos. El informe se puede personalizar para incluir análisis de tendencias de precios de marcas objetivo, comprensión del mercado de países adicionales (solicite la lista de países), datos de resultados de ensayos clínicos, revisión de literatura, análisis de mercado renovado y base de productos. El análisis de mercado de competidores objetivo se puede analizar desde análisis basados en tecnología hasta estrategias de cartera de mercado. Podemos agregar tantos competidores sobre los que necesite datos en el formato y estilo de datos que esté buscando. Nuestro equipo de analistas también puede proporcionarle datos en archivos de Excel sin procesar, tablas dinámicas (libro de datos) o puede ayudarlo a crear presentaciones a partir de los conjuntos de datos disponibles en el informe.

