

Mercado mundial de leche A2, por forma (polvo y líquido), naturaleza (orgánica y convencional), contenido de grasa (sin grasa, bajo en grasa, reducido en grasa y entera), tamaño del envase (101-250 ml/g, 250-500 ml/g, 501-1000 ml/g y más de 1000 ml/g), forma del envase (botellas, cartones, latas, frascos y otros), canal de distribución (minoristas con sede en tiendas y minoristas sin tiendas): tendencias de la industria y pronóstico hasta 2029.
Análisis y tamaño del mercado de leche A2
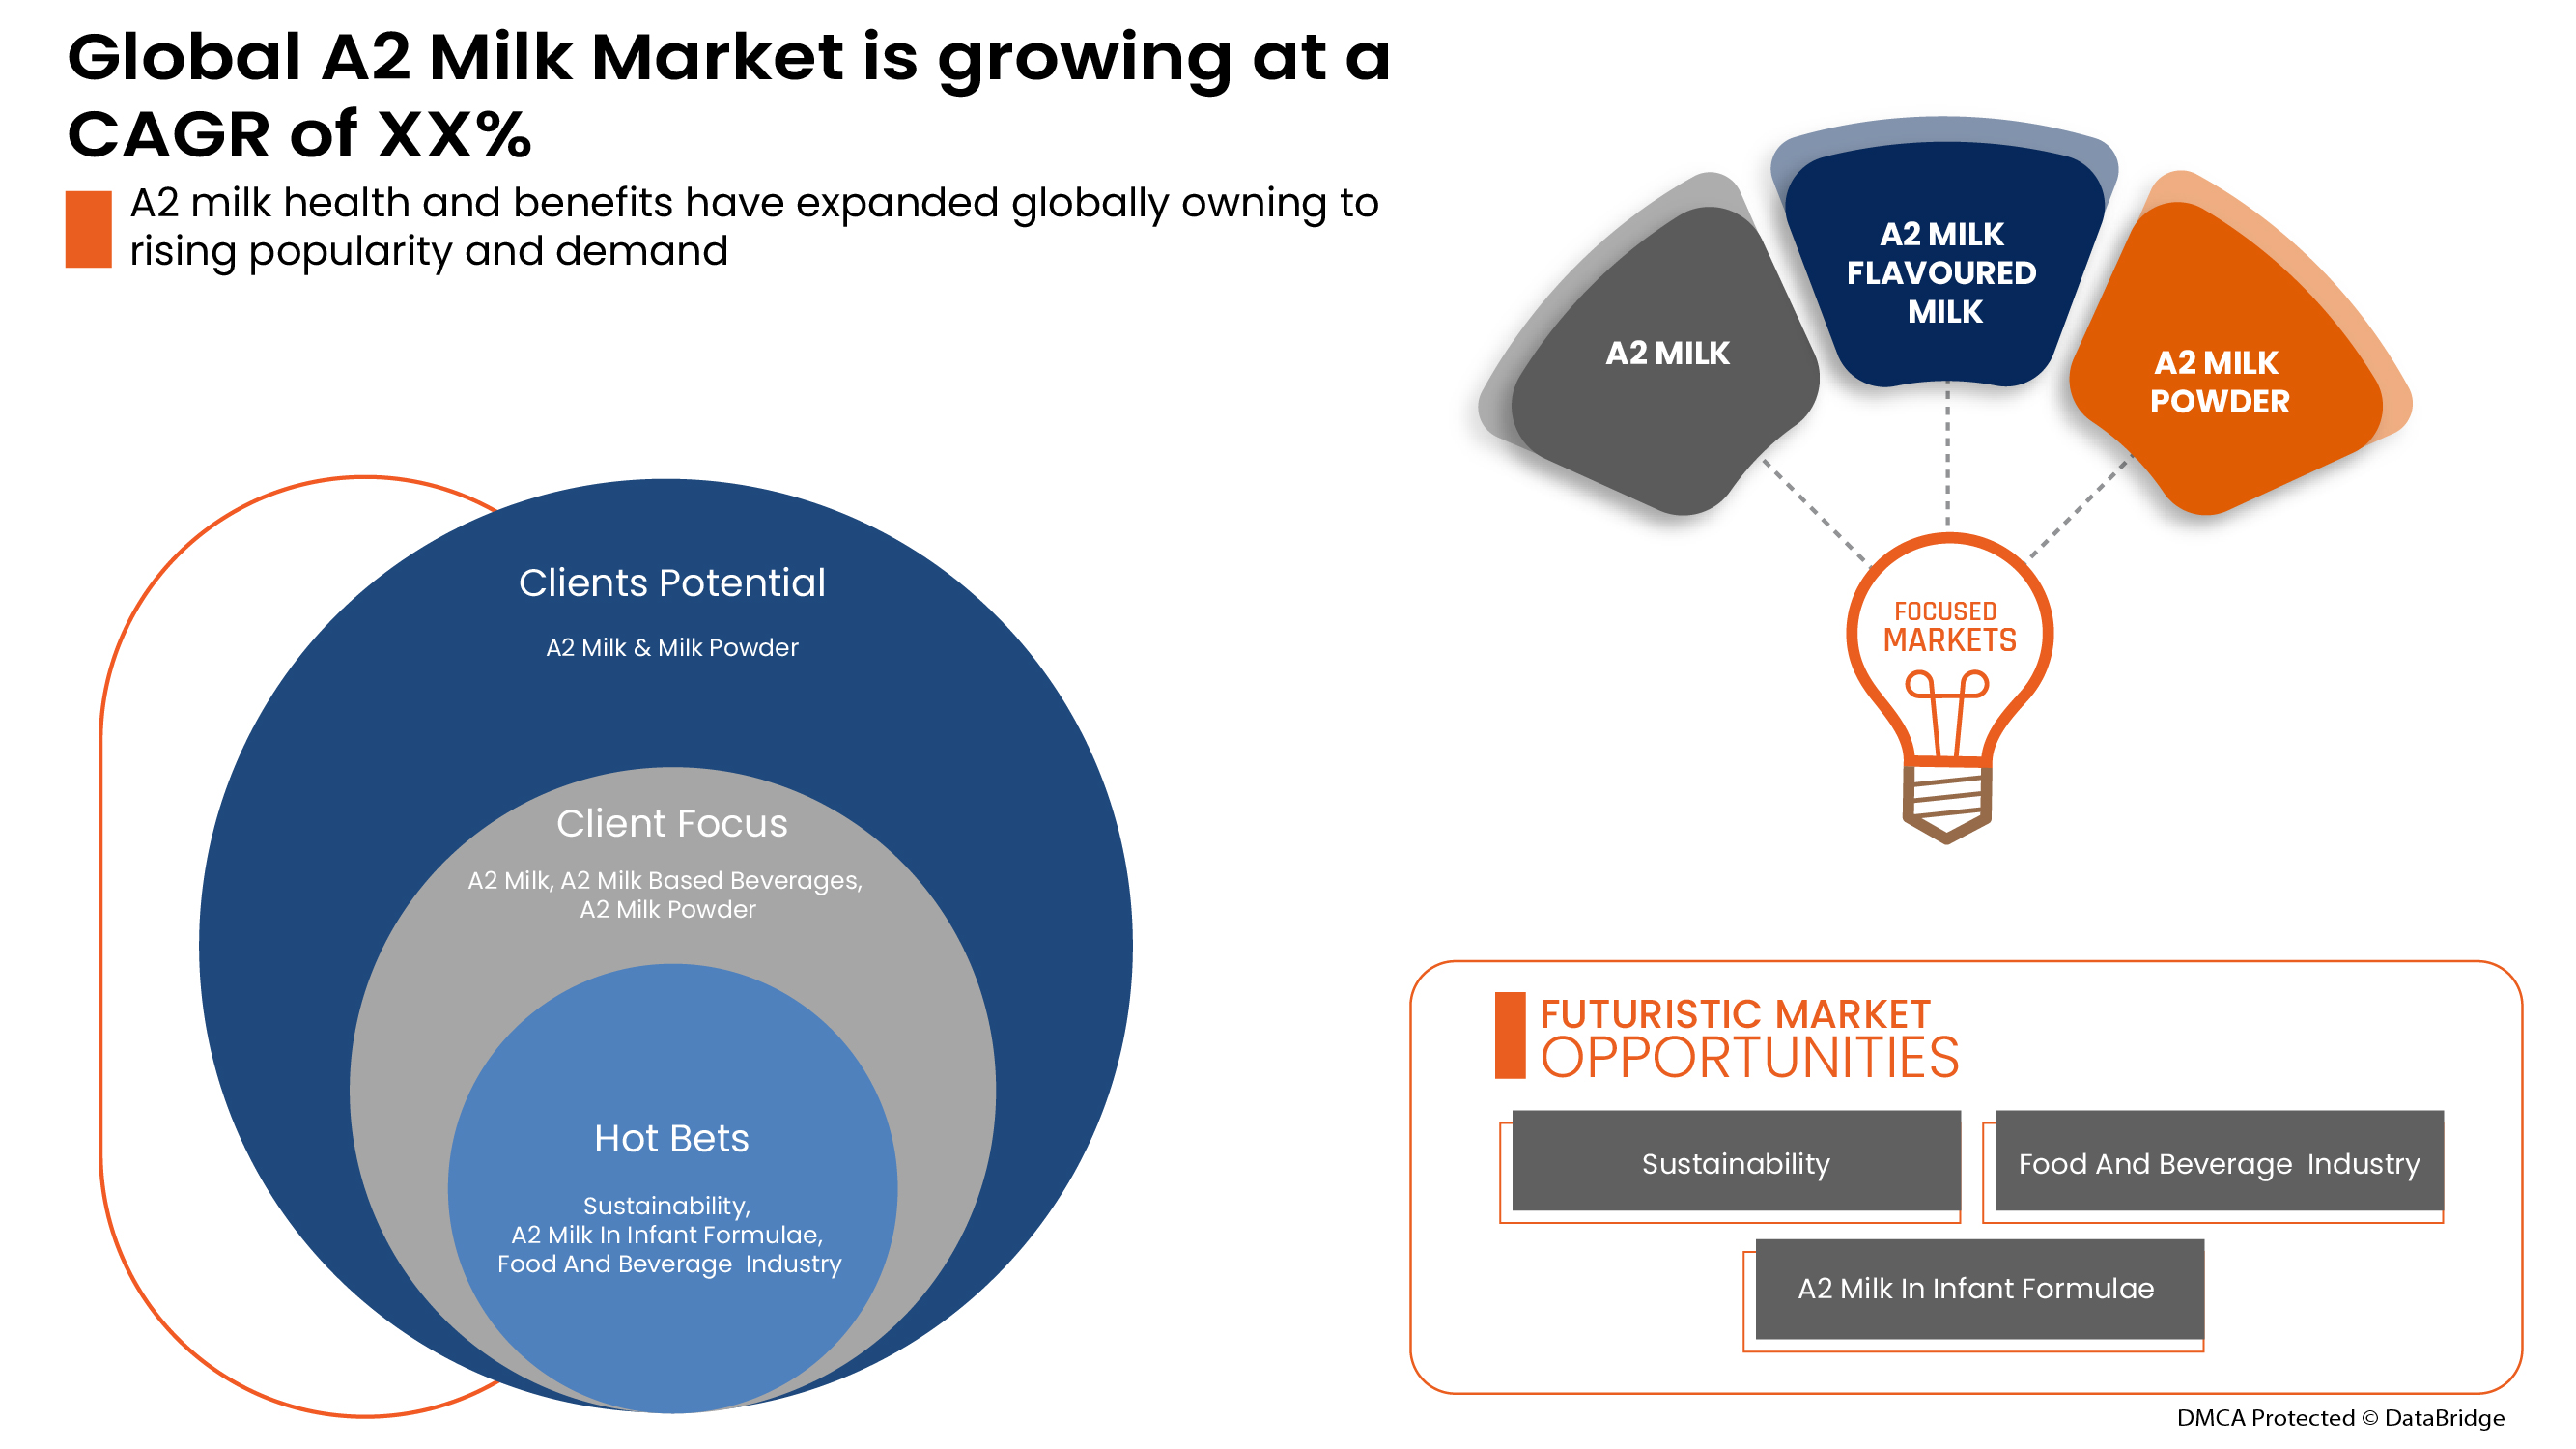
La leche A2 ayuda al desarrollo de la inmunidad, estimula el metabolismo y aporta ácidos grasos Omega 3. La leche A2 está creciendo de forma significativa debido a la creciente conciencia de los consumidores sobre su salud y a su alto contenido nutricional en comparación con la leche normal. Está disponible en varias formas y es fácil de conseguir en el mercado. Sin embargo, se espera que los altos precios de la leche A2 y sus productos limiten el crecimiento del mercado de la leche A2 durante el período previsto.
Algunos de los factores que impulsan el crecimiento del mercado son el aumento de la tecnología de la leche A2, la creciente aplicación de la leche A2 en fórmulas infantiles que están impulsando el mercado y la creciente conciencia sobre la salud entre los consumidores. Sin embargo, se espera que las limitaciones en los altos precios de la leche A2 obstaculicen el crecimiento del mercado.
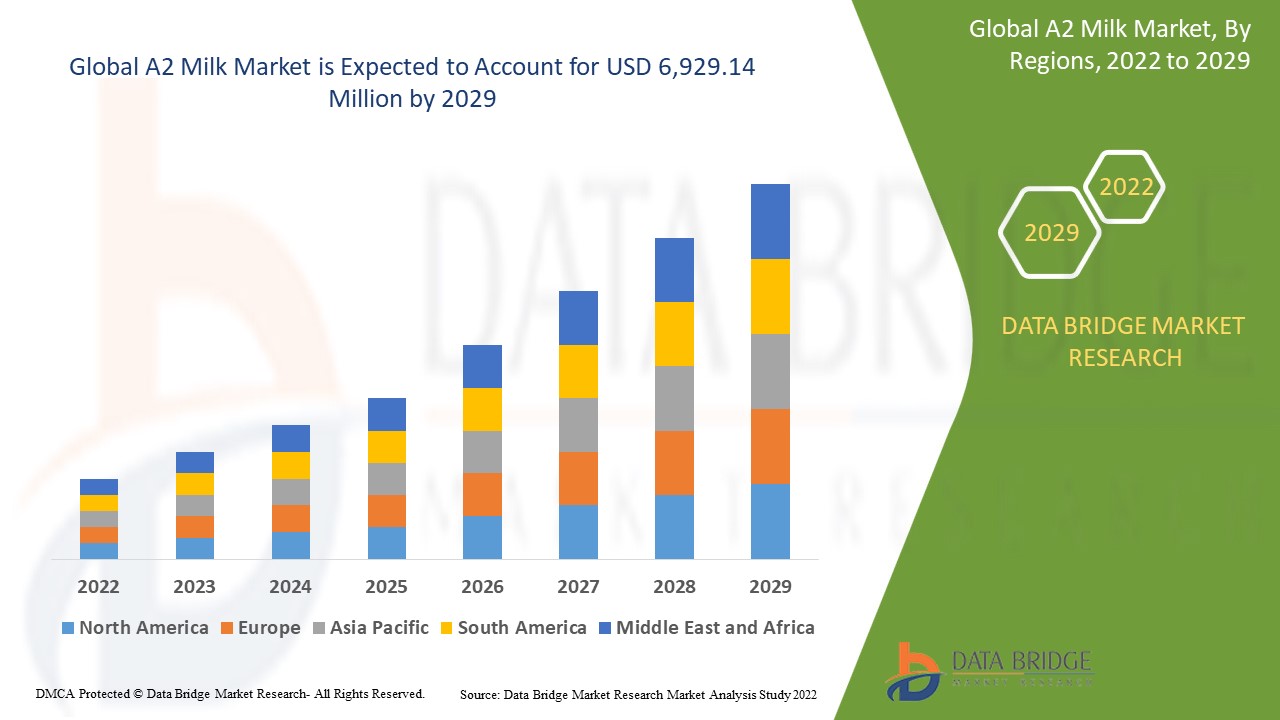
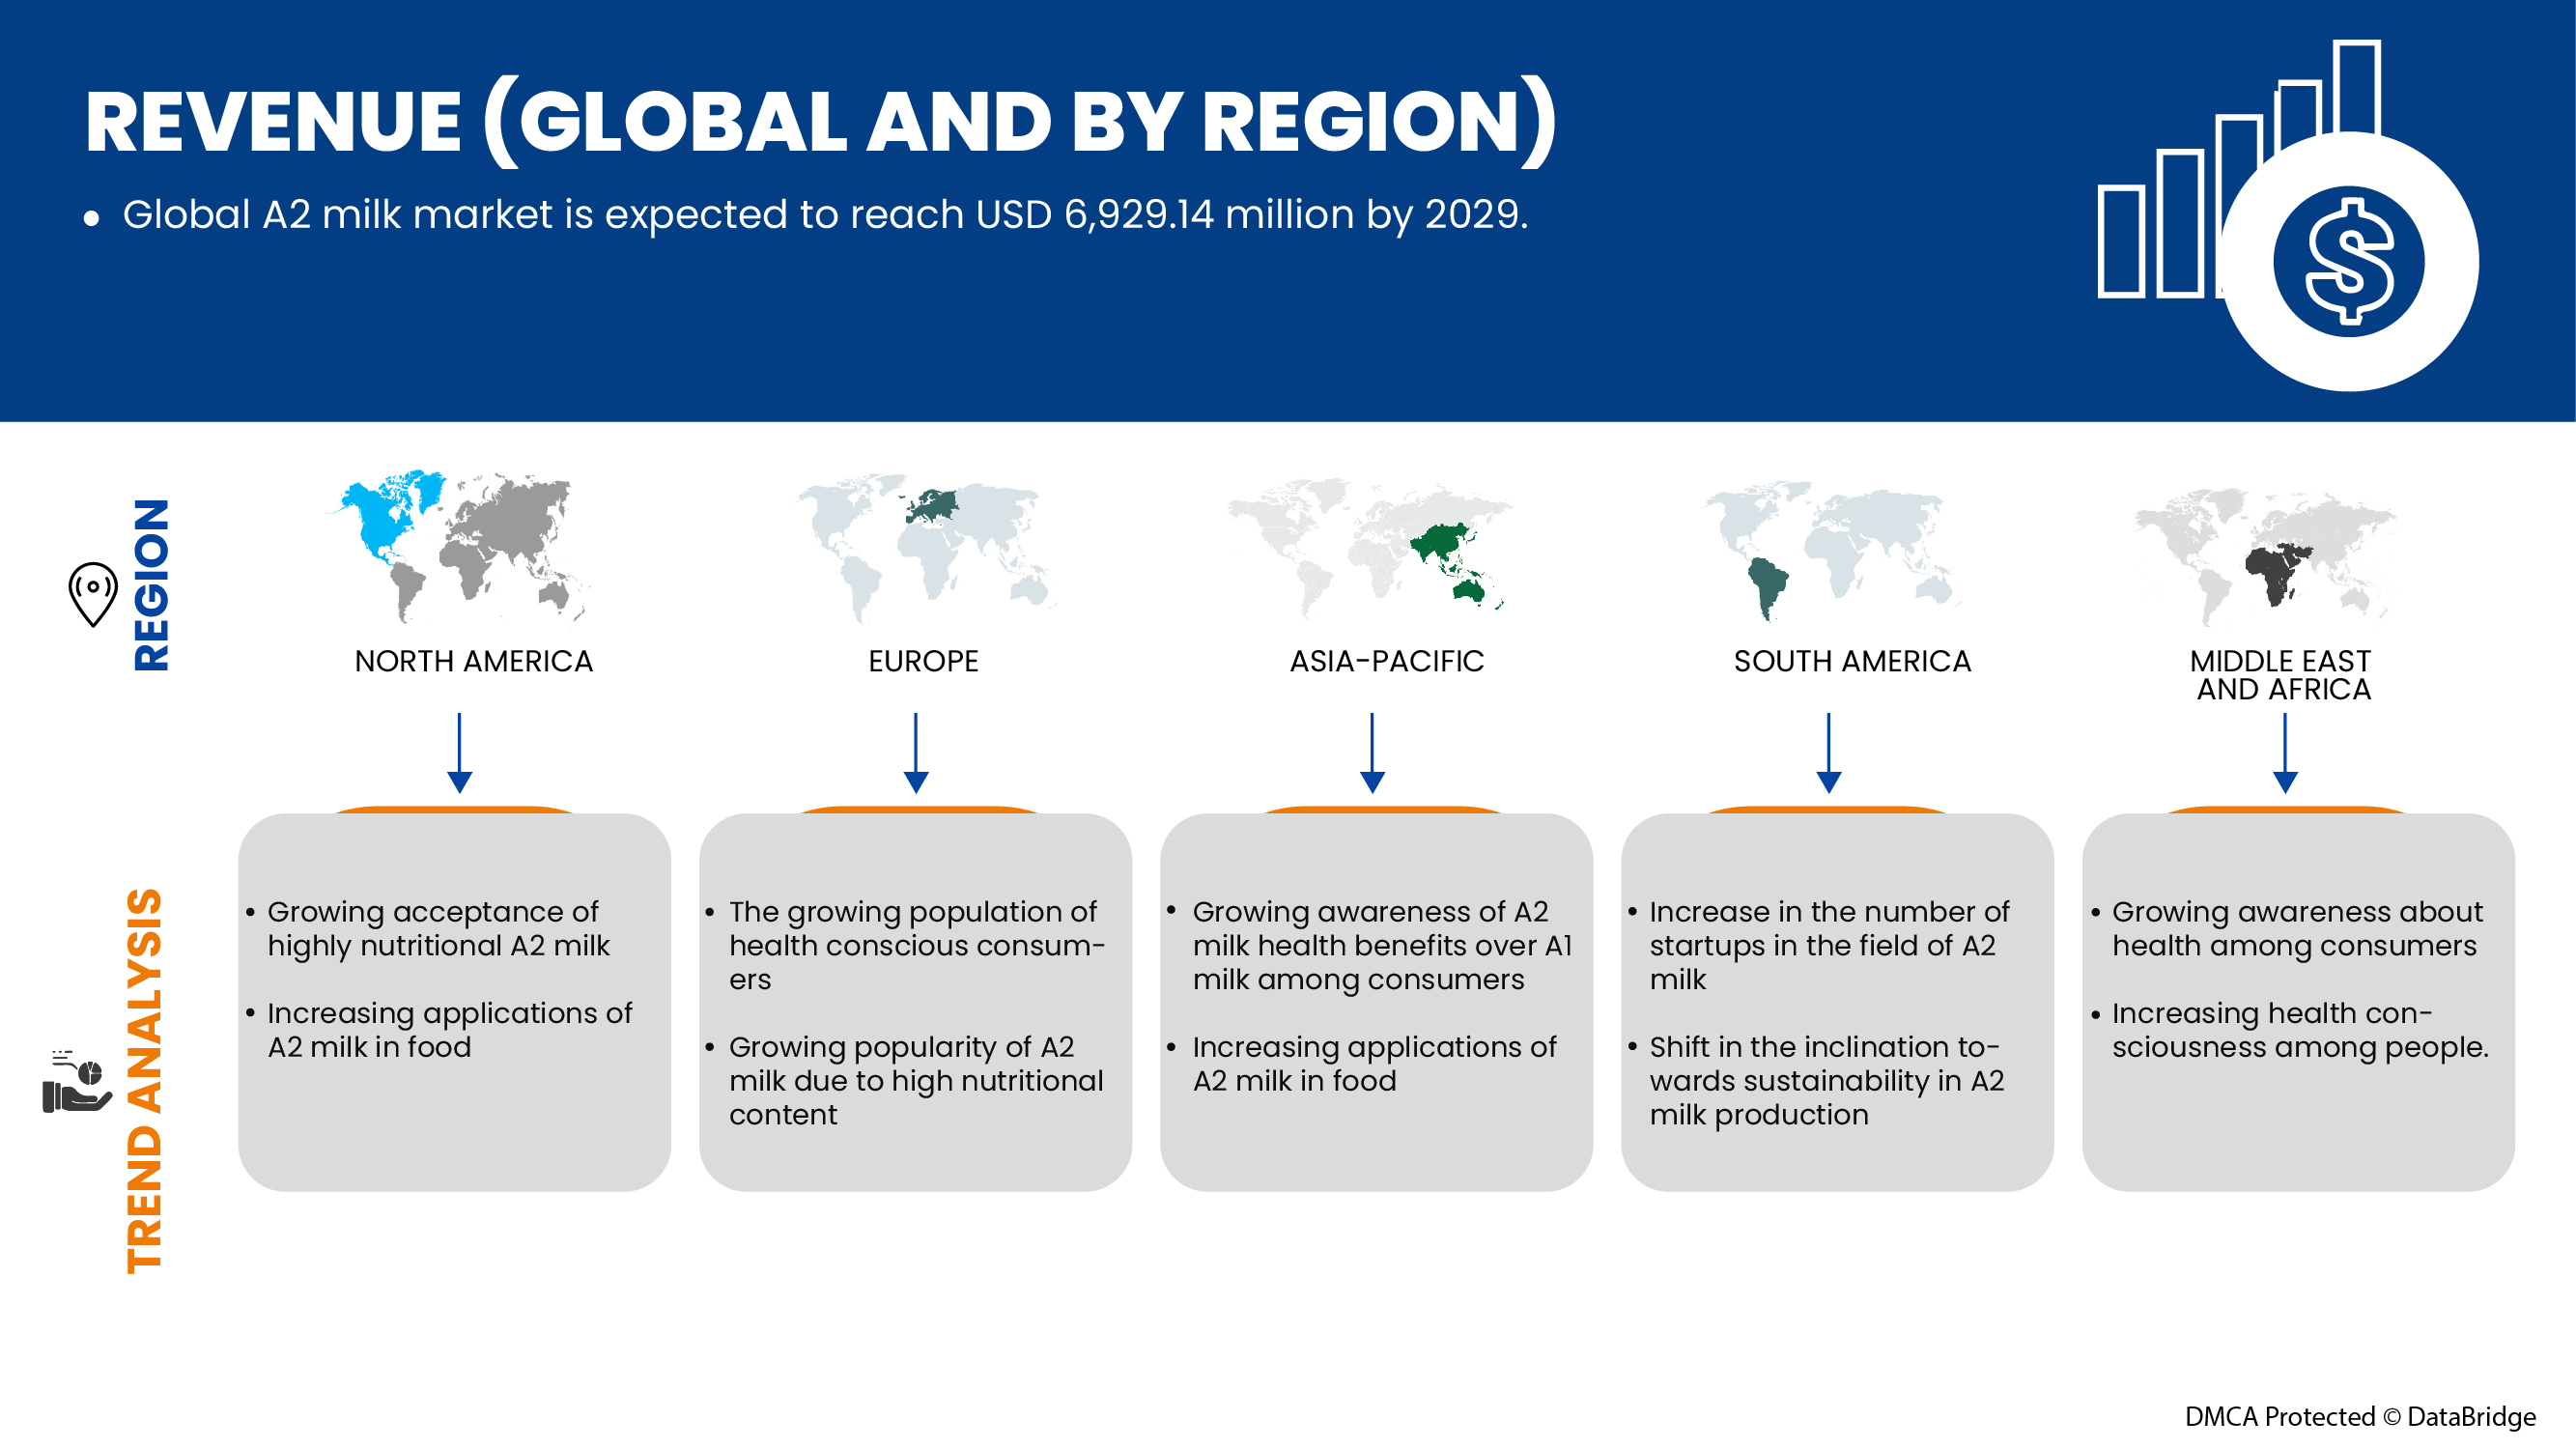
Data Bridge Market Research analiza que se espera que el mercado de leche A2 alcance los USD 6.929,14 millones para 2029, con una CAGR del 21,7% durante el período de pronóstico.
|
Métrica del informe |
Detalles |
|
Período de pronóstico |
2022 a 2029 |
|
Año base |
2021 |
|
Año histórico |
2020 (Personalizable para 2019-2014) |
|
Unidades cuantitativas |
Ingresos en millones de USD, precios en USD |
|
Segmentos cubiertos |
Por forma (polvo y líquido), naturaleza (orgánica y convencional), contenido de grasa (sin grasa, bajo en grasa, reducido en grasa y con grasa entera), tamaño del envase (101-250 ml/g, 250-500 ml/g, 501-1000 ml/g y más de 1000 ml/g), forma del envase (botellas, cartones, latas, frascos y otros) y canal de distribución (minoristas con sede en tiendas y minoristas sin tiendas) |
|
Países cubiertos |
EE. UU., Canadá y México, Alemania, Reino Unido, Italia, Francia, España, Suiza, Países Bajos, Bélgica, Rusia, Turquía, resto de Europa, China, Nueva Zelanda, Australia, India, Malasia, Singapur, Corea del Sur, Indonesia, Japón, Filipinas, Tailandia y resto de Asia Pacífico, Sudáfrica, Emiratos Árabes Unidos, Arabia Saudita, Kuwait y resto de Medio Oriente y África, Brasil, Argentina y resto de Sudamérica. |
|
Actores del mercado cubiertos |
Español: GCMMF, Erden Creamery Pvt Ltd, PROVILAC, Ripley Farms LLC., Taw River Dairy, The a2 Milk Company Limited, Urban Farms Milk., Vedaaz Organics Pvt. Ltd., AVTARAN MILK, DOFE, Captain's Farm., Ksheerdham., Ayuda Organics, Veco Zuivel BV y Australia's Own. |
Definición de mercado
La leche A2 es un tipo de leche de vaca que carece de la forma A1 de las proteínas de la beta-caseína y que contiene principalmente la forma A2. La proteína beta-caseína A2 de la leche A2 se descompone rápidamente en aminoácidos para una digestión rápida, mejorando nuestra salud general y aumentando el valor nutricional de la leche de vaca. La leche de vaca A2 contiene minerales como calcio, potasio y fósforo, que son necesarios para tener huesos y dientes fuertes, una mejor función muscular, la regulación de la presión arterial, el crecimiento de los tejidos y las células y la mejora del colesterol bueno (HDL), además de mantener la nutrición general y el bienestar del cuerpo.
Dinámica del mercado de la leche A2
En esta sección se aborda la comprensión de los factores impulsores, las ventajas, las oportunidades, las limitaciones y los desafíos del mercado. Todo esto se analiza en detalle a continuación:
Conductores:
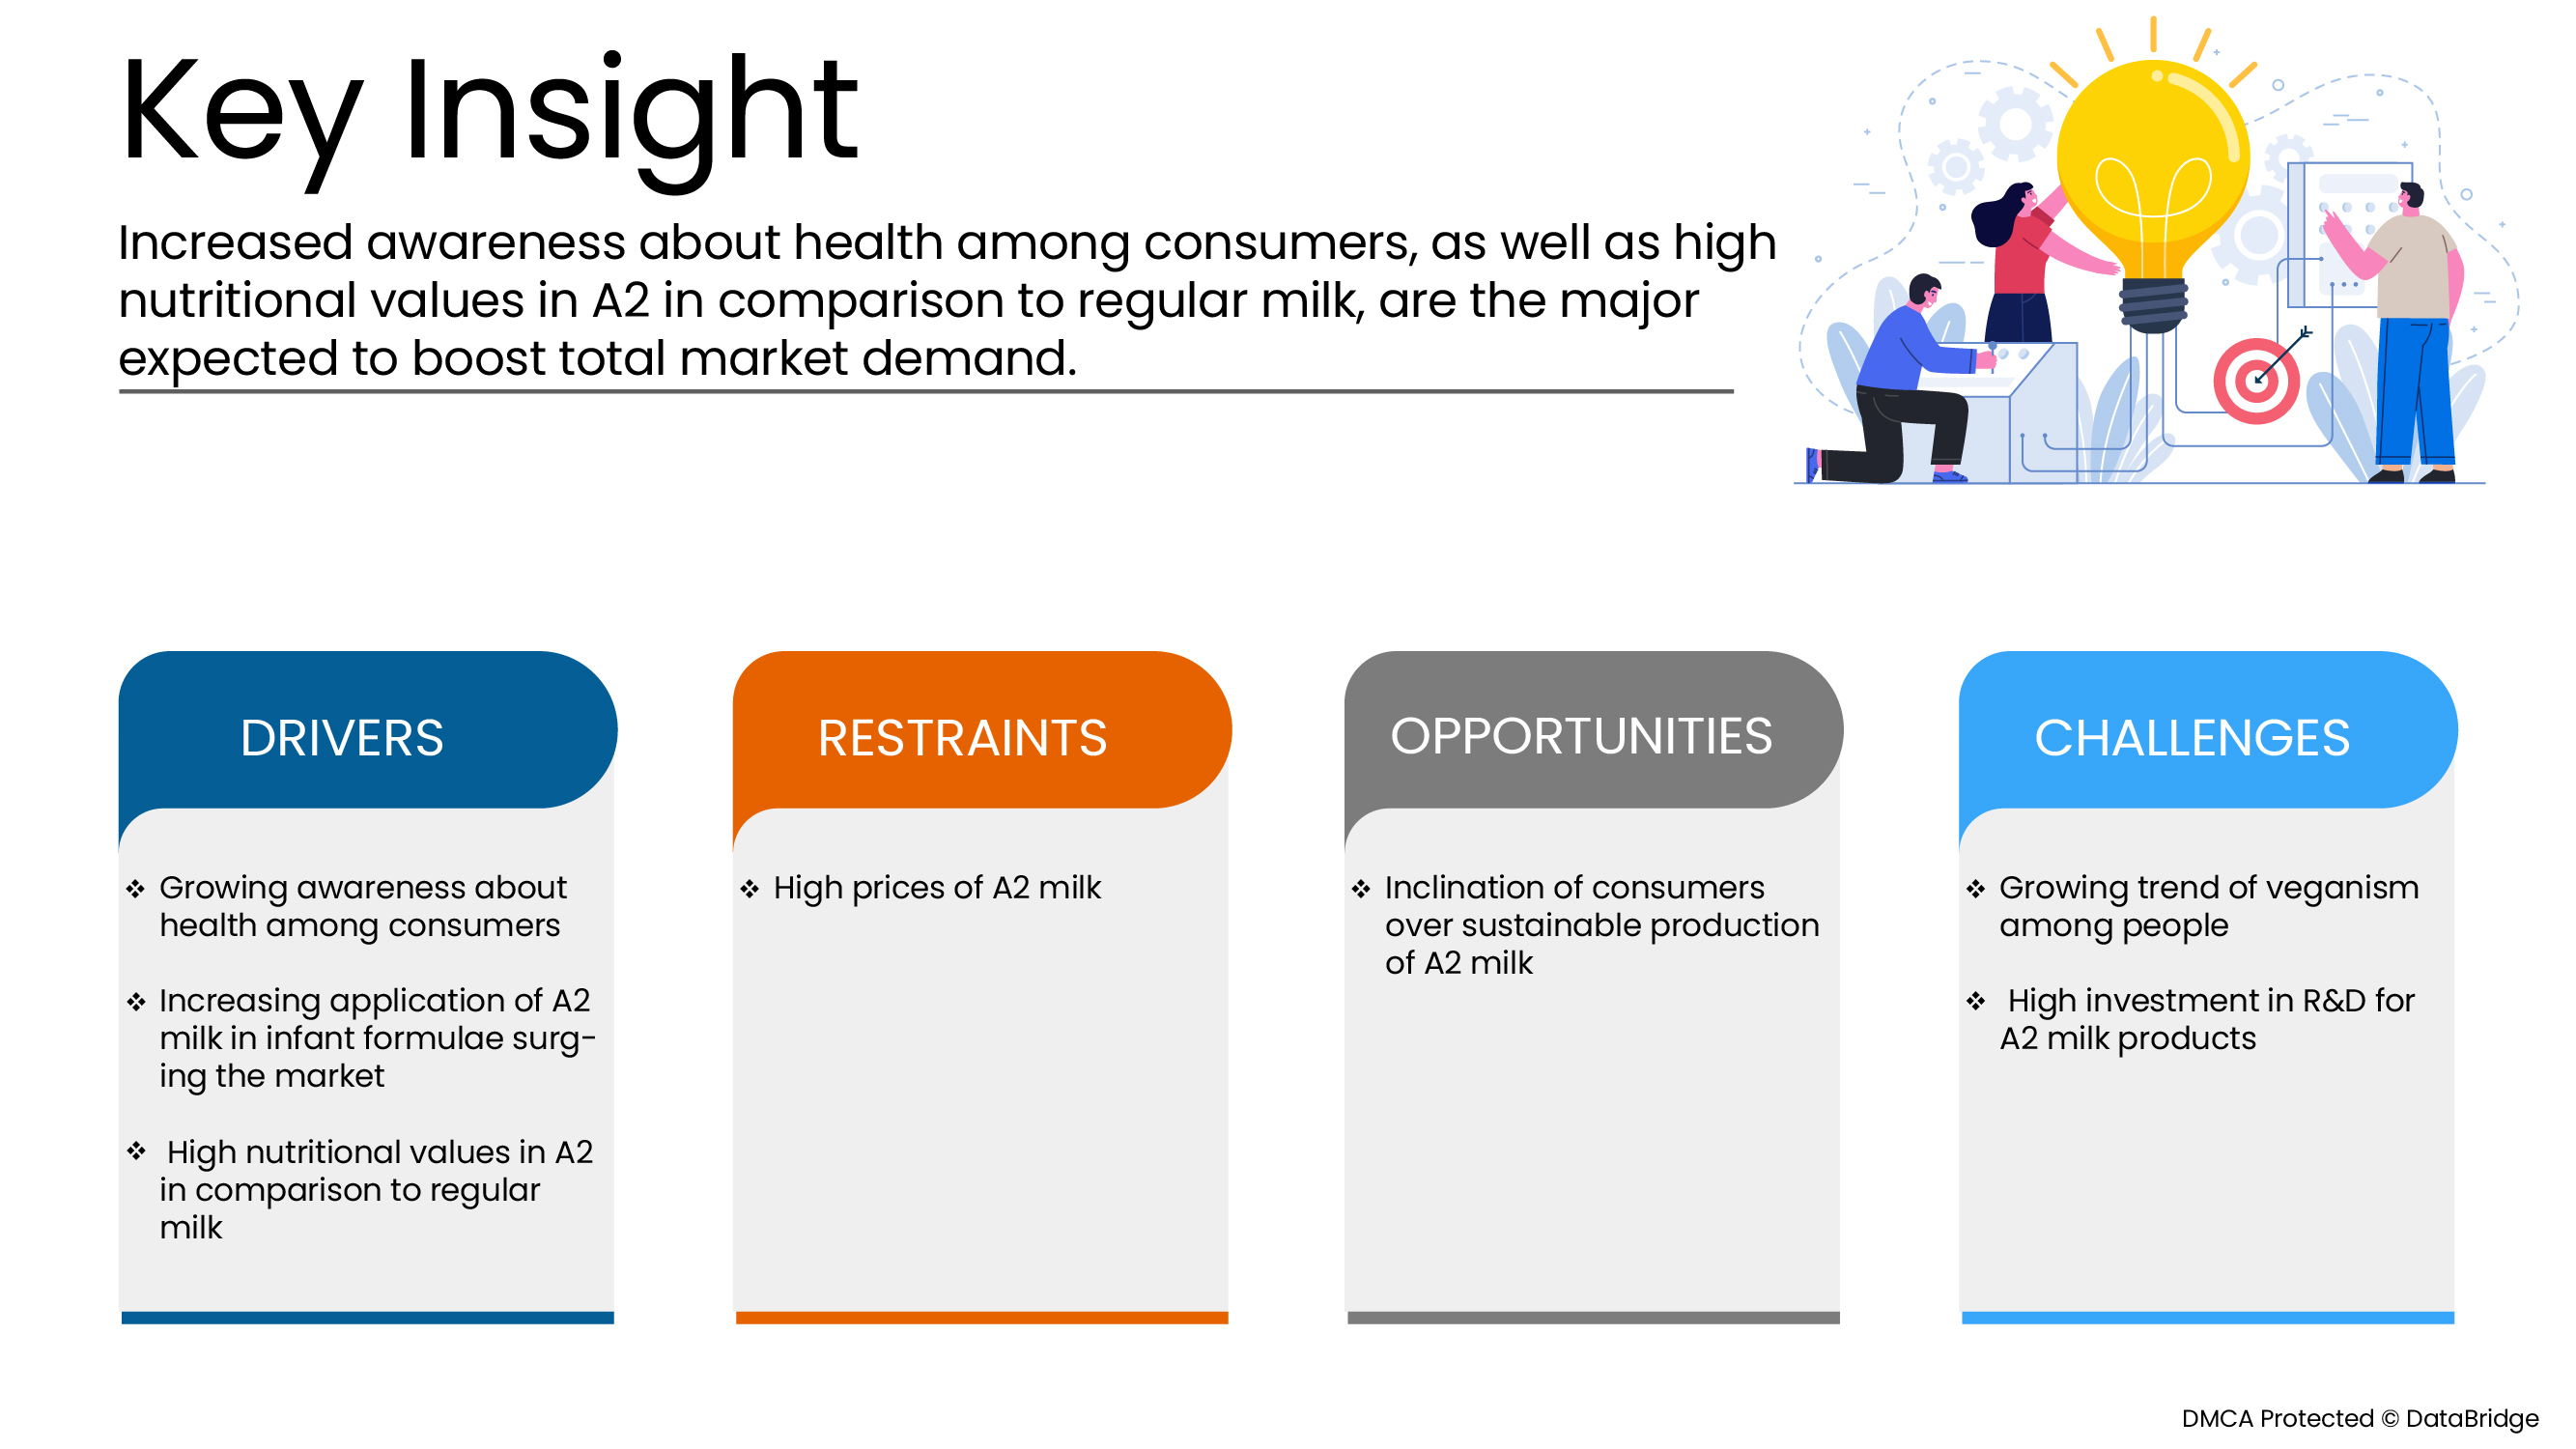
- Mayor conciencia sobre la salud entre los consumidores
La creciente conciencia sobre la salud, la ingesta de alimentos y las dietas entre los consumidores es la principal fuerza impulsora del mercado mundial de la leche A2. Con el tiempo, los consumidores conocen los pros y los contras de los alimentos que consumen a diario. La leche A2 es muy nutritiva y tiene un impacto positivo en el cuerpo de una persona debido a la presencia de la proteína beta-caseína A2. Esta proteína A2 previene diversas enfermedades cardíacas, diabetes y autismo. Con esto, las personas consumen leche A2 y la prefieren para el consumo regular. Se espera que este cambio en la preferencia y el desarrollo de la conciencia hacia la salud impulse el crecimiento del mercado mundial de la leche A2.
Por lo tanto, la creciente conciencia de la salud y los cambios en los hábitos alimentarios de los usuarios finales están generando una mayor demanda de leche A2. Se espera que esta creciente demanda de leche A2 impulse el mercado mundial de leche A2.
- Altos valores nutricionales en a2 en comparación con la leche normal
La leche A2 difiere en el tipo de proteína y la estructura de la leche A1. La leche A2 es la mejor opción para reforzar la inmunidad y mantenerse saludable, y reemplazar la leche regular por leche A2 beneficia tanto la mente como el cuerpo al mejorar la función cognitiva y nutrir la piel y el cabello. Además, la leche A2 previene problemas como enfermedades cardíacas, intolerancia a la lactosa, diabetes y autismo. Con una nutrición abundante y numerosos beneficios para la salud, la demanda de leche A2 por parte de los consumidores está aumentando rápidamente. Los usuarios finales prefieren la leche A2 a la leche regular en diferentes productos lácteos para mantener una buena salud. Por lo tanto, se ha demostrado que la leche A2 es más nutritiva que la leche regular.
Por lo tanto, el alto valor nutricional y el mayor contenido mineral de la leche A2 están generando una mayor demanda y ventas de leche A2 en el mercado. Con esta creciente demanda, se espera que el mercado mundial de leche A2 crezca significativamente.
Restricción
- Precios altos de la leche a2
Los altos precios de la leche A2 en comparación con la leche normal son un importante factor limitante para el crecimiento del mercado. La leche A2 y los productos lácteos tienen un rango de precios que duplica el de la leche normal en el mercado. La producción de leche A2 sigue siendo limitada, ya que las razas de vacas lecheras A2 producen menos leche por día y, debido a esto, las empresas cobran altos costos por la leche A2 para generar mayores ingresos. Los usuarios finales de los productos lácteos A2 son la gente común y la presencia de leche A2 en el mercado con un rango más alto no es asequible para mucha gente. Debido a los grados más altos, la gente prefiere la leche normal a la leche A2 y sus productos. Estos altos precios de la leche son un factor limitante importante en el crecimiento del mercado.
Por lo tanto, los altos precios de la leche y los productos lácteos de categoría A2 permiten que los consumidores utilicen leche normal, lo que, a su vez, se espera que frene el crecimiento del mercado mundial de la leche de categoría A2.
Oportunidad
- Inclinación de los consumidores por la producción sostenible de leche a2
La sostenibilidad protege la salud y la biocapacidad del medio ambiente. El bienestar individual y comunitario se ve favorecido por la sostenibilidad. La sostenibilidad promueve una mejor economía con menos contaminación y residuos, menos emisiones, más empleo y una distribución equitativa de la riqueza. Un enfoque sostenible de la producción de leche A2 reduce el impacto ambiental de la ganadería lechera, al tiempo que aumenta el bienestar animal y el respaldo social del sector lácteo. Los consumidores con estándares morales más elevados tienen más probabilidades de estar interesados en comprar productos lácteos A2 que utilicen innovaciones sostenibles. Los consumidores orgánicos habituales tienen una actitud más favorable hacia los productos lácteos que utilizan innovaciones sostenibles. Como resultado, muchas empresas basadas en leche A2 se centran en la sostenibilidad en su producción, procesamiento, envasado y otros procesos.
Por lo tanto, la implementación de enfoques sustentables en casi todas las etapas de la producción de leche A2 y productos lácteos A2 ha brindado varias oportunidades para el crecimiento del mercado incluso en el período pronosticado porque los consumidores prefieren principalmente productos sustentables y orgánicos.
Desafío
- Crecimiento de la tendencia del veganismo entre las personas
El veganismo es un estilo de vida que aboga por eliminar los productos animales de la dieta, en especial los lácteos, la carne y las aves de corral. El veganismo se ha convertido en una tendencia hacia una vida más saludable a medida que más personas se vuelven conscientes del daño que está causando al medio ambiente y a las especies animales. La lógica del veganismo es dejar de estresar, explotar y matar a los animales para poner fin a su especie. Esta tendencia vegana trae consigo alternativas a la leche más naturales, por lo que la mayoría de las personas veganas adoptadas evitan los productos a base de leche A2, a pesar de que la leche A2 tiene un mayor beneficio nutricional que otros. Dado que la leche A2 es un producto de origen animal, la tendencia vegana planteará un desafío significativo para el crecimiento del mercado de la leche A2.
Por lo tanto, la tendencia al veganismo lleva a una opción mínima por los productos lácteos por parte de los consumidores, por lo que se espera que esta tendencia del veganismo entre las personas sea un desafío importante para el crecimiento del mercado mundial de la leche A2.
Impacto post COVID-19 en el mercado mundial de leche A2
Después de la pandemia, la demanda de leche A2 ha aumentado, ya que no habrá restricciones de movimiento; por lo tanto, el suministro de productos será fácil. La persistencia de COVID-19 durante un período más largo ha afectado a la cadena de suministro, ya que se vio interrumpida y se volvió difícil suministrar productos alimenticios a los consumidores, lo que inicialmente aumentó la demanda de productos. Sin embargo, después de COVID, la necesidad de leche A2 ha aumentado significativamente debido al buen contenido de proteínas y otros nutrientes disponibles.
Acontecimientos recientes
- En agosto de 2022, a2 Milk Company (a2MC) se asociará con KidsCan, la principal organización de Nueva Zelanda que apoya a los niños desfavorecidos. Como socio principal, a2MC donará 130 000 dólares anuales durante los primeros tres años para ayudar a financiar los programas de KidsCan y organizará el voluntariado del personal y de los amigos para apoyar a KidsCan en el cumplimiento de su importante misión.
- En mayo de 2022, a2 Milk Company y la Universidad de Lincoln colaborarán para presentar un nuevo programa de apoyo a las iniciativas de producción lechera sostenible en Nueva Zelanda. La a2 Milk Company y la Universidad de Lincoln, la única universidad especializada en tierra firme de Nueva Zelanda, unieron fuerzas para lanzar hoy el Fondo de Sostenibilidad Agrícola
Alcance del mercado mundial de leche A2
El mercado mundial de leche A2 está segmentado en función de la forma, la naturaleza, el contenido de grasa, el tamaño del envase, la forma del envase y el canal de distribución. El crecimiento entre estos segmentos le ayudará a analizar los principales segmentos de crecimiento en las industrias y brindará a los usuarios una valiosa descripción general del mercado y conocimientos del mercado para ayudarlos a tomar decisiones estratégicas para identificar las principales aplicaciones del mercado.
Forma
- Polvo
- Líquido
Según la forma, el mercado mundial de leche A2 está segmentado en polvo y líquido.
Naturaleza
- Orgánico
- Convencional
Sobre la base de la naturaleza, el mercado mundial de leche A2 está segmentado en orgánica y convencional.
Contenido de grasa
- Sin grasa
- Bajo en grasas
- Grasa reducida
- Grasa entera
Sobre la base del contenido de grasa, el mercado mundial de leche A2 se segmenta en sin grasa, baja en grasa, grasa reducida y grasa entera.
Tamaño del embalaje
- 101-250 ml/g
- 250-500 ml/g
- 501-1000 ml/g
- Más de 1000 ml/g
Sobre la base del tamaño del envase, el mercado mundial de leche A2 está segmentado en 101-250 ml/g, 250-500 ml/g, 501-1000 ml/g y más de 1000 ml/g.
Forma de embalaje
- Botellas
- Cajas de cartón
- Poder
- Paso
- Otros
Sobre la base de la forma del embalaje, el mercado mundial de leche A2 se segmenta en botellas, cartones, latas, frascos y otros.
Canal de distribución
- Minoristas basados en tiendas
- Minoristas sin tiendas
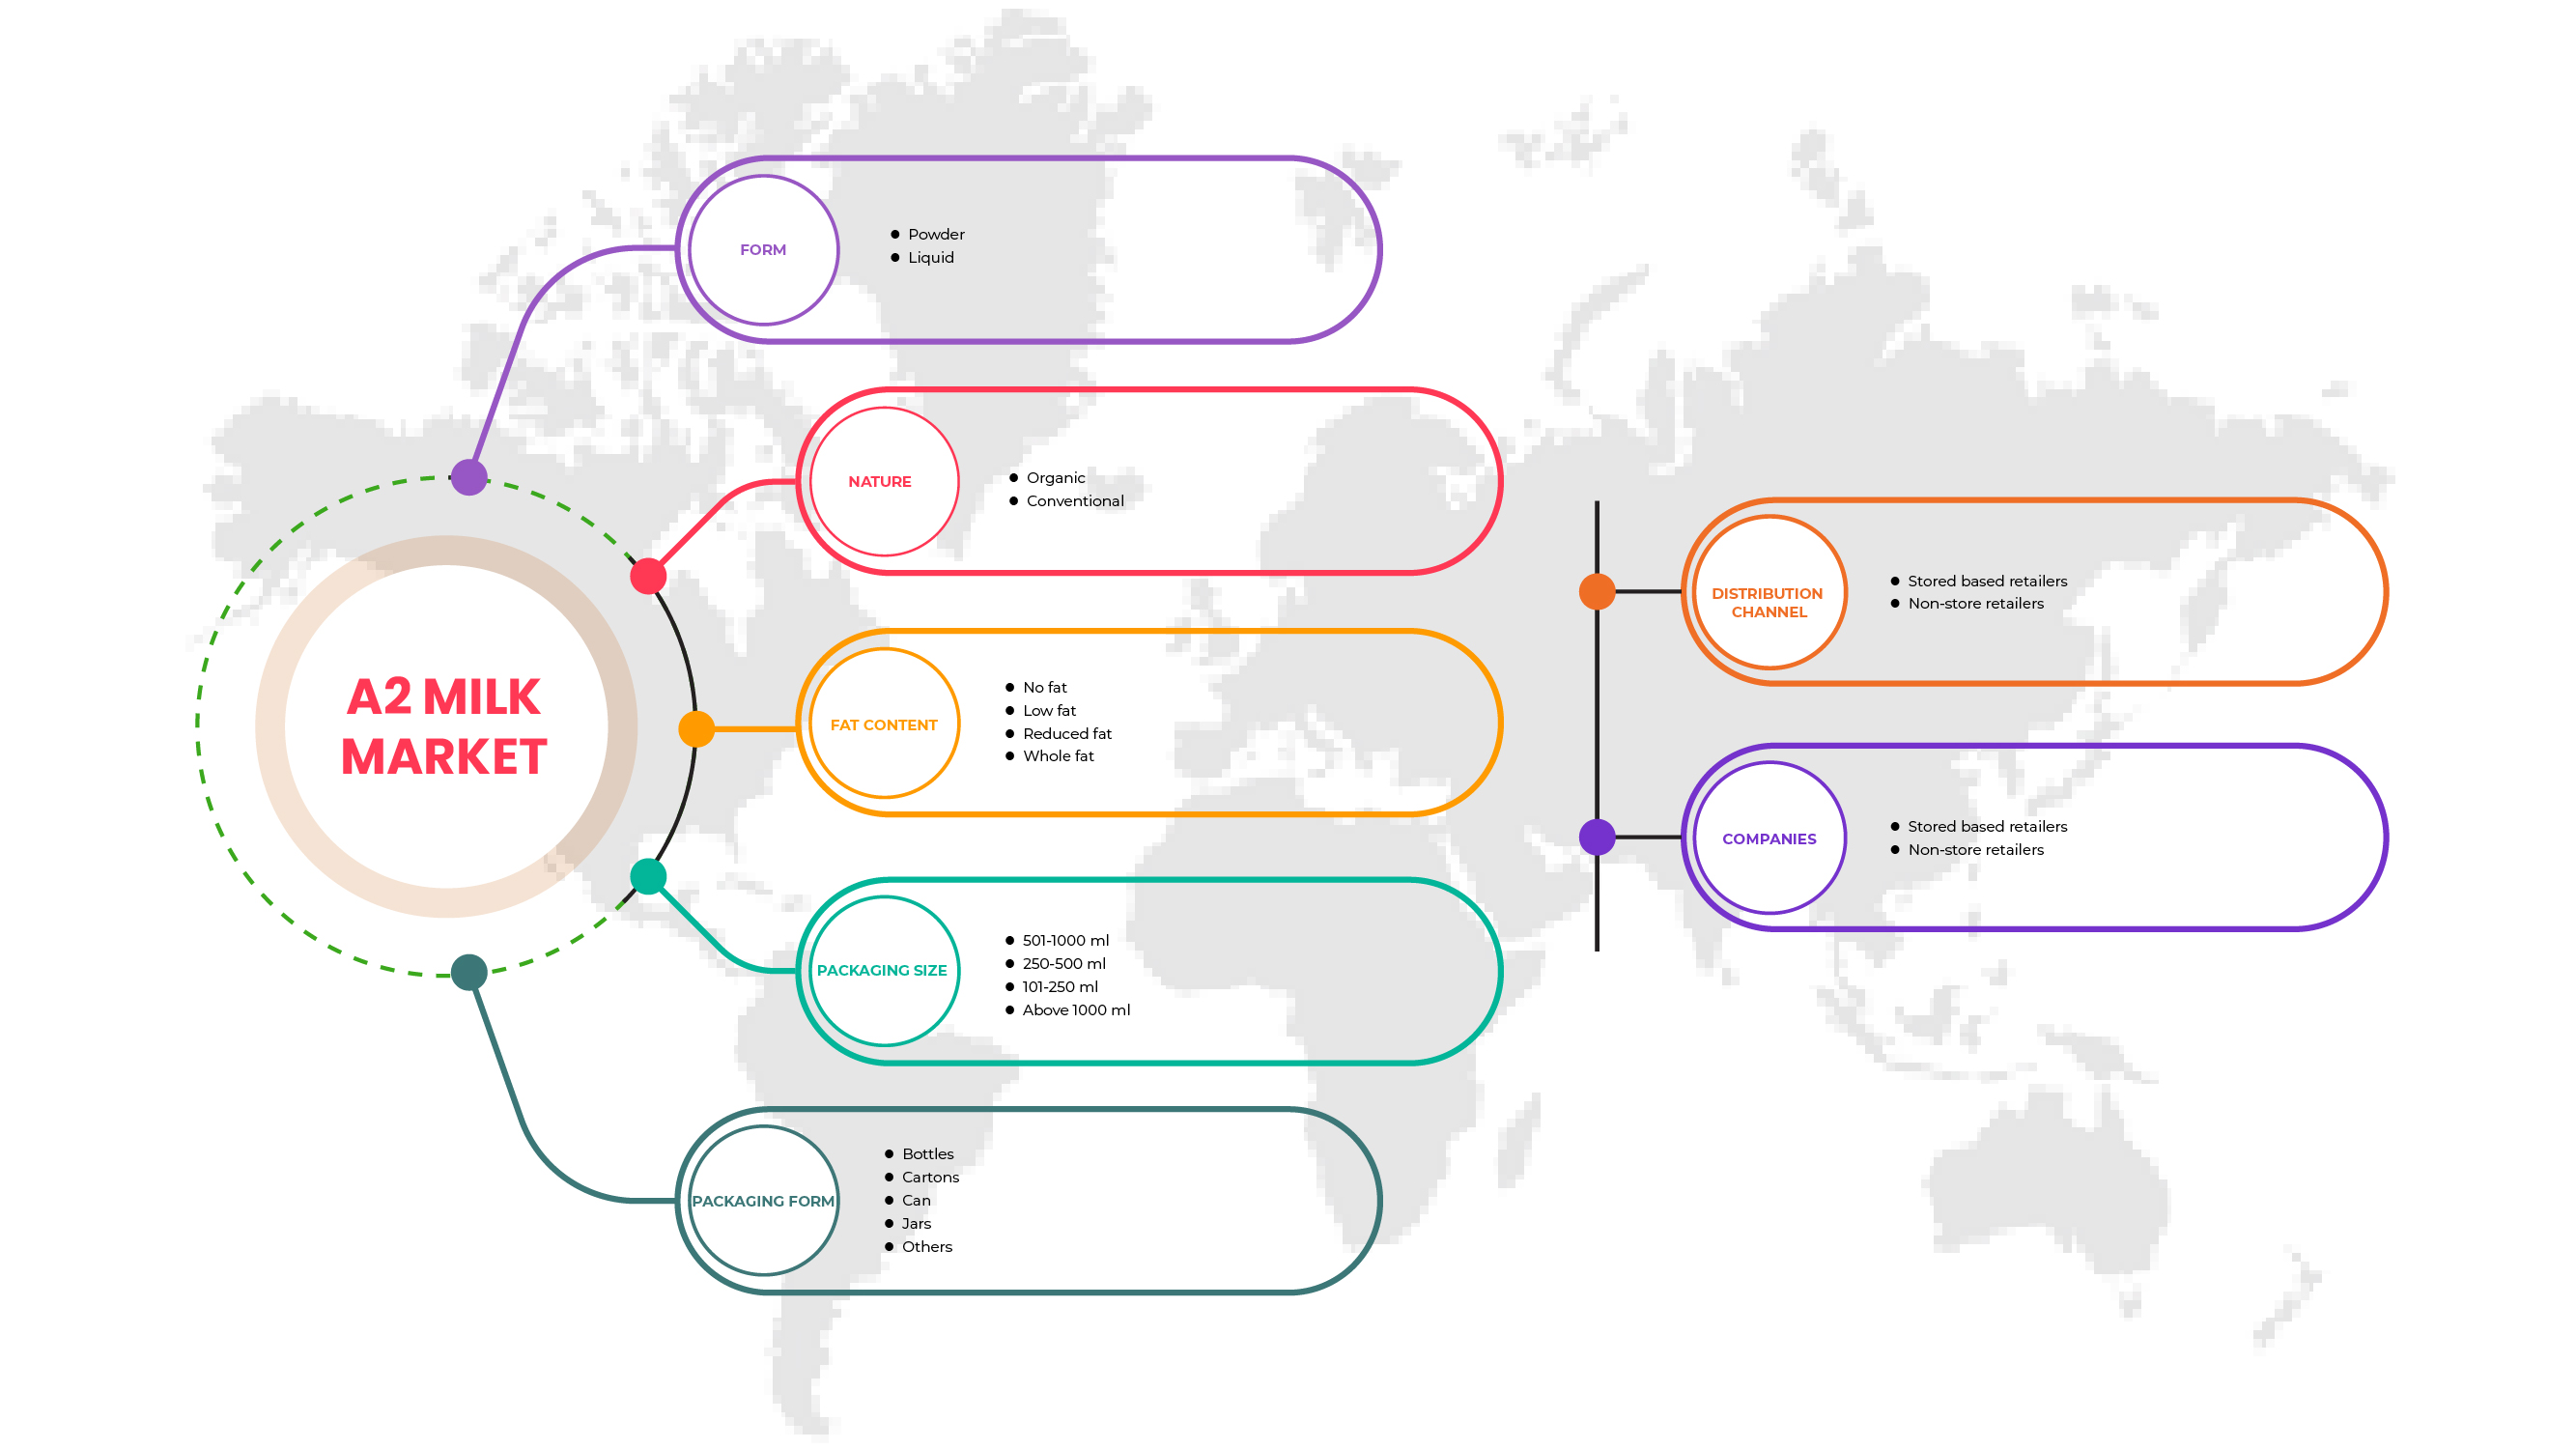
Sobre la base del canal de distribución, el mercado mundial de leche A2 está segmentado en minoristas con sede en tiendas y minoristas sin tiendas.
Análisis y perspectivas regionales del mercado de leche A2
Se analiza el mercado de la leche A2 y se proporcionan información y tendencias del tamaño del mercado por país, forma, naturaleza, contenido de grasa, tamaño del envase, forma del envase y canal de distribución, como se menciona anteriormente.
Los países cubiertos en el informe global del mercado de leche A2 son EE. UU., Canadá y México, Alemania, Reino Unido, Italia, Francia, España, Suiza, Países Bajos, Bélgica, Rusia, Turquía, resto de Europa, China, Nueva Zelanda, Australia, India, Malasia, Singapur, Corea del Sur, Indonesia, Japón, Filipinas, Tailandia y resto de Asia Pacífico, Sudáfrica, Emiratos Árabes Unidos, Arabia Saudita, Kuwait y resto de Medio Oriente y África, Brasil, Argentina y resto de Sudamérica.
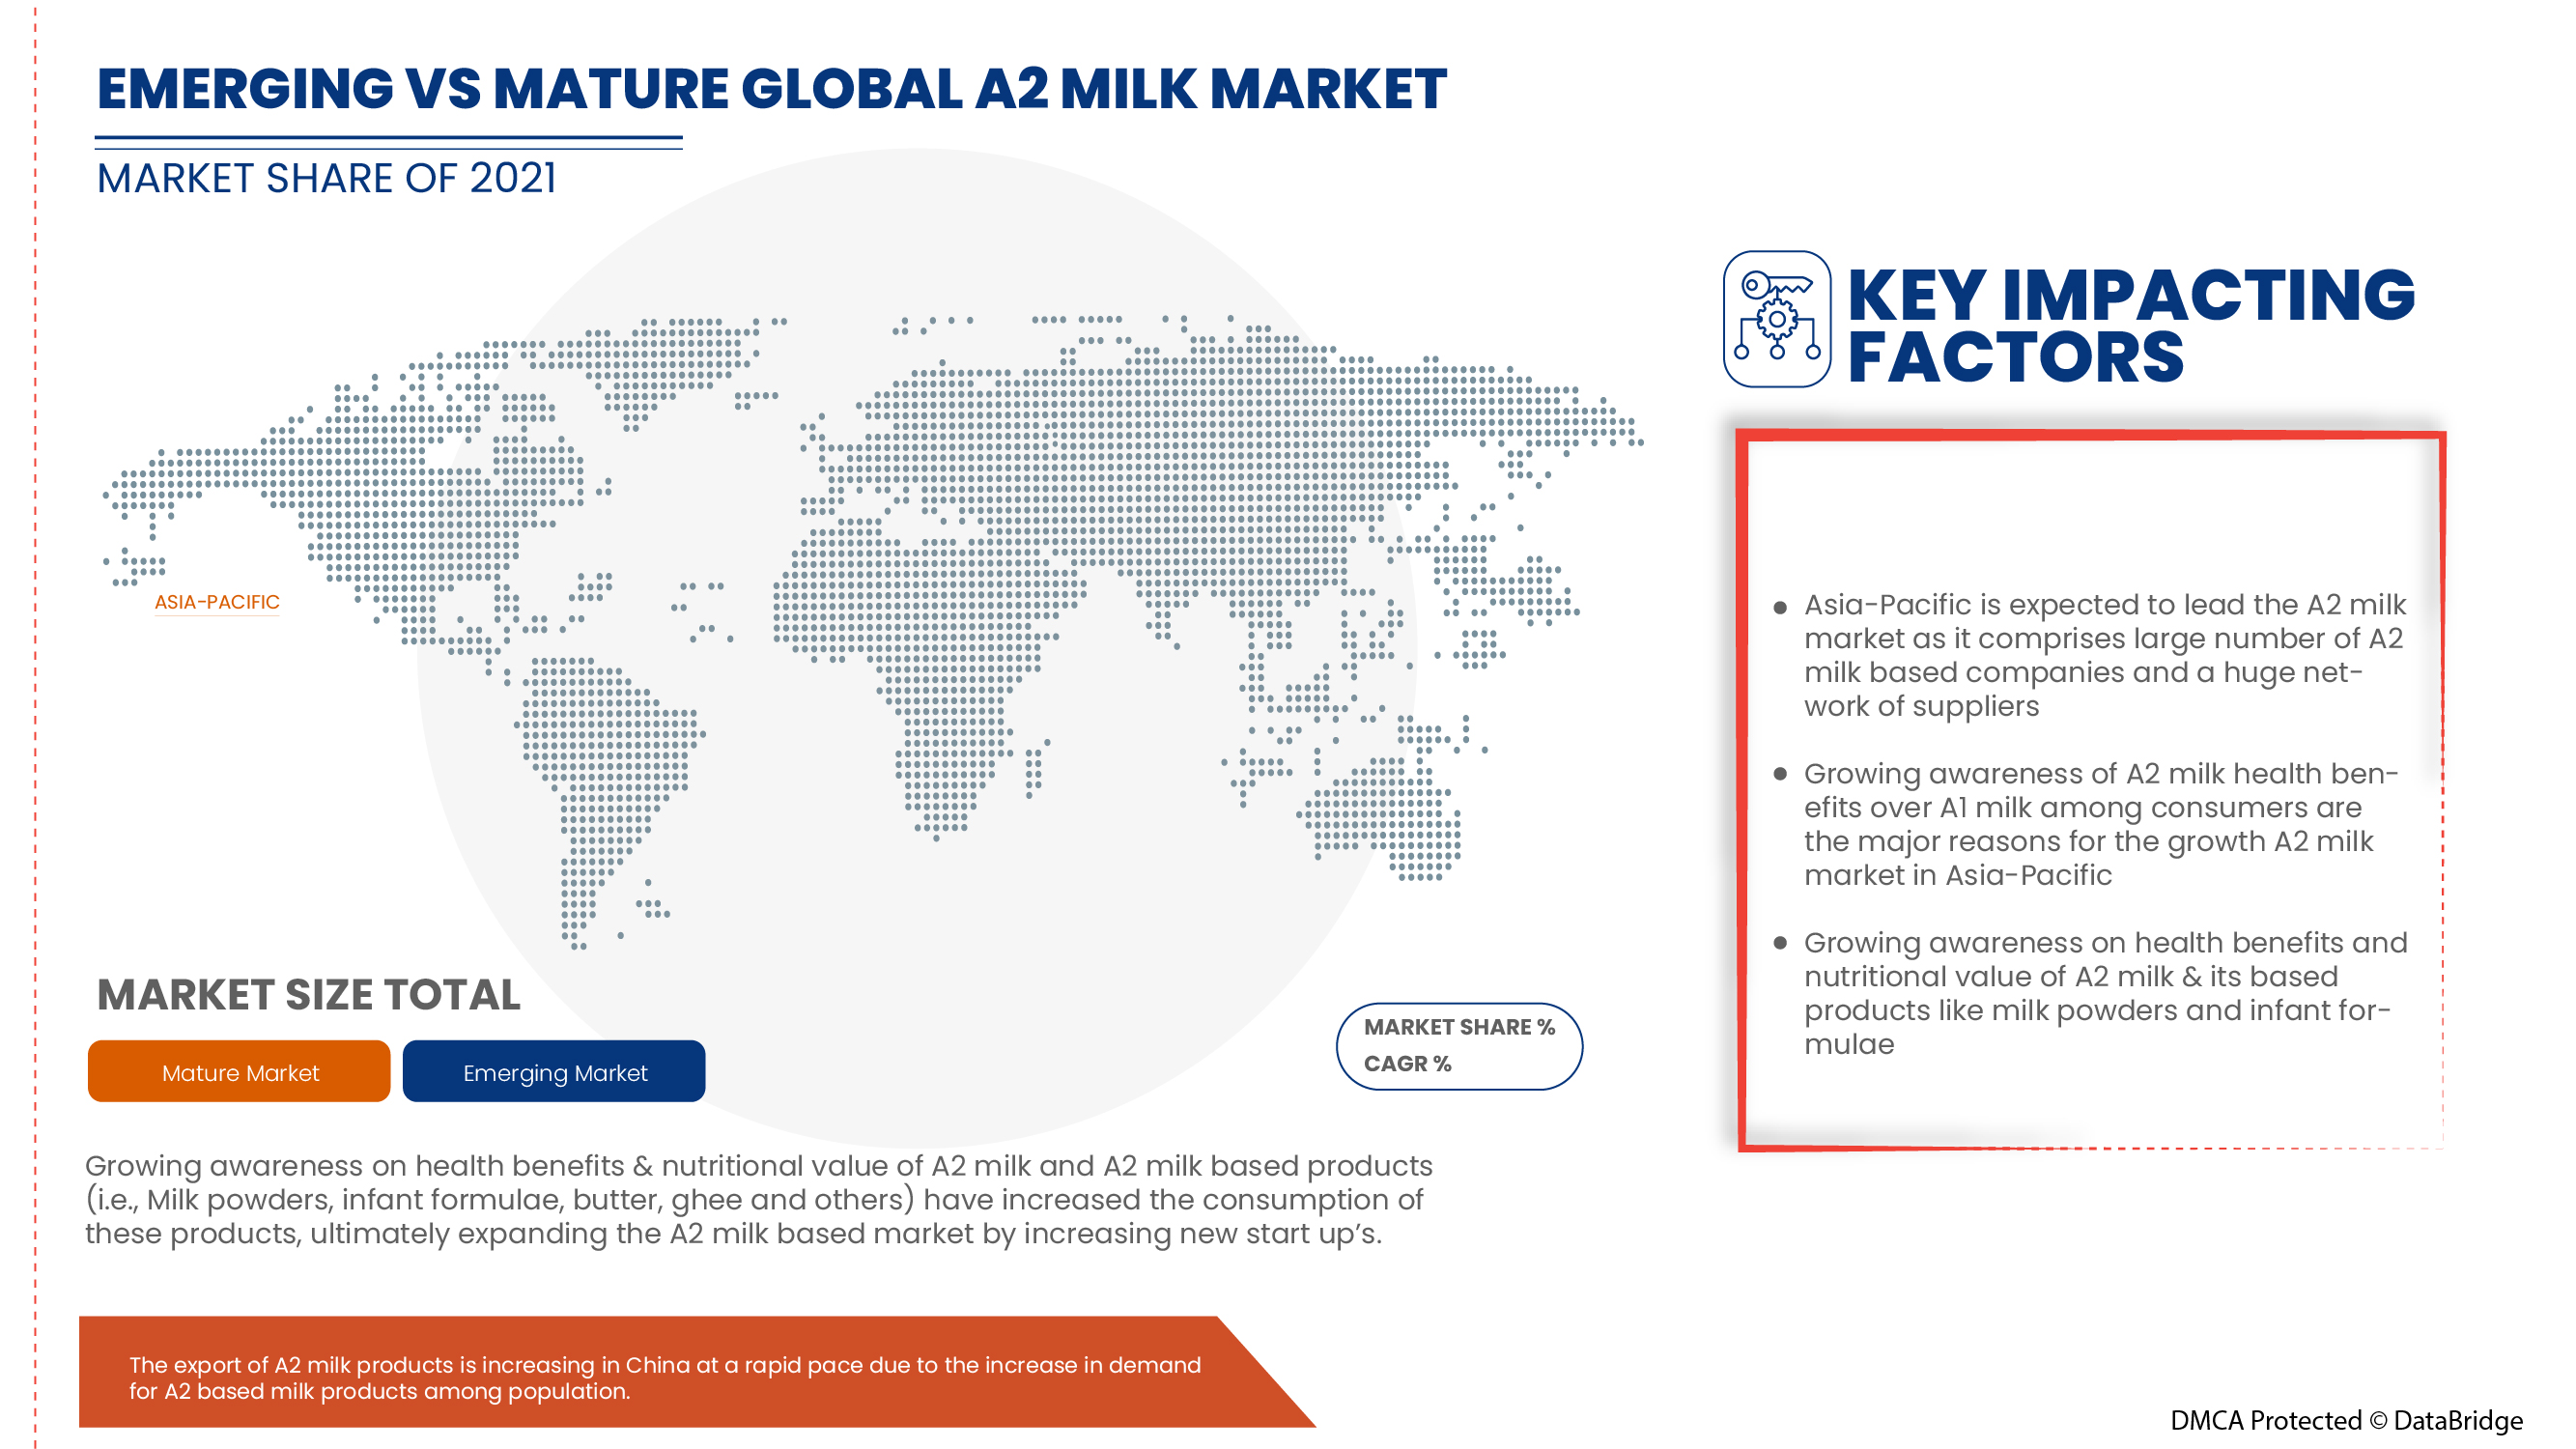
La región de Asia y el Pacífico es el mayor mercado de leche A2. La creciente conciencia de los beneficios para la salud de la leche A2 en comparación con la leche A1 entre los consumidores es la principal razón del crecimiento del mercado de leche A2 en la región de Asia y el Pacífico. Además, el mercado de alimentos de origen vegetal está creciendo progresivamente en la región de Asia y el Pacífico. El crecimiento de este mercado afectará directamente el desarrollo del mercado de leche A2. Sin embargo, es probable que los altos precios de la leche A2 restrinjan el crecimiento del mercado.
La sección de países del informe también proporciona factores de impacto de mercado individuales y cambios en la regulación del mercado que afectan las tendencias actuales y futuras del mercado. Los puntos de datos como el análisis de la cadena de valor ascendente y descendente, las tendencias técnicas, el análisis de las cinco fuerzas de Porter y los estudios de casos son algunos de los indicadores utilizados para pronosticar el escenario del mercado para países individuales. Además, la presencia y disponibilidad de marcas globales y sus desafíos enfrentados debido a la competencia grande o escasa de las marcas locales y nacionales, el impacto de los aranceles nacionales y las rutas comerciales se consideran al proporcionar un análisis de pronóstico de los datos del país.
Análisis del panorama competitivo y de la cuota de mercado de la leche A2
El panorama competitivo del mercado de la leche A2 proporciona detalles sobre el competidor. Los componentes incluidos son una descripción general de la empresa, las finanzas de la empresa, los ingresos generados, el potencial de mercado, la inversión en investigación y desarrollo, las nuevas iniciativas de mercado, la presencia global, los sitios e instalaciones de producción, las capacidades de producción, las fortalezas y debilidades de la empresa, el lanzamiento del producto, la amplitud y la variedad del producto, y el dominio de la aplicación. Los puntos de datos anteriores solo están relacionados con las empresas que se centran en el mercado de la leche A2.
Algunos de los principales actores que operan en el mercado de la leche A2 son GCMMF, Erden Creamery Pvt Ltd, PROVILAC, Ripley Farms LLC., Taw River Dairy, The a2 Milk Company Limited, Urban Farms Milk., Vedaaz Organics Pvt. Ltd., AVTARAN MILK, DOFE, Captain's Farm., Ksheerdham., Ayuda Organics, Veco Zuivel BV y Australia's Own., entre otros.
SKU-
Obtenga acceso en línea al informe sobre la primera nube de inteligencia de mercado del mundo

- Panel de análisis de datos interactivo
- Panel de análisis de empresas para oportunidades con alto potencial de crecimiento
- Acceso de analista de investigación para personalización y consultas
- Análisis de la competencia con panel interactivo
- Últimas noticias, actualizaciones y análisis de tendencias
- Aproveche el poder del análisis de referencia para un seguimiento integral de la competencia
Tabla de contenido
1 INTRODUCTION
1.1 OBJECTIVES OF THE STUDY
1.2 MARKET DEFINITION
1.3 OVERVIEW OF GLOBAL A2 MILK MARKET
1.4 LIMITATIONS
1.5 MARKETS COVERED
2 MARKET SEGMENTATION
2.1 MARKETS COVERED
2.2 GEOGRAPHICAL SCOPE
2.3 YEARS CONSIDERED FOR THE STUDY
2.4 CURRENCY AND PRICING
2.5 DBMR TRIPOD DATA VALIDATION MODEL
2.6 MULTIVARIATE MODELLING
2.7 TREATMENT LIFELINE CURVE
2.8 PRIMARY INTERVIEWS WITH KEY OPINION LEADERS
2.9 DBMR MARKET POSITION GRID
2.1 VENDOR SHARE ANALYSIS
2.11 SECONDARY SOURCES
2.12 ASSUMPTIONS
3 EXECUTIVE SUMMARY
4 PREMIUM INSIGHTS
4.1 FACTORS INFLUENCING PURCHASE DECISION
4.1.1 PRODUCT NUTRITIONAL QUALITY
4.1.2 PRODUCT PRICING
4.1.3 AUTHENTICITY OF PRODUCT
4.2 GROWTH STRATEGIES ADOPTED BY KEY MARKET PLAYERS
4.3 TRADE ANALYSIS
4.3.1 IMPORTS-EXPORTS OF THE GLOBAL A2 MILK MARKET
4.4 INDUSTRY TRENDS AND FUTURE PERSPECTIVE OF GLOBAL A2 MILK MARKET
4.4.1 INDUSTRY TRENDS
4.4.2 FUTURE PERSPECTIVE
4.5 RAW MATERIAL SOURCING ANALYSIS: GLOBAL A2 MILK MARKET
4.6 SUPPLY CHAIN OF THE GLOBAL A2 MILK MARKET
4.6.1 RAW A2 MILK PRODUCTION
4.6.2 PROCESSING AND PACKAGING
4.6.3 TRANSPORTATION AND DISTRIBUTION
4.6.4 END USERS
4.7 TECHNOLOGICAL ADVANCEMENTS
4.8 VALUE CHAIN ANALYSIS: GLOBAL A2 MILK MARKET
4.9 PORTER'S FIVE
4.9.1 PORTER'S FIVE FORCES ANALYSIS FOR GLOBAL A2 MILK MARKET
4.9.2 BARGAINING POWER OF SUPPLIERS
4.9.3 BARGAINING POWER OF BUYERS/CONSUMERS
4.9.4 THREAT OF NEW ENTRANTS
4.9.5 THREAT OF SUBSTITUTE PRODUCTS
4.9.6 INTENSITY OF COMPETITIVE RIVALRY
5 REGULATORY FRAMEWORK AND LABELLING FOR THE GLOBAL A2 MILK MARKET
6 IMPACT OF ECONOMIC SLOWDOWN ON THE MARKET –GLOBAL A2 MILK MARKET
6.1 IMPACT ON PRICE
6.2 IMPACT ON SUPPLY CHAIN
6.3 IMPACT ON SHIPMENT
6.4 IMPACT ON COMPANY'S STRATEGIC DECISIONS
7 PRICING INDEX
7.1 FOB & B2B PRICES - GLOBAL A2 MILK MARKET
7.2 B2B PRICES - GLOBAL A2 MILK MARKET
8 PRODUCTION CAPACITY OF KEY MANUFACTURERS
9 BRAND OUTLOOK
9.1 PRODUCT VS BRAND OVERVIEW
10 MARKET OVERVIEW
10.1 DRIVERS
10.1.1 GROWING AWARENESS ABOUT HEALTH AMONG CONSUMERS
10.1.2 INCREASING APPLICATIONS OF A2 MILK IN INFANT FORMULAE
10.1.3 HIGH NUTRITIONAL VALUES IN A2 COMPARED TO REGULAR MILK
10.1.4 CONSUMERS EXPERIENCING HEALTH ISSUES DUE TO CONSUMPTION OF REGULAR MILK
10.2 RESTRAINT
10.2.1 HIGH PRICES OF A2 MILK
10.3 OPPORTUNITY
10.3.1 INCLINATION OF CONSUMERS OVER SUSTAINABLE PRODUCTION OF A2 MILK
10.4 CHALLENGES
10.4.1 GROWING TREND OF VEGANISM AMONG PEOPLE
10.4.2 HIGH INVESTMENT IN R&D FOR A2 MILK PRODUCTS
11 GLOBAL A2 MILK MARKET, BY FORM
11.1 OVERVIEW
11.2 LIQUID
11.3 POWDER
12 GLOBAL A2 MILK MARKET, BY NATURE
12.1 OVERVIEW
12.2 CONVENTIONAL
12.3 ORGANIC
13 GLOBAL A2 MILK MARKET, BY FAT CONTENT
13.1 OVERVIEW
13.2 WHOLE FAT
13.3 LOW FAT
13.4 REDUCED FAT
13.5 NO FAT
14 GLOBAL A2 MILK MARKET, BY PACKAGIING SIZE
14.1 OVERVIEW
14.2 501-1000 ML
14.3 250-500 ML
14.4 101-250 ML
14.5 ABOVE 1000 ML
15 GLOBAL A2 MILK MARKET, BY PACKAGING FORM
15.1 OVERVIEW
15.2 BOTTLES
15.2.1 PLASTIC
15.2.2 GLASS
15.3 CARTONS
15.4 CAN
15.5 JARS
15.6 OTHERS
16 GLOBAL A2 MILK MARKET, BY DISTRIBUTION CHANNEL
16.1 OVERVIEW
16.2 NON-STORE RETAILERS
16.2.1 ONLINE
16.2.2 VENDING MACHINE
16.3 STORE BASED RETAILERS
16.3.1 SUPERMARKETS/HYPERMARKETS
16.3.2 CONVENIENCE STORES
16.3.3 GROCERY STORES
16.3.4 SPECIALTY STORES
17 GLOBAL A2 MILK MARKET, BY REGION
17.1 OVERVIEW
17.2 ASIA-PACIFIC
17.2.1 CHINA
17.2.2 NEW ZEALAND
17.2.3 AUSTRALIA
17.2.4 INDIA
17.2.5 MALAYSIA
17.2.6 SINGAPORE
17.2.7 SOUTH KOREA
17.2.8 INDONESIA
17.2.9 JAPAN
17.2.10 PHILIPPINES
17.2.11 THAILAND
17.2.12 REST OF ASIA-PACIFIC
17.3 EUROPE
17.3.1 GERMANY
17.3.2 NETHERLANDS
17.3.3 SWITZERLAND
17.3.4 RUSSIA
17.3.5 U.K.
17.3.6 FRANCE
17.3.7 SPAIN
17.3.8 REST OF EUROPE
17.4 NORTH AMERICA
17.4.1 U.S.
17.4.2 CANADA
17.5 SOUTH AMERICA
17.5.1 BRAZIL
17.5.2 ARGENTINA
17.5.3 REST OF SOUTH AMERICA
17.6 MIDDLE EAST AND AFRICA
17.6.1 SOUTH AFRICA
17.6.2 UAE
17.6.3 REST OF MIDDLE EAST AND AFRICA
18 COMPANY LANDSCAPE: GLOBAL A2 MILK MARKET
18.1 COMPANY SHARE ANALYSIS: GLOBAL
18.2 COMPANY SHARE ANALYSIS: NORTH AMERICA
18.3 COMPANY SHARE ANALYSIS: EUROPE
18.4 COMPANY SHARE ANALYSIS: ASIA-PACIFIC
19 SWOT ANALYSIS
20 COMPANY PROFILE
20.1 THE A2 MILK COMPANY LIMITED
20.1.1 COMPANY SNAPSHOT
20.1.2 REVENUE ANALYSIS
20.1.3 COMPANY SHARE ANALYSIS
20.1.4 PRODUCT PORTFOLIO
20.1.5 RECENT DEVELOPMENTS
20.2 GCMMF
20.2.1 COMPANY SNAPSHOT
20.2.2 COMPANY SHARE ANALYSIS
20.2.3 PRODUCT PORTFOLIO
20.2.4 RECENT DEVELOPMENT
20.3 CAPTAIN’S FARM
20.3.1 COMPANY SNAPSHOT
20.3.2 COMPANY SHARE ANALYSIS
20.3.3 PRODUCT PORTFOLIO
20.3.4 RECENT DEVELOPMENT
20.4 VEDAAZ ORGANICS PVT. LTD.
20.4.1 COMPANY SNAPSHOT
20.4.2 COMPANY SHARE ANALYSIS
20.4.3 PRODUCT PORTFOLIO
20.4.4 RECENT DEVELOPMENT
20.5 URBAN FARMS MILK
20.5.1 COMPANY SNAPSHOT
20.5.2 COMPANY SHARE ANALYSIS
20.5.3 PRODUCT PORTFOLIO
20.5.4 RECENT DEVELOPMENT
20.6 AUSTRALIA'S OWN
20.6.1 COMPANY SNAPSHOT
20.6.2 PRODUCT PORTFOLIO
20.6.3 RECENT DEVELOPMENT
20.7 AVTARAN MILK
20.7.1 COMPANY SNAPSHOT
20.7.2 PRODUCT PORTFOLIO
20.7.3 RECENT DEVELOPMENT
20.8 AYUDA ORGANICS
20.8.1 COMPANY SNAPSHOT
20.8.2 PRODUCT PORTFOLIO
20.8.3 RECENT DEVELOPMENT
20.9 DOFE
20.9.1 COMPANY SNAPSHOT
20.9.2 PRODUCT PORTFOLIO
20.9.3 RECENT DEVELOPMENT
20.1 ERDEN CREAMERY PRIVATE LIMITED
20.10.1 COMPANY SNAPSHOT
20.10.2 PRODUCT PORTFOLIO
20.10.3 RECENT DEVELOPMENT
20.11 KSHEERDHAM
20.11.1 COMPANY SNAPSHOT
20.11.2 PRODUCT PORTFOLIO
20.11.3 RECENT DEVELOPMENT
20.12 PROVILAC DAIRY FARMS PVT. LTD
20.12.1 COMPANY SNAPSHOT
20.12.2 PRODUCT PORTFOLIO
20.12.3 RECENT DEVELOPMENT
20.13 RIPLEY FARMS LLC
20.13.1 COMPANY SNAPSHOT
20.13.2 PRODUCT PORTFOLIO
20.13.3 RECENT DEVELOPMENT
20.14 TAW RIVER DAIRY
20.14.1 COMPANY SNAPSHOT
20.14.2 PRODUCT PORTFOLIO
20.14.3 RECENT DEVELOPMENT
20.15 VECO ZUIVEL B.V.
20.15.1 COMPANY SNAPSHOT
20.15.2 PRODUCT PORTFOLIO
20.15.3 RECENT DEVELOPMENT
21 QUESTIONNAIRE
22 RELATED REPORTS
Lista de Tablas
TABLE 1 FREE ON BOARD (FOB) OF A2 MILK
TABLE 2 BRAND COMPARATIVE ANALYSIS OF THE GLOBAL A2 MILK MARKET
TABLE 3 GLOBAL A2 MILK MARKET, BY FORM, 2020-2029 (USD MILLION)
TABLE 4 GLOBAL LIQUID IN A2 MILK MARKET, BY REGION, 2020-2029 (USD MILLION)
TABLE 5 GLOBAL POWDER IN A2 MILK MARKET, BY REGION, 2020-2029 (USD MILLION)
TABLE 6 GLOBAL A2 MILK MARKET, BY NATURE, 2020-2029 (USD MILLION)
TABLE 7 GLOBAL CONVENTIONAL IN A2 MILK MARKET, BY REGION, 2020-2029 (USD MILLION)
TABLE 8 GLOBAL ORGANIC IN A2 MILK MARKET, BY REGION, 2020-2029 (USD MILLION)
TABLE 9 GLOBAL A2 MILK MARKET, BY FAT CONTENT, 2020-2029 (USD MILLION)
TABLE 10 GLOBAL WHOLE FAT IN A2 MILK MARKET, BY REGION, 2020-2029 (USD MILLION)
TABLE 11 GLOBAL LOW FAT IN A2 MILK MARKET, BY REGION, 2020-2029 (USD MILLION)
TABLE 12 GLOBAL REDUCED FAT IN A2 MILK MARKET, BY REGION, 2020-2029 (USD MILLION)
TABLE 13 GLOBAL NO FAT IN A2 MILK MARKET, BY REGION, 2020-2029 (USD MILLION)
TABLE 14 GLOBAL A2 MILK MARKET, BY PACKAGING SIZE, 2020-2029 (USD MILLION)
TABLE 15 GLOBAL 501-1000 ML IN A2 MILK MARKET, BY REGION, 2020-2029 (USD MILLION)
TABLE 16 GLOBAL 250-500 ML IN A2 MILK MARKET, BY REGION, 2020-2029 (USD MILLION)
TABLE 17 GLOBAL 101-250 ML IN A2 MILK MARKET, BY REGION, 2020-2029 (USD MILLION)
TABLE 18 GLOBAL ABOVE 1000 ML IN A2 MILK MARKET, BY REGION, 2020-2029 (USD MILLION)
TABLE 19 GLOBAL A2 MILK MARKET, BY PACKAGING FORM, 2020-2029 (USD MILLION)
TABLE 20 GLOBAL BOTTLES IN A2 MILK MARKET, BY REGION, 2020-2029 (USD MILLION)
TABLE 21 GLOBAL BOTTLES IN A2 MILK MARKET, BY TYPE, 2020-2029 (USD MILLION)
TABLE 22 GLOBAL CARTONS IN A2 MILK MARKET, BY REGION, 2020-2029 (USD MILLION)
TABLE 23 GLOBAL CAN IN A2 MILK MARKET, BY REGION, 2020-2029 (USD MILLION)
TABLE 24 GLOBAL JARS IN A2 MILK MARKET, BY REGION, 2020-2029 (USD MILLION)
TABLE 25 GLOBAL OTHERS IN A2 MILK MARKET, BY REGION, 2020-2029 (USD MILLION)
TABLE 26 GLOBAL A2 MILK MARKET, BY DISTRIBUTION CHANNEL, 2020-2029 (USD MILLION)
TABLE 27 GLOBAL NON-STORE RETAILERS IN A2 MILK MARKET, BY REGION, 2020-2029 (USD MILLION)
TABLE 28 GLOBAL NON-STORE RETAILERS IN A2 MILK MARKET, BY TYPE, 2020-2029 (USD MILLION)
TABLE 29 GLOBAL STORE BASED RETAILERS IN A2 MILK MARKET, BY REGION, 2020-2029 (USD MILLION)
TABLE 30 GLOBAL STORE BASED RETAILERS IN A2 MILK MARKET, BY TYPE, 2020-2029 (USD MILLION)
TABLE 31 GLOBAL A2 MILK MARKET, BY REGION, 2020-2029 (USD MILLION)
TABLE 32 ASIA-PACIFIC A2 MILK MARKET, BY COUNTRY, 2020-2029 (USD MILLION)
TABLE 33 ASIA-PACIFIC A2 MILK MARKET, BY FORM, 2020-2029 (USD MILLION)
TABLE 34 ASIA-PACIFIC A2 MILK MARKET, BY NATURE, 2020-2029 (USD MILLION)
TABLE 35 ASIA-PACIFIC A2 MILK MARKET, BY FAT CONTENT, 2020-2029 (USD MILLION)
TABLE 36 ASIA-PACIFIC A2 MILK MARKET, BY PACKAGING SIZE, 2020-2029 (USD MILLION)
TABLE 37 ASIA-PACIFIC A2 MILK MARKET, BY PACKAGING FORM, 2020-2029 (USD MILLION)
TABLE 38 ASIA-PACIFIC BOTTLES IN A2 MILK MARKET, BY TYPE, 2020-2029 (USD MILLION)
TABLE 39 ASIA-PACIFIC A2 MILK MARKET, BY DISTRIBUTION CHANNEL, 2020-2029 (USD MILLION)
TABLE 40 ASIA-PACIFIC STORE BASED RETAILERS IN A2 MILK MARKET, BY TYPE, 2020-2029 (USD MILLION)
TABLE 41 ASIA-PACIFIC NON-STORE RETAILERS IN A2 MILK MARKET, BY TYPE, 2020-2029 (USD MILLION)
TABLE 42 CHINA A2 MILK MARKET, BY FORM, 2020-2029 (USD MILLION)
TABLE 43 CHINA A2 MILK MARKET, BY NATURE, 2020-2029 (USD MILLION)
TABLE 44 CHINA A2 MILK MARKET, BY FAT CONTENT, 2020-2029 (USD MILLION)
TABLE 45 CHINA A2 MILK MARKET, BY PACKAGING SIZE, 2020-2029 (USD MILLION)
TABLE 46 CHINA A2 MILK MARKET, BY PACKAGING FORM, 2020-2029 (USD MILLION)
TABLE 47 CHINA BOTTLES IN A2 MILK MARKET, BY TYPE, 2020-2029 (USD MILLION)
TABLE 48 CHINA A2 MILK MARKET, BY DISTRIBUTION CHANNEL, 2020-2029 (USD MILLION)
TABLE 49 CHINA STORE BASED RETAILERS IN A2 MILK MARKET, BY TYPE, 2020-2029 (USD MILLION)
TABLE 50 CHINA NON-STORE RETAILERS IN A2 MILK MARKET, BY TYPE, 2020-2029 (USD MILLION)
TABLE 51 NEW ZEALAND A2 MILK MARKET, BY FORM, 2020-2029 (USD MILLION)
TABLE 52 NEW ZEALAND A2 MILK MARKET, BY NATURE, 2020-2029 (USD MILLION)
TABLE 53 NEW ZEALAND A2 MILK MARKET, BY FAT CONTENT, 2020-2029 (USD MILLION)
TABLE 54 NEW ZEALAND A2 MILK MARKET, BY PACKAGING SIZE, 2020-2029 (USD MILLION)
TABLE 55 NEW ZEALAND A2 MILK MARKET, BY PACKAGING FORM, 2020-2029 (USD MILLION)
TABLE 56 NEW ZEALAND BOTTLES IN A2 MILK MARKET, BY TYPE, 2020-2029 (USD MILLION)
TABLE 57 NEW ZEALAND A2 MILK MARKET, BY DISTRIBUTION CHANNEL, 2020-2029 (USD MILLION)
TABLE 58 NEW ZEALAND STORE BASED RETAILERS IN A2 MILK MARKET, BY TYPE, 2020-2029 (USD MILLION)
TABLE 59 NEW ZEALAND NON-STORE RETAILERS IN A2 MILK MARKET, BY TYPE, 2020-2029 (USD MILLION)
TABLE 60 AUSTRALIA A2 MILK MARKET, BY FORM, 2020-2029 (USD MILLION)
TABLE 61 AUSTRALIA A2 MILK MARKET, BY NATURE, 2020-2029 (USD MILLION)
TABLE 62 AUSTRALIA A2 MILK MARKET, BY FAT CONTENT, 2020-2029 (USD MILLION)
TABLE 63 AUSTRALIA A2 MILK MARKET, BY PACKAGING SIZE, 2020-2029 (USD MILLION)
TABLE 64 AUSTRALIA A2 MILK MARKET, BY PACKAGING FORM, 2020-2029 (USD MILLION)
TABLE 65 AUSTRALIA BOTTLES IN A2 MILK MARKET, BY TYPE, 2020-2029 (USD MILLION)
TABLE 66 AUSTRALIA A2 MILK MARKET, BY DISTRIBUTION CHANNEL, 2020-2029 (USD MILLION)
TABLE 67 AUSTRALIA STORE BASED RETAILERS IN A2 MILK MARKET, BY TYPE, 2020-2029 (USD MILLION)
TABLE 68 AUSTRALIA NON-STORE RETAILERS IN A2 MILK MARKET, BY TYPE, 2020-2029 (USD MILLION)
TABLE 69 INDIA A2 MILK MARKET, BY FORM, 2020-2029 (USD MILLION)
TABLE 70 INDIA A2 MILK MARKET, BY NATURE, 2020-2029 (USD MILLION)
TABLE 71 INDIA A2 MILK MARKET, BY FAT CONTENT, 2020-2029 (USD MILLION)
TABLE 72 INDIA A2 MILK MARKET, BY PACKAGING SIZE, 2020-2029 (USD MILLION)
TABLE 73 INDIA A2 MILK MARKET, BY PACKAGING FORM, 2020-2029 (USD MILLION)
TABLE 74 INDIA BOTTLES IN A2 MILK MARKET, BY TYPE, 2020-2029 (USD MILLION)
TABLE 75 INDIA A2 MILK MARKET, BY DISTRIBUTION CHANNEL, 2020-2029 (USD MILLION)
TABLE 76 INDIA STORE BASED RETAILERS IN A2 MILK MARKET, BY TYPE, 2020-2029 (USD MILLION)
TABLE 77 INDIA NON-STORE RETAILERS IN A2 MILK MARKET, BY TYPE, 2020-2029 (USD MILLION)
TABLE 78 MALAYSIA A2 MILK MARKET, BY FORM, 2020-2029 (USD MILLION)
TABLE 79 MALAYSIA A2 MILK MARKET, BY NATURE, 2020-2029 (USD MILLION)
TABLE 80 MALAYSIA A2 MILK MARKET, BY FAT CONTENT, 2020-2029 (USD MILLION)
TABLE 81 MALAYSIA A2 MILK MARKET, BY PACKAGING SIZE, 2020-2029 (USD MILLION)
TABLE 82 MALAYSIA A2 MILK MARKET, BY PACKAGING FORM, 2020-2029 (USD MILLION)
TABLE 83 MALAYSIA BOTTLES IN A2 MILK MARKET, BY TYPE, 2020-2029 (USD MILLION)
TABLE 84 MALAYSIA A2 MILK MARKET, BY DISTRIBUTION CHANNEL, 2020-2029 (USD MILLION)
TABLE 85 MALAYSIA STORE BASED RETAILERS IN A2 MILK MARKET, BY TYPE, 2020-2029 (USD MILLION)
TABLE 86 MALAYSIA NON-STORE RETAILERS IN A2 MILK MARKET, BY TYPE, 2020-2029 (USD MILLION)
TABLE 87 SINGAPORE A2 MILK MARKET, BY FORM, 2020-2029 (USD MILLION)
TABLE 88 SINGAPORE A2 MILK MARKET, BY NATURE, 2020-2029 (USD MILLION)
TABLE 89 SINGAPORE A2 MILK MARKET, BY FAT CONTENT, 2020-2029 (USD MILLION)
TABLE 90 SINGAPORE A2 MILK MARKET, BY PACKAGING SIZE, 2020-2029 (USD MILLION)
TABLE 91 SINGAPORE A2 MILK MARKET, BY PACKAGING FORM, 2020-2029 (USD MILLION)
TABLE 92 SINGAPORE BOTTLES IN A2 MILK MARKET, BY TYPE, 2020-2029 (USD MILLION)
TABLE 93 SINGAPORE A2 MILK MARKET, BY DISTRIBUTION CHANNEL, 2020-2029 (USD MILLION)
TABLE 94 SINGAPORE STORE BASED RETAILERS IN A2 MILK MARKET, BY TYPE, 2020-2029 (USD MILLION)
TABLE 95 SINGAPORE NON-STORE RETAILERS IN A2 MILK MARKET, BY TYPE, 2020-2029 (USD MILLION)
TABLE 96 TABLE 41 SOUTH KOREA A2 MILK MARKET, BY FORM, 2020-2029 (USD MILLION)
TABLE 97 SOUTH KOREA A2 MILK MARKET, BY NATURE, 2020-2029 (USD MILLION)
TABLE 98 SOUTH KOREA A2 MILK MARKET, BY FAT CONTENT, 2020-2029 (USD MILLION)
TABLE 99 SOUTH KOREA A2 MILK MARKET, BY PACKAGING SIZE, 2020-2029 (USD MILLION)
TABLE 100 SOUTH KOREA A2 MILK MARKET, BY PACKAGING FORM, 2020-2029 (USD MILLION)
TABLE 101 SOUTH KOREA BOTTLES IN A2 MILK MARKET, BY TYPE, 2020-2029 (USD MILLION)
TABLE 102 SOUTH KOREA A2 MILK MARKET, BY DISTRIBUTION CHANNEL, 2020-2029 (USD MILLION)
TABLE 103 SOUTH KOREA STORE BASED RETAILERS IN A2 MILK MARKET, BY TYPE, 2020-2029 (USD MILLION)
TABLE 104 SOUTH KOREA NON-STORE RETAILERS IN A2 MILK MARKET, BY TYPE, 2020-2029 (USD MILLION)
TABLE 105 INDONESIA A2 MILK MARKET, BY FORM, 2020-2029 (USD MILLION)
TABLE 106 INDONESIA A2 MILK MARKET, BY NATURE, 2020-2029 (USD MILLION)
TABLE 107 INDONESIA A2 MILK MARKET, BY FAT CONTENT, 2020-2029 (USD MILLION)
TABLE 108 INDONESIA A2 MILK MARKET, BY PACKAGING SIZE, 2020-2029 (USD MILLION)
TABLE 109 INDONESIA A2 MILK MARKET, BY PACKAGING FORM, 2020-2029 (USD MILLION)
TABLE 110 INDONESIA BOTTLES IN A2 MILK MARKET, BY TYPE, 2020-2029 (USD MILLION)
TABLE 111 INDONESIA A2 MILK MARKET, BY DISTRIBUTION CHANNEL, 2020-2029 (USD MILLION)
TABLE 112 INDONESIA STORE BASED RETAILERS IN A2 MILK MARKET, BY TYPE, 2020-2029 (USD MILLION)
TABLE 113 INDONESIA NON-STORE RETAILERS IN A2 MILK MARKET, BY TYPE, 2020-2029 (USD MILLION)
TABLE 114 JAPAN A2 MILK MARKET, BY FORM, 2020-2029 (USD MILLION)
TABLE 115 JAPAN A2 MILK MARKET, BY NATURE, 2020-2029 (USD MILLION)
TABLE 116 JAPAN A2 MILK MARKET, BY FAT CONTENT, 2020-2029 (USD MILLION)
TABLE 117 JAPAN A2 MILK MARKET, BY PACKAGING SIZE, 2020-2029 (USD MILLION)
TABLE 118 JAPAN A2 MILK MARKET, BY PACKAGING FORM, 2020-2029 (USD MILLION)
TABLE 119 JAPAN BOTTLES IN A2 MILK MARKET, BY TYPE, 2020-2029 (USD MILLION)
TABLE 120 JAPAN A2 MILK MARKET, BY DISTRIBUTION CHANNEL, 2020-2029 (USD MILLION)
TABLE 121 JAPAN STORE BASED RETAILERS IN A2 MILK MARKET, BY TYPE, 2020-2029 (USD MILLION)
TABLE 122 JAPAN NON-STORE RETAILERS IN A2 MILK MARKET, BY TYPE, 2020-2029 (USD MILLION)
TABLE 123 PHILIPPINES A2 MILK MARKET, BY FORM, 2020-2029 (USD MILLION)
TABLE 124 PHILIPPINES A2 MILK MARKET, BY NATURE, 2020-2029 (USD MILLION)
TABLE 125 PHILIPPINES A2 MILK MARKET, BY FAT CONTENT, 2020-2029 (USD MILLION)
TABLE 126 PHILIPPINES A2 MILK MARKET, BY PACKAGING SIZE, 2020-2029 (USD MILLION)
TABLE 127 PHILIPPINES A2 MILK MARKET, BY PACKAGING FORM, 2020-2029 (USD MILLION)
TABLE 128 PHILIPPINES BOTTLES IN A2 MILK MARKET, BY TYPE, 2020-2029 (USD MILLION)
TABLE 129 PHILIPPINES A2 MILK MARKET, BY DISTRIBUTION CHANNEL, 2020-2029 (USD MILLION)
TABLE 130 PHILIPPINES STORE BASED RETAILERS IN A2 MILK MARKET, BY TYPE, 2020-2029 (USD MILLION)
TABLE 131 PHILIPPINES NON-STORE RETAILERS IN A2 MILK MARKET, BY TYPE, 2020-2029 (USD MILLION)
TABLE 132 THAILAND A2 MILK MARKET, BY FORM, 2020-2029 (USD MILLION)
TABLE 133 THAILAND A2 MILK MARKET, BY NATURE, 2020-2029 (USD MILLION)
TABLE 134 THAILAND A2 MILK MARKET, BY FAT CONTENT, 2020-2029 (USD MILLION)
TABLE 135 THAILAND A2 MILK MARKET, BY PACKAGING SIZE, 2020-2029 (USD MILLION)
TABLE 136 THAILAND A2 MILK MARKET, BY PACKAGING FORM, 2020-2029 (USD MILLION)
TABLE 137 THAILAND BOTTLES IN A2 MILK MARKET, BY TYPE, 2020-2029 (USD MILLION)
TABLE 138 THAILAND A2 MILK MARKET, BY DISTRIBUTION CHANNEL, 2020-2029 (USD MILLION)
TABLE 139 THAILAND STORE BASED RETAILERS IN A2 MILK MARKET, BY TYPE, 2020-2029 (USD MILLION)
TABLE 140 THAILAND NON-STORE RETAILERS IN A2 MILK MARKET, BY TYPE, 2020-2029 (USD MILLION)
TABLE 141 REST OF ASIA-PACIFIC A2 MILK MARKET, BY FORM, 2020-2029 (USD MILLION)
TABLE 142 EUROPE A2 MILK MARKET, BY COUNTRY, 2020-2029 (USD MILLION)
TABLE 143 EUROPE A2 MILK MARKET, BY FORM, 2020-2029 (USD MILLION)
TABLE 144 EUROPE A2 MILK MARKET, BY NATURE, 2020-2029 (USD MILLION)
TABLE 145 EUROPE A2 MILK MARKET, BY FAT CONTENT, 2020-2029 (USD MILLION)
TABLE 146 EUROPE A2 MILK MARKET, BY PACKAGING SIZE, 2020-2029 (USD MILLION)
TABLE 147 EUROPE A2 MILK MARKET, BY PACKAGING FORM, 2020-2029 (USD MILLION)
TABLE 148 EUROPE BOTTLES IN A2 MILK MARKET, BY TYPE, 2020-2029 (USD MILLION)
TABLE 149 EUROPE A2 MILK MARKET, BY DISTRIBUTION CHANNEL, 2020-2029 (USD MILLION)
TABLE 150 EUROPE STORE BASED RETAILERS IN A2 MILK MARKET, BY TYPE, 2020-2029 (USD MILLION)
TABLE 151 EUROPE NON-STORE RETAILERS IN A2 MILK MARKET, BY TYPE, 2020-2029 (USD MILLION)
TABLE 152 GERMANY A2 MILK MARKET, BY FORM, 2020-2029 (USD MILLION)
TABLE 153 GERMANY A2 MILK MARKET, BY NATURE, 2020-2029 (USD MILLION)
TABLE 154 GERMANY A2 MILK MARKET, BY FAT CONTENT, 2020-2029 (USD MILLION)
TABLE 155 GERMANY A2 MILK MARKET, BY PACKAGING SIZE, 2020-2029 (USD MILLION)
TABLE 156 GERMANY A2 MILK MARKET, BY PACKAGING FORM, 2020-2029 (USD MILLION)
TABLE 157 GERMANY BOTTLES IN A2 MILK MARKET, BY TYPE, 2020-2029 (USD MILLION)
TABLE 158 GERMANY A2 MILK MARKET, BY DISTRIBUTION CHANNEL, 2020-2029 (USD MILLION)
TABLE 159 GERMANY STORE BASED RETAILERS IN A2 MILK MARKET, BY TYPE, 2020-2029 (USD MILLION)
TABLE 160 GERMANY NON-STORE RETAILERS IN A2 MILK MARKET, BY TYPE, 2020-2029 (USD MILLION)
TABLE 161 NETHERLANDS A2 MILK MARKET, BY FORM, 2020-2029 (USD MILLION)
TABLE 162 NETHERLANDS A2 MILK MARKET, BY NATURE, 2020-2029 (USD MILLION)
TABLE 163 NETHERLANDS A2 MILK MARKET, BY FAT CONTENT, 2020-2029 (USD MILLION)
TABLE 164 NETHERLANDS A2 MILK MARKET, BY PACKAGING SIZE, 2020-2029 (USD MILLION)
TABLE 165 NETHERLANDS A2 MILK MARKET, BY PACKAGING FORM, 2020-2029 (USD MILLION)
TABLE 166 NETHERLANDS BOTTLES IN A2 MILK MARKET, BY TYPE, 2020-2029 (USD MILLION)
TABLE 167 NETHERLANDS A2 MILK MARKET, BY DISTRIBUTION CHANNEL, 2020-2029 (USD MILLION)
TABLE 168 NETHERLANDS STORE BASED RETAILERS IN A2 MILK MARKET, BY TYPE, 2020-2029 (USD MILLION)
TABLE 169 NETHERLANDS NON-STORE RETAILERS IN A2 MILK MARKET, BY TYPE, 2020-2029 (USD MILLION)
TABLE 170 SWITZERLAND A2 MILK MARKET, BY FORM, 2020-2029 (USD MILLION)
TABLE 171 SWITZERLAND A2 MILK MARKET, BY NATURE, 2020-2029 (USD MILLION)
TABLE 172 SWITZERLAND A2 MILK MARKET, BY FAT CONTENT, 2020-2029 (USD MILLION)
TABLE 173 SWITZERLAND A2 MILK MARKET, BY PACKAGING SIZE, 2020-2029 (USD MILLION)
TABLE 174 SWITZERLAND A2 MILK MARKET, BY PACKAGING FORM, 2020-2029 (USD MILLION)
TABLE 175 SWITZERLAND BOTTLES IN A2 MILK MARKET, BY TYPE, 2020-2029 (USD MILLION)
TABLE 176 SWITZERLAND A2 MILK MARKET, BY DISTRIBUTION CHANNEL, 2020-2029 (USD MILLION)
TABLE 177 SWITZERLAND STORE BASED RETAILERS IN A2 MILK MARKET, BY TYPE, 2020-2029 (USD MILLION)
TABLE 178 SWITZERLAND NON-STORE RETAILERS IN A2 MILK MARKET, BY TYPE, 2020-2029 (USD MILLION)
TABLE 179 RUSSIA A2 MILK MARKET, BY FORM, 2020-2029 (USD MILLION)
TABLE 180 RUSSIA A2 MILK MARKET, BY NATURE, 2020-2029 (USD MILLION)
TABLE 181 RUSSIA A2 MILK MARKET, BY FAT CONTENT, 2020-2029 (USD MILLION)
TABLE 182 RUSSIA A2 MILK MARKET, BY PACKAGING SIZE, 2020-2029 (USD MILLION)
TABLE 183 RUSSIA A2 MILK MARKET, BY PACKAGING FORM, 2020-2029 (USD MILLION)
TABLE 184 RUSSIA BOTTLES IN A2 MILK MARKET, BY TYPE, 2020-2029 (USD MILLION)
TABLE 185 RUSSIA A2 MILK MARKET, BY DISTRIBUTION CHANNEL, 2020-2029 (USD MILLION)
TABLE 186 RUSSIA STORE BASED RETAILERS IN A2 MILK MARKET, BY TYPE, 2020-2029 (USD MILLION)
TABLE 187 RUSSIA NON-STORE RETAILERS IN A2 MILK MARKET, BY TYPE, 2020-2029 (USD MILLION)
TABLE 188 U.K. A2 MILK MARKET, BY FORM, 2020-2029 (USD MILLION)
TABLE 189 U.K. A2 MILK MARKET, BY NATURE, 2020-2029 (USD MILLION)
TABLE 190 U.K. A2 MILK MARKET, BY FAT CONTENT, 2020-2029 (USD MILLION)
TABLE 191 U.K. A2 MILK MARKET, BY PACKAGING SIZE, 2020-2029 (USD MILLION)
TABLE 192 U.K. A2 MILK MARKET, BY PACKAGING FORM, 2020-2029 (USD MILLION)
TABLE 193 U.K. BOTTLES IN A2 MILK MARKET, BY TYPE, 2020-2029 (USD MILLION)
TABLE 194 U.K. A2 MILK MARKET, BY DISTRIBUTION CHANNEL, 2020-2029 (USD MILLION)
TABLE 195 U.K. STORE BASED RETAILERS IN A2 MILK MARKET, BY TYPE, 2020-2029 (USD MILLION)
TABLE 196 U.K. NON-STORE RETAILERS IN A2 MILK MARKET, BY TYPE, 2020-2029 (USD MILLION)
TABLE 197 FRANCE A2 MILK MARKET, BY FORM, 2020-2029 (USD MILLION)
TABLE 198 FRANCE A2 MILK MARKET, BY NATURE, 2020-2029 (USD MILLION)
TABLE 199 FRANCE A2 MILK MARKET, BY FAT CONTENT, 2020-2029 (USD MILLION)
TABLE 200 FRANCE A2 MILK MARKET, BY PACKAGING SIZE, 2020-2029 (USD MILLION)
TABLE 201 FRANCE A2 MILK MARKET, BY PACKAGING FORM, 2020-2029 (USD MILLION)
TABLE 202 FRANCE BOTTLES IN A2 MILK MARKET, BY TYPE, 2020-2029 (USD MILLION)
TABLE 203 FRANCE A2 MILK MARKET, BY DISTRIBUTION CHANNEL, 2020-2029 (USD MILLION)
TABLE 204 FRANCE STORE BASED RETAILERS IN A2 MILK MARKET, BY TYPE, 2020-2029 (USD MILLION)
TABLE 205 FRANCE NON-STORE RETAILERS IN A2 MILK MARKET, BY TYPE, 2020-2029 (USD MILLION)
TABLE 206 SPAIN A2 MILK MARKET, BY FORM, 2020-2029 (USD MILLION)
TABLE 207 SPAIN A2 MILK MARKET, BY NATURE, 2020-2029 (USD MILLION)
TABLE 208 SPAIN A2 MILK MARKET, BY FAT CONTENT, 2020-2029 (USD MILLION)
TABLE 209 SPAIN A2 MILK MARKET, BY PACKAGING SIZE, 2020-2029 (USD MILLION)
TABLE 210 SPAIN A2 MILK MARKET, BY PACKAGING FORM, 2020-2029 (USD MILLION)
TABLE 211 SPAIN BOTTLES IN A2 MILK MARKET, BY TYPE, 2020-2029 (USD MILLION)
TABLE 212 SPAIN A2 MILK MARKET, BY DISTRIBUTION CHANNEL, 2020-2029 (USD MILLION)
TABLE 213 SPAIN STORE BASED RETAILERS IN A2 MILK MARKET, BY TYPE, 2020-2029 (USD MILLION)
TABLE 214 SPAIN NON-STORE RETAILERS IN A2 MILK MARKET, BY TYPE, 2020-2029 (USD MILLION)
TABLE 215 REST OF EUROPE A2 MILK MARKET, BY FORM, 2020-2029 (USD MILLION)
TABLE 216 NORTH AMERICA A2 MILK MARKET, BY COUNTRY, 2020-2029 (USD MILLION)
TABLE 217 NORTH AMERICA A2 MILK MARKET, BY FORM, 2020-2029 (USD MILLION)
TABLE 218 NORTH AMERICA A2 MILK MARKET, BY NATURE, 2020-2029 (USD MILLION)
TABLE 219 NORTH AMERICA A2 MILK MARKET, BY FAT CONTENT, 2020-2029 (USD MILLION)
TABLE 220 NORTH AMERICA A2 MILK MARKET, BY PACKAGING SIZE, 2020-2029 (USD MILLION)
TABLE 221 NORTH AMERICA A2 MILK MARKET, BY PACKAGING FORM, 2020-2029 (USD MILLION)
TABLE 222 NORTH AMERICA BOTTLES IN A2 MILK MARKET, BY TYPE, 2020-2029 (USD MILLION)
TABLE 223 NORTH AMERICA A2 MILK MARKET, BY DISTRIBUTION CHANNEL, 2020-2029 (USD MILLION)
TABLE 224 NORTH AMERICA STORE BASED RETAILERS IN A2 MILK MARKET, BY TYPE, 2020-2029 (USD MILLION)
TABLE 225 NORTH AMERICA NON-STORE RETAILERS IN A2 MILK MARKET, BY TYPE, 2020-2029 (USD MILLION)
TABLE 226 U.S. A2 MILK MARKET, BY FORM, 2020-2029 (USD MILLION)
TABLE 227 U.S. A2 MILK MARKET, BY NATURE, 2020-2029 (USD MILLION)
TABLE 228 U.S. A2 MILK MARKET, BY FAT CONTENT, 2020-2029 (USD MILLION)
TABLE 229 U.S. A2 MILK MARKET, BY PACKAGING SIZE, 2020-2029 (USD MILLION)
TABLE 230 U.S. A2 MILK MARKET, BY PACKAGING FORM, 2020-2029 (USD MILLION)
TABLE 231 U.S. BOTTLES IN A2 MILK MARKET, BY TYPE, 2020-2029 (USD MILLION)
TABLE 232 U.S. A2 MILK MARKET, BY DISTRIBUTION CHANNEL, 2020-2029 (USD MILLION)
TABLE 233 U.S. STORE BASED RETAILERS IN A2 MILK MARKET, BY TYPE, 2020-2029 (USD MILLION)
TABLE 234 U.S. NON-STORE RETAILERS IN A2 MILK MARKET, BY TYPE, 2020-2029 (USD MILLION)
TABLE 235 CANADA A2 MILK MARKET, BY FORM, 2020-2029 (USD MILLION)
TABLE 236 CANADA A2 MILK MARKET, BY NATURE, 2020-2029 (USD MILLION)
TABLE 237 CANADA A2 MILK MARKET, BY FAT CONTENT, 2020-2029 (USD MILLION)
TABLE 238 CANADA A2 MILK MARKET, BY PACKAGING SIZE, 2020-2029 (USD MILLION)
TABLE 239 CANADA A2 MILK MARKET, BY PACKAGING FORM, 2020-2029 (USD MILLION)
TABLE 240 CANADA BOTTLES IN A2 MILK MARKET, BY TYPE, 2020-2029 (USD MILLION)
TABLE 241 CANADA A2 MILK MARKET, BY DISTRIBUTION CHANNEL, 2020-2029 (USD MILLION)
TABLE 242 CANADA STORE BASED RETAILERS IN A2 MILK MARKET, BY TYPE, 2020-2029 (USD MILLION)
TABLE 243 CANADA NON-STORE RETAILERS IN A2 MILK MARKET, BY TYPE, 2020-2029 (USD MILLION)
TABLE 244 SOUTH AMERICA A2 MILK MARKET, BY COUNTRY, 2020-2029 (USD MILLION)
TABLE 245 SOUTH AMERICA A2 MILK MARKET, BY FORM, 2020-2029 (USD MILLION)
TABLE 246 SOUTH AMERICA A2 MILK MARKET, BY NATURE, 2020-2029 (USD MILLION)
TABLE 247 SOUTH AMERICA A2 MILK MARKET, BY FAT CONTENT, 2020-2029 (USD MILLION)
TABLE 248 SOUTH AMERICA A2 MILK MARKET, BY PACKAGING SIZE, 2020-2029 (USD MILLION)
TABLE 249 SOUTH AMERICA A2 MILK MARKET, BY PACKAGING FORM, 2020-2029 (USD MILLION)
TABLE 250 SOUTH AMERICA BOTTLES IN A2 MILK MARKET, BY TYPE, 2020-2029 (USD MILLION)
TABLE 251 SOUTH AMERICA A2 MILK MARKET, BY DISTRIBUTION CHANNEL, 2020-2029 (USD MILLION)
TABLE 252 SOUTH AMERICA STORE BASED RETAILERS IN A2 MILK MARKET, BY TYPE, 2020-2029 (USD MILLION)
TABLE 253 SOUTH AMERICA NON-STORE RETAILERS IN A2 MILK MARKET, BY TYPE, 2020-2029 (USD MILLION)
TABLE 254 BRAZIL A2 MILK MARKET, BY FORM, 2020-2029 (USD MILLION)
TABLE 255 BRAZIL A2 MILK MARKET, BY NATURE, 2020-2029 (USD MILLION)
TABLE 256 BRAZIL A2 MILK MARKET, BY FAT CONTENT, 2020-2029 (USD MILLION)
TABLE 257 BRAZIL A2 MILK MARKET, BY PACKAGING SIZE, 2020-2029 (USD MILLION)
TABLE 258 BRAZIL A2 MILK MARKET, BY PACKAGING FORM, 2020-2029 (USD MILLION)
TABLE 259 BRAZIL BOTTLES IN A2 MILK MARKET, BY TYPE, 2020-2029 (USD MILLION)
TABLE 260 BRAZIL A2 MILK MARKET, BY DISTRIBUTION CHANNEL, 2020-2029 (USD MILLION)
TABLE 261 BRAZIL STORE BASED RETAILERS IN A2 MILK MARKET, BY TYPE, 2020-2029 (USD MILLION)
TABLE 262 BRAZIL NON-STORE RETAILERS IN A2 MILK MARKET, BY TYPE, 2020-2029 (USD MILLION)
TABLE 263 ARGENTINA A2 MILK MARKET, BY FORM, 2020-2029 (USD MILLION)
TABLE 264 ARGENTINA A2 MILK MARKET, BY NATURE, 2020-2029 (USD MILLION)
TABLE 265 ARGENTINA A2 MILK MARKET, BY FAT CONTENT, 2020-2029 (USD MILLION)
TABLE 266 ARGENTINA A2 MILK MARKET, BY PACKAGING SIZE, 2020-2029 (USD MILLION)
TABLE 267 ARGENTINA A2 MILK MARKET, BY PACKAGING FORM, 2020-2029 (USD MILLION)
TABLE 268 ARGENTINA BOTTLES IN A2 MILK MARKET, BY TYPE, 2020-2029 (USD MILLION)
TABLE 269 ARGENTINA A2 MILK MARKET, BY DISTRIBUTION CHANNEL, 2020-2029 (USD MILLION)
TABLE 270 ARGENTINA STORE BASED RETAILERS IN A2 MILK MARKET, BY TYPE, 2020-2029 (USD MILLION)
TABLE 271 ARGENTINA NON-STORE RETAILERS IN A2 MILK MARKET, BY TYPE, 2020-2029 (USD MILLION)
TABLE 272 MIDDLE-EAST AND AFRICA A2 MILK MARKET, BY COUNTRY, 2020-2029 (USD MILLION)
TABLE 273 MIDDLE-EAST AND AFRICA A2 MILK MARKET, BY FORM, 2020-2029 (USD MILLION)
TABLE 274 MIDDLE-EAST AND AFRICA A2 MILK MARKET, BY NATURE, 2020-2029 (USD MILLION)
TABLE 275 MIDDLE-EAST AND AFRICA A2 MILK MARKET, BY FAT CONTENT, 2020-2029 (USD MILLION)
TABLE 276 MIDDLE-EAST AND AFRICA A2 MILK MARKET, BY PACKAGING SIZE, 2020-2029 (USD MILLION)
TABLE 277 MIDDLE-EAST AND AFRICA A2 MILK MARKET, BY PACKAGING FORM, 2020-2029 (USD MILLION)
TABLE 278 MIDDLE-EAST AND AFRICA BOTTLES IN A2 MILK MARKET, BY TYPE, 2020-2029 (USD MILLION)
TABLE 279 MIDDLE-EAST AND AFRICA A2 MILK MARKET, BY DISTRIBUTION CHANNEL, 2020-2029 (USD MILLION)
TABLE 280 MIDDLE-EAST AND AFRICA STORE BASED RETAILERS IN A2 MILK MARKET, BY TYPE, 2020-2029 (USD MILLION)
TABLE 281 MIDDLE-EAST AND AFRICA NON-STORE RETAILERS IN A2 MILK MARKET, BY TYPE, 2020-2029 (USD MILLION)
TABLE 282 SOUTH AFRICA A2 MILK MARKET, BY FORM, 2020-2029 (USD MILLION)
TABLE 283 SOUTH AFRICA A2 MILK MARKET, BY NATURE, 2020-2029 (USD MILLION)
TABLE 284 SOUTH AFRICA A2 MILK MARKET, BY FAT CONTENT, 2020-2029 (USD MILLION)
TABLE 285 SOUTH AFRICA A2 MILK MARKET, BY PACKAGING SIZE, 2020-2029 (USD MILLION)
TABLE 286 SOUTH AFRICA A2 MILK MARKET, BY PACKAGING FORM, 2020-2029 (USD MILLION)
TABLE 287 SOUTH AFRICA BOTTLES IN A2 MILK MARKET, BY TYPE, 2020-2029 (USD MILLION)
TABLE 288 SOUTH AFRICA A2 MILK MARKET, BY DISTRIBUTION CHANNEL, 2020-2029 (USD MILLION)
TABLE 289 SOUTH AFRICA STORE BASED RETAILERS IN A2 MILK MARKET, BY TYPE, 2020-2029 (USD MILLION)
TABLE 290 SOUTH AFRICA NON-STORE RETAILERS IN A2 MILK MARKET, BY TYPE, 2020-2029 (USD MILLION)
TABLE 291 UAE A2 MILK MARKET, BY FORM, 2020-2029 (USD MILLION)
TABLE 292 UAE A2 MILK MARKET, BY NATURE, 2020-2029 (USD MILLION)
TABLE 293 UAE A2 MILK MARKET, BY FAT CONTENT, 2020-2029 (USD MILLION)
TABLE 294 UAE A2 MILK MARKET, BY PACKAGING SIZE, 2020-2029 (USD MILLION)
TABLE 295 UAE A2 MILK MARKET, BY PACKAGING FORM, 2020-2029 (USD MILLION)
TABLE 296 UAE BOTTLES IN A2 MILK MARKET, BY TYPE, 2020-2029 (USD MILLION)
TABLE 297 UAE A2 MILK MARKET, BY DISTRIBUTION CHANNEL, 2020-2029 (USD MILLION)
TABLE 298 UAE STORE BASED RETAILERS IN A2 MILK MARKET, BY TYPE, 2020-2029 (USD MILLION)
TABLE 299 UAE NON-STORE RETAILERS IN A2 MILK MARKET, BY TYPE, 2020-2029 (USD MILLION)
TABLE 300 REST OF MIDDLE EAST AND AFRICA A2 MILK MARKET, BY FORM, 2020-2029 (USD MILLION)
Lista de figuras
FIGURE 1 GLOBAL A2 MILK MARKET: SEGMENTATION
FIGURE 2 GLOBAL A2 MILK MARKET: DATA TRIANGULATION
FIGURE 3 GLOBAL A2 MILK MARKET: DROC ANALYSIS
FIGURE 4 GLOBAL A2 MILK MARKET: GLOBAL VS REGIONAL MARKET ANALYSIS
FIGURE 5 GLOBAL A2 MILK MARKET: COMPANY RESEARCH ANALYSIS
FIGURE 6 GLOBAL A2 MILK MARKET: INTERVIEW DEMOGRAPHICS
FIGURE 7 GLOBAL A2 MILK MARKET: DBMR MARKET POSITION GRID
FIGURE 8 GLOBAL A2 MILK MARKET: VENDOR SHARE ANALYSIS
FIGURE 9 GLOBAL A2 MILK MARKET: SEGMENTATION
FIGURE 10 ASIA-PACIFIC REGION IS EXPECTED TO DOMINATE THE GLOBAL A2 MILK MARKET AND GROW WITH THE HIGHEST CAGR IN THE FORECAST PERIOD
FIGURE 11 INCREASING APPLICATION OF A2 MILK IN THE FOOD INDUSTRY IS EXPECTED TO DRIVE THE GROWTH OF THE GLOBAL A2 MILK MARKET IN THE FORECAST PERIOD
FIGURE 12 LIQUID SEGMENT IS EXPECTED TO ACCOUNT FOR THE LARGEST SHARE OF THE GLOBAL A2 MILK MARKET IN 2022 & 2029
FIGURE 13 ASIA-PACIFIC IS THE FASTEST GROWING MARKET FOR A2 MILK MANUFACTURERS IN THE FORECAST PERIOD
FIGURE 14 SUPPLY CHAIN OF THE GLOBAL A2 MILK MARKET
FIGURE 15 VALUE CHAIN OF A2 MILK
FIGURE 16 DRIVERS, RESTRAINTS, OPPORTUNITIES, AND CHALLENGES OF THE GLOBAL A2 MILK MARKET
FIGURE 17 GLOBAL A2 MILK MARKET: BY FORM, 2021
FIGURE 18 GLOBAL A2 MILK MARKET: BY NATURE, 2021
FIGURE 19 GLOBAL A2 MILK MARKET: BY FAT CONTENT, 2021
FIGURE 20 GLOBAL A2 MILK MARKET: BY PACKAGING SIZE, 2021
FIGURE 21 GLOBAL A2 MILK MARKET: BY PACKAGING FORM, 2021
FIGURE 22 GLOBAL A2 MILK MARKET: BY DISTRIBUTION CHANNEL, 2021
FIGURE 23 GLOBAL A2 MILK MARKET: SNAPSHOT (2021)
FIGURE 24 GLOBAL A2 MILK MARKET: BY REGION (2021)
FIGURE 25 GLOBAL A2 MILK MARKET: BY REGION (2022 & 2029)
FIGURE 26 GLOBAL A2 MILK MARKET: BY REGION (2021 & 2029)
FIGURE 27 GLOBAL A2 MILK MARKET: BY FORM (2022-2029)
FIGURE 28 ASIA-PACIFIC A2 MILK MARKET: SNAPSHOT (2021)
FIGURE 29 ASIA-PACIFIC A2 MILK MARKET: BY COUNTRY (2021)
FIGURE 30 ASIA-PACIFIC A2 MILK MARKET: BY COUNTRY (2022 & 2029)
FIGURE 31 ASIA-PACIFIC A2 MILK MARKET: BY COUNTRY (2021 & 2029)
FIGURE 32 ASIA-PACIFIC A2 MILK MARKET: BY FORM (2022 & 2029)
FIGURE 33 EUROPE A2 MILK MARKET: SNAPSHOT (2021)
FIGURE 34 EUROPE A2 MILK MARKET: BY COUNTRY (2021)
FIGURE 35 EUROPE A2 MILK MARKET: BY COUNTRY (2022 & 2029)
FIGURE 36 EUROPE A2 MILK MARKET: BY COUNTRY (2021 & 2029)
FIGURE 37 EUROPE A2 MILK MARKET: BY FORM (2022 & 2029)
FIGURE 38 NORTH AMERICA A2 MILK MARKET: SNAPSHOT (2021)
FIGURE 39 NORTH AMERICA A2 MILK MARKET: BY COUNTRY (2021)
FIGURE 40 NORTH AMERICA A2 MILK MARKET: BY COUNTRY (2022 & 2029)
FIGURE 41 NORTH AMERICA A2 MILK MARKET: BY COUNTRY (2022 & 2029)
FIGURE 42 NORTH AMERICA A2 MILK MARKET: BY FORM (2022 & 2029)
FIGURE 43 SOUTH AMERICA A2 MILK MARKET: SNAPSHOT (2021)
FIGURE 44 SOUTH AMERICA A2 MILK MARKET: BY COUNTRY (2021)
FIGURE 45 SOUTH AMERICA A2 MILK MARKET: BY COUNTRY (2022 & 2029)
FIGURE 46 SOUTH AMERICA A2 MILK MARKET: BY COUNTRY (2021 & 2029)
FIGURE 47 SOUTH AMERICA A2 MILK MARKET: BY FORM (2022 & 2029)
FIGURE 48 MIDDLE EAST AND AFRICA A2 MILK MARKET: SNAPSHOT (2021)
FIGURE 49 MIDDLE EAST AND AFRICA A2 MILK MARKET: BY COUNTRY (2021)
FIGURE 50 MIDDLE EAST AND AFRICA A2 MILK MARKET: BY COUNTRY (2022 & 2029)
FIGURE 51 MIDDLE EAST AND AFRICA A2 MILK MARKET: BY COUNTRY (2021 & 2029)
FIGURE 52 MIDDLE EAST AND AFRICA A2 MILK MARKET: BY FORM (2022 & 2029)
FIGURE 53 GLOBAL A2 MILK MARKET: COMPANY SHARE 2021 (%)
FIGURE 54 NORTH AMERICA A2 MILK MARKET: COMPANY SHARE 2021 (%)
FIGURE 55 EUROPE A2 MILK MARKET: COMPANY SHARE 2021 (%)
FIGURE 56 ASIA-PACIFIC A2 MILK MARKET: COMPANY SHARE 2021 (%)
Metodología de investigación
La recopilación de datos y el análisis del año base se realizan utilizando módulos de recopilación de datos con muestras de gran tamaño. La etapa incluye la obtención de información de mercado o datos relacionados a través de varias fuentes y estrategias. Incluye el examen y la planificación de todos los datos adquiridos del pasado con antelación. Asimismo, abarca el examen de las inconsistencias de información observadas en diferentes fuentes de información. Los datos de mercado se analizan y estiman utilizando modelos estadísticos y coherentes de mercado. Además, el análisis de la participación de mercado y el análisis de tendencias clave son los principales factores de éxito en el informe de mercado. Para obtener más información, solicite una llamada de un analista o envíe su consulta.
La metodología de investigación clave utilizada por el equipo de investigación de DBMR es la triangulación de datos, que implica la extracción de datos, el análisis del impacto de las variables de datos en el mercado y la validación primaria (experto en la industria). Los modelos de datos incluyen cuadrícula de posicionamiento de proveedores, análisis de línea de tiempo de mercado, descripción general y guía del mercado, cuadrícula de posicionamiento de la empresa, análisis de patentes, análisis de precios, análisis de participación de mercado de la empresa, estándares de medición, análisis global versus regional y de participación de proveedores. Para obtener más información sobre la metodología de investigación, envíe una consulta para hablar con nuestros expertos de la industria.
Personalización disponible
Data Bridge Market Research es líder en investigación formativa avanzada. Nos enorgullecemos de brindar servicios a nuestros clientes existentes y nuevos con datos y análisis que coinciden y se adaptan a sus objetivos. El informe se puede personalizar para incluir análisis de tendencias de precios de marcas objetivo, comprensión del mercado de países adicionales (solicite la lista de países), datos de resultados de ensayos clínicos, revisión de literatura, análisis de mercado renovado y base de productos. El análisis de mercado de competidores objetivo se puede analizar desde análisis basados en tecnología hasta estrategias de cartera de mercado. Podemos agregar tantos competidores sobre los que necesite datos en el formato y estilo de datos que esté buscando. Nuestro equipo de analistas también puede proporcionarle datos en archivos de Excel sin procesar, tablas dinámicas (libro de datos) o puede ayudarlo a crear presentaciones a partir de los conjuntos de datos disponibles en el informe.

