

Mercado europeo de sustitutos del azúcar, por tipo (jarabes con alto contenido de fructosa, edulcorantes de alta intensidad , edulcorantes de baja intensidad), forma (cristalizado, líquido, polvo), categoría (natural, sintético), aplicación (bebidas, productos alimenticios, cuidado bucal, productos farmacéuticos, otros): tendencias de la industria y pronóstico hasta 2029
Análisis y tamaño del mercado
La obesidad, la diabetes y el síndrome metabólico se han convertido en importantes problemas de salud pública debido a su relación con una ingesta calórica desequilibrada. Los sustitutos del azúcar desempeñan un papel esencial en la reducción de calorías como parte de una dieta saludable y un régimen de actividad física para combatir las afecciones mencionadas anteriormente.
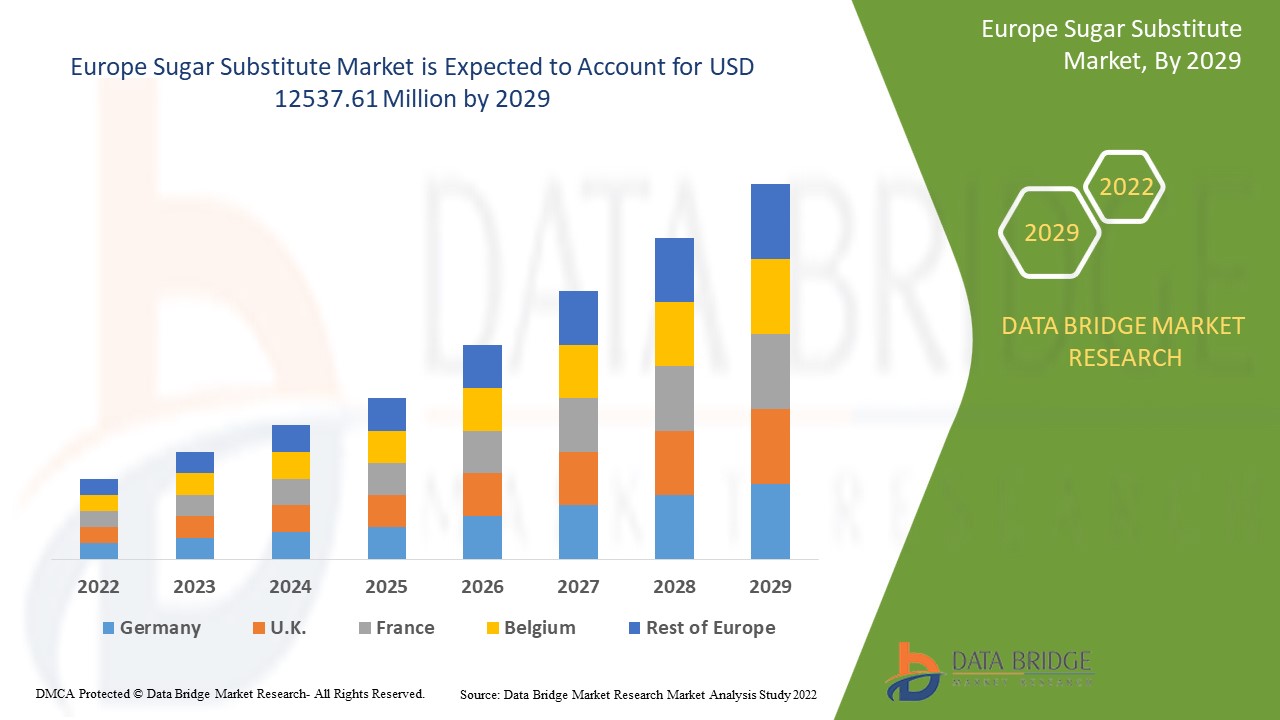
Data Bridge Market Research analiza que el mercado de sustitutos del azúcar se valoró en 6625,02 millones en 2021 y se espera que alcance el valor de USD 12537,61 millones para 2029, a una CAGR del 8,3% durante el período de pronóstico de 2022 a 2029.
Definición de mercado
Un sustituto del azúcar es un aditivo alimentario que sabe a azúcar pero contiene muchas menos calorías que los edulcorantes a base de azúcar, lo que lo convierte en un edulcorante sin calorías o con pocas calorías. Se derivan de sustancias naturales o se crean artificialmente utilizando productos químicos y conservantes.
Alcance del informe y segmentación del mercado
|
Métrica del informe |
Detalles |
|
Período de pronóstico |
2022 a 2029 |
|
Año base |
2021 |
|
Años históricos |
2020 (Personalizable para 2019 - 2014) |
|
Unidades cuantitativas |
Ingresos en millones de USD, volúmenes en unidades, precios en USD |
|
Segmentos cubiertos |
Tipo (jarabes con alto contenido de fructosa, edulcorantes de alta intensidad, edulcorantes de baja intensidad), forma (cristalizado, líquido, polvo), categoría (natural, sintético), aplicación (bebidas, productos alimenticios, cuidado bucal, productos farmacéuticos, otros) |
|
Países cubiertos |
Alemania, Reino Unido, Francia, España, Italia, Dinamarca, Países Bajos, Suiza, Polonia, Rusia, Suecia, Bélgica, Turquía y resto de Europa. |
|
Actores del mercado cubiertos |
DuPont (EE. UU.), ADM (EE. UU.), Tate & Lyle (Reino Unido), Ingredion (EE. UU.), Cargill Incorporated (EE. UU.), Roquette Frères (Francia), PureCircle Ltd (EE. UU.), MacAndrews & Forbes Incorporated (EE. UU.), JK Sucralose Inc. (China), Ajinomoto Co. Inc. (Japón), JK Sucralose Inc. (China), Ajinomoto Co. Inc. (Japón), NutraSweetM Co. (EE. UU.), Südzucker AG (Alemania), Layn Corp. (China), Zhucheng Haotian Pharm Co., Ltd. (China), HSWT (Francia) |
|
Oportunidades |
|
Dinámica del mercado de los sustitutos del azúcar
Conductores
- Crecientes preferencias por el azúcar natural
Los sustitutos del azúcar se utilizan comúnmente como sustitutos del azúcar en bebidas como refrescos o bebidas carbonatadas, jugos saborizantes y otros productos alimenticios. Los sustitutos naturales del azúcar están ganando popularidad en los Estados Unidos a medida que las preferencias de los consumidores cambian hacia alimentos y bebidas de base orgánica. El azúcar natural es un edulcorante de bajas calorías extraído de plantas como la stevia, las frutas del monje y otras 200 veces más dulces que el azúcar. Estas ventajas de los sustitutos del azúcar, así como sus ventajas orgánicas, han ayudado al crecimiento del mercado.
- Demanda creciente en diversas industrias de usuarios finales
El aumento del uso de sustitutos del azúcar en diversas aplicaciones de uso final, como productos farmacéuticos, cosméticos, alimentos, piensos, producción de etanol y otros, también está impulsando el mercado. Se puede utilizar como agente de retención de agua en sueros cosméticos y de cuidado personal y como suplemento nutricional en productos farmacéuticos como jarabes e inyecciones. Una sólida investigación y desarrollo combinada con capacidades técnicas ha colocado a la empresa a la cabeza y, como resultado, la demanda de azúcar cristalino ha crecido con el tiempo.
Oportunidad
La creciente innovación técnica en el sector de procesamiento de alimentos y la creciente demanda de barras de snacks nutricionales aumentarán el crecimiento del mercado. Se espera que los fabricantes de sustitutos del azúcar se beneficien de las fluctuaciones de precios del azúcar. Como resultado de estos factores, el mercado se está expandiendo con el número de pacientes diabéticos y la conciencia de la salud de los consumidores.
Restricciones
Sin embargo, muchos científicos creen que el consumo excesivo de sustitutos del azúcar puede provocar graves problemas de salud, como diabetes tipo II, enfermedades cardíacas, obesidad y, en algunos casos, cáncer. La menor disponibilidad de sustitutos del azúcar, combinada con el desarrollo de edulcorantes artificiales, ha modificado las preferencias de los consumidores hacia los edulcorantes artificiales, lo que limita el crecimiento del mercado.
Este informe sobre el mercado de sustitutos del azúcar proporciona detalles de los nuevos desarrollos recientes, regulaciones comerciales, análisis de importación y exportación, análisis de producción, optimización de la cadena de valor, participación de mercado, impacto de los actores del mercado nacional y localizado, analiza las oportunidades en términos de bolsillos de ingresos emergentes, cambios en las regulaciones del mercado, análisis estratégico del crecimiento del mercado, tamaño del mercado, crecimientos del mercado por categorías, nichos de aplicación y dominio, aprobaciones de productos, lanzamientos de productos, expansiones geográficas, innovaciones tecnológicas en el mercado. Para obtener más información sobre el mercado de sustitutos del azúcar, comuníquese con Data Bridge Market Research para obtener un informe de analista; nuestro equipo lo ayudará a tomar una decisión de mercado informada para lograr el crecimiento del mercado.
Impacto de la COVID-19 en el mercado de sustitutos del azúcar
La pandemia de COVID-19 en Europa se está convirtiendo en un importante impedimento para la economía europea y afecta el crecimiento de la industria de alimentos y bebidas. Los fabricantes de alimentos han reducido la producción de los principales productos alimenticios. Además, a medida que las personas buscan soluciones para mejorar su salud y bienestar general, existe un rápido aumento en la demanda de productos con menos azúcar y que estimulen la inmunidad debido a la pandemia de COVID-19, la mayoría de los clientes preocupados por la salud han recurrido a alimentos bajos en calorías o sin azúcar. Como resultado de la creciente conciencia de la salud y la alta demanda de soluciones con menor contenido de azúcar entre la población europea, los fabricantes y formuladores de productos se han visto obligados a utilizar sustitutos del azúcar.
Desarrollo reciente
- Tate & Lyle lanzará las herramientas de diseño de soluciones de edulcorantes VANTAGE en julio de 2020. Es una colección de herramientas de diseño de soluciones de edulcorantes nuevas e innovadoras y un programa educativo para crear alimentos y bebidas con menor contenido de azúcar y edulcorantes bajos en calorías.
- En julio de 2018, ADM y Aston Foods (Rusia) formaron una empresa conjunta en Rusia para producir edulcorantes y almidones. Esto ayudó a la expansión de la empresa en el mercado ruso de sustitutos del azúcar.
Panorama del mercado de sustitutos del azúcar en Europa
El mercado de sustitutos del azúcar está segmentado según el tipo, la forma, la categoría y la aplicación. El crecimiento entre estos segmentos lo ayudará a analizar los escasos segmentos de crecimiento en las industrias y brindará a los usuarios una valiosa descripción general del mercado y conocimientos del mercado para ayudarlos a tomar decisiones estratégicas para identificar las principales aplicaciones del mercado.
Tipo
- Edulcorantes de alta intensidad
- Edulcorantes de baja intensidad
- Jarabes con alto contenido de fructosa
Según el tipo, el mercado se segmenta en edulcorantes de alta intensidad, edulcorantes de baja intensidad y jarabes con alto contenido de fructosa.
Forma
- Polvo
- Cristalizado
- Líquido.
En función de la forma, el mercado se segmenta en polvo, cristalizado y líquido.
Categoría
- Natural
- Sintético
Según la categoría, el mercado se segmenta en natural y sintético.
Solicitud
- Productos alimenticios
- Cuidado bucal
- Productos farmacéuticos
- Bebidas
Según la aplicación, el mercado está segmentado en bebidas, productos alimenticios, cuidado bucal, productos farmacéuticos y otros.
Análisis y perspectivas regionales del mercado de sustitutos del azúcar
Se analiza el mercado de sustitutos del azúcar y se proporcionan información y tendencias del tamaño del mercado por país, tipo, forma, categoría y aplicación como se menciona anteriormente.
Los países cubiertos en el informe del mercado de sustitutos del azúcar son Alemania, Reino Unido, Francia, España, Italia, Dinamarca, Países Bajos, Suiza, Polonia, Rusia, Suecia, Bélgica, Turquía y el resto de Europa.
En el mercado europeo de sustitutos del azúcar, Europa representa la gran mayoría de la cuota de mercado debido a la presencia de actores clave, una inversión significativa en I+D, métodos de producción tecnológicamente avanzados y la disponibilidad de materias primas en la región. El avance de los productos farmacéuticos mediante el uso de azúcar natural ha demostrado ser el factor más prometedor para el crecimiento del mercado.
La sección de países del informe también proporciona factores de impacto de mercado individuales y cambios en la regulación del mercado que afectan las tendencias actuales y futuras del mercado. Los puntos de datos como el análisis de la cadena de valor ascendente y descendente, las tendencias técnicas y el análisis de las cinco fuerzas de Porter, los estudios de casos son algunos de los indicadores utilizados para pronosticar el escenario del mercado para países individuales. Además, la presencia y disponibilidad de marcas europeas y sus desafíos enfrentados debido a la gran o escasa competencia de las marcas locales y nacionales, el impacto de los aranceles nacionales y las rutas comerciales se consideran al proporcionar un análisis de pronóstico de los datos del país.
Análisis del panorama competitivo y de la cuota de mercado de los sustitutos del azúcar
El panorama competitivo del mercado de sustitutos del azúcar proporciona detalles por competidor. Los detalles incluidos son una descripción general de la empresa, las finanzas de la empresa, los ingresos generados, el potencial de mercado, la inversión en investigación y desarrollo, las nuevas iniciativas de mercado, la presencia en Europa, los sitios e instalaciones de producción, las capacidades de producción, las fortalezas y debilidades de la empresa, el lanzamiento de productos, la amplitud y variedad de productos, y el dominio de las aplicaciones. Los puntos de datos anteriores proporcionados solo están relacionados con el enfoque de las empresas en relación con el mercado de sustitutos del azúcar.
Algunos de los principales actores que operan en el mercado de sustitutos del azúcar son:
- DuPont (Estados Unidos)
- ADM (Estados Unidos)
- Tate & Lyle (Reino Unido)
- Ingredion (Estados Unidos)
- Cargill Incorporated (Estados Unidos)
- Roquette Frères (Francia)
- PureCircle Ltd (Estados Unidos)
- MacAndrews & Forbes Incorporated (Estados Unidos)
- JK Sucralosa Inc. (China)
- Ajinomoto Co. Inc. (Japón)
- JK Sucralosa Inc. (China)
- Ajinomoto Co. Inc. (Japón)
- NutraSweetM Co. (Estados Unidos)
- Südzucker AG (Alemania)
- Corporación Layn (China)
- Zhucheng Haotian Farmacéutica Co., Ltd. (China)
- HSWT (Francia)
SKU-
Obtenga acceso en línea al informe sobre la primera nube de inteligencia de mercado del mundo

- Panel de análisis de datos interactivo
- Panel de análisis de empresas para oportunidades con alto potencial de crecimiento
- Acceso de analista de investigación para personalización y consultas
- Análisis de la competencia con panel interactivo
- Últimas noticias, actualizaciones y análisis de tendencias
- Aproveche el poder del análisis de referencia para un seguimiento integral de la competencia
Tabla de contenido
1 INTRODUCTION
1.1 OBJECTIVES OF THE STUDY
1.2 MARKET DEFINITION
1.3 OVERVIEW OF EUROPE SUGAR SUBSTITUTES MARKET
1.4 CURRENCY AND PRICING
1.5 LIMITATIONS
1.6 MARKETS COVERED
2 MARKET SEGMENTATION
2.1 MARKETS COVERED
2.2 GEOGRAPHICAL SCOPE
2.3 YEARS CONSIDERED FOR THE STUDY
2.4 DBMR TRIPOD DATA VALIDATION MODEL
2.5 PRIMARY INTERVIEWS WITH KEY OPINION LEADERS
2.6 DBMR MARKET POSITION GRID
2.7 VENDOR SHARE ANALYSIS
2.8 MULTIVARIATE MODELING
2.9 PRODUCT TIMELINE CURVE
2.1 MARKET APPLICATION COVERAGE GRID
2.11 SECONDARY SOURCES
2.12 ASSUMPTIONS
3 MARKET OVERVIEW
3.1 DRIVERS
3.1.1 GROWING NUMBER OF OBESITY & DIABETIC POPULATION
3.1.2 RISING TREND OF HEALTHY LIFESTYLE AND HEALTHY PRODUCTS
3.1.3 INCREASED USAGE OF SUGAR SUBSTITUTES IN FOOD & BAKERY PRODUCTS
3.1.4 INCREASING DEMAND FOR NATURAL SWEETENERS/PLANT SOURCED SWEETENERS
3.1.5 FLUCTUATING PRICES OF SUGAR AND INCREASED TAXATION ON SUGAR PRODUCTS
3.2 RESTRAINTS
3.2.1 STRINGENT REGULATIONS AND POLICIES FOR SUGAR SUBSTITUTE
3.2.2 SIDE EFFECTS OF THE SUGAR SUBSTITUTE
3.3 OPPORTUNITIES
3.3.1 GROWING CONSUMPRION OF HEALTHY AND NUTRITIONAL DRINKS HAVING SUGAR SUBSTITUTES
3.3.2 INCREASING AWARENESS OF SUGAR SUBSTITUTE IN DEVELOPING NATIONS
3.3.3 STRONG INITIATIVES AND STUDIES FOR THE PRODUCT DEVELOPMENT
3.3.4 NEW SUGAR LABELING RULES
3.4 CHALLENGES
3.4.1 MORE EFFORTS TOWARDS TASTE IMPROVEMENT
3.4.2 VAGUENESS ABOUT SUGAR SUBSTITUTE BENEFITS
4 EXECUTIVE SUMMARY
5 PREMIUM INSIGHTS
5.1 PARENT MARKET ANALYSIS
5.2 EXPECTED GROWTH OF SWEETENERS USAGE FOR NEXT 3 YEARS
6 EUROPE SUGAR SUBSTITUTES MARKET, BY TYPE
6.1 OVERVIEW
6.2 HIGH-FRUCTOSE SYRUPS
6.3 HIGH-INTENSITY SWEETENERS
6.3.1 ASPARTAME
6.3.2 CYCLAMATE
6.3.3 ACE-K
6.3.4 SACCHARINE
6.3.5 STEVIA
6.3.6 SUCROLOSE
6.3.7 HONEY
6.3.8 GLYCYRRHIZIN
6.3.9 ALITAME
6.3.10 NEOTAME
6.3.11 OTHERS
6.4 LOW-INTENSITY SWEETENERS
6.4.1 ERYTHRITOL
6.4.2 MALTITOL
6.4.3 SORBITOL
6.4.4 XYLITOL
6.4.5 ISOMALT
6.4.6 HYDROGENATED STARCH HYDROYSATES
6.4.7 MANNITOL
6.4.8 LACITOL
6.4.9 D-TAGATOSE
6.4.10 TREHALOSE
6.4.11 OTHERS
7 EUROPE SUGAR SUBSTITUTES MARKET, BY FORM
7.1 OVERVIEW
7.2 CRYSTALLIZED
7.3 LIQUID
7.4 POWDER
8 EUROPE SUGAR SUBSTITUTES MARKET, BY APPLICATION
8.1 OVERVIEW
8.2 BEVERAGES
8.2.1 CARBONATED SOFT DRINKS
8.2.2 FLAVORED DRINKS
8.2.3 POWDERED BEVERAGES
8.2.3.1 RTD COFFEE
8.2.3.2 RTD TEA
8.2.3.3 SMOOTHIES
8.2.3.4 OTHERS
8.2.4 JUICES
8.2.5 DAIRY ALTERNATIVE DRINKS
8.2.6 FUNCTIONAL DRINKS
8.2.7 OTHERS
8.3 FOOD PRODUCTS
8.3.1 DAIRY PRODUCTS
8.3.1.1 ICE CREAM
8.3.1.2 TOPPINGS
8.3.1.3 YOGURTS
8.3.1.4 PUDDING
8.3.1.5 OTHERS
8.3.2 BAKERY PRODUCTS
8.3.2.1 COOKIES & BISCUITS
8.3.2.2 CAKE & PASTRIES
8.3.2.3 MUFFINS & DONUTS
8.3.2.4 BREADS & ROLLS
8.3.2.5 OTHERS
8.3.3 CONFECTIONERY
8.3.3.1 CHOCOLATE
8.3.3.2 GUMMIES & MARSHMALLOWS
8.3.3.3 HARD CANDIES
8.3.3.4 OTHERS
8.3.4 TABLE-TOP SWEETENER
8.3.5 NUTRITIONAL BARS
8.3.6 BREAKFAST CEREALS
8.3.7 OTHERS
8.4 ORAL CARE
8.4.1.1 TOOTHPASTE
8.4.1.2 ORAL RINSES
8.4.1.3 OTHERS
8.5 PHARMACEUTICALS
8.5.1.1 SYRUPS
8.5.1.2 GRANULATED POWDERS
8.5.1.3 TABLETS
8.5.1.4 OTHERS
8.6 OTHERS
9 EUROPE SUGAR SUBSTITUTES MARKET, BY CATEGORY
9.1 OVERVIEW
9.2 NATURAL
9.3 SYNTHETIC
10 EUROPE SUGAR SUBSTITUTES MARKET, BY GEOGRAPHY
10.1 EUROPE
10.1.1 GERMANY
10.1.2 U.K.
10.1.3 FRANCE
10.1.4 SPAIN
10.1.5 ITALY
10.1.6 DENMARK
10.1.7 NETHERLANDS
10.1.8 SWITZERLAND
10.1.9 POLAND
10.1.10 RUSSIA
10.1.11 SWEDEN
10.1.12 BELGIUM
10.1.13 TURKEY
10.1.14 REST OF EUROPE
11 EUROPE SUGAR SUBSTITUTES MARKET, COMPANY LANDSCAPE
11.1 COMPANY SHARE ANALYSIS: EUROPE
12 SWOT & DBMR ANALYSIS
12.1 DATA BRIDGE MARKET RESEARCH ANALYSIS
13 COMPANY PROFILES
13.1 ADM
13.1.1 COMPANY SNAPSHOT
13.1.2 REVENUE ANALYSIS
13.1.3 COMPANY SHARE ANALYSIS
13.1.4 PRODUCT PORTFOLIO
13.1.5 RECENT DEVELOPMENTS
13.2 CARGILL, INCORPORATED.
13.2.1 COMPANY SNAPSHOT
13.2.2 REVENUE ANALYSIS
13.2.3 COMPANY SHARE ANALYSIS
13.2.4 PRODUCT PORTFOLIO
13.2.5 RECENT DEVELOPMENTS
13.3 INGREDION INCORPORATED
13.3.1 COMPANY SNAPSHOT
13.3.2 REVENUE ANALYSIS
13.3.3 COMPANY SHARE ANALYSIS
13.3.4 PRODUCT PORTFOLIO
13.3.5 RECENT DEVELOPMENTS
13.4 TATE & LYLE
13.4.1 COMPANY SNAPSHOT
13.4.2 REVENUE ANALYSIS
13.4.3 COMPANY SHARE ANALYSIS
13.4.4 PRODUCT PORTFOLIO
13.4.5 RECENT DEVELOPMENTS
13.5 AJINOMOTO HEALTH & NUTRITION NORTH AMERICA, INC.
13.5.1 COMPANY SNAPSHOT
13.5.2 REVENUE ANALYSIS
13.5.3 PRODUCT PORTFOLIO
13.5.4 RECENT DEVELOPMENTS
13.6 ALSIANO
13.6.1 COMPANY SNAPSHOT
13.6.2 PRODUCT PORTFOLIO
13.6.3 RECENT DEVELOPMENTS
13.7 BENEO (A SUBSIDIARY OF SÜDZUCKER AG)
13.7.1 COMPANY SNAPSHOT
13.7.2 REVENUE ANALYSIS
13.7.3 PRODUCT PORTFOLIO
13.7.4 RECENT DEVELOPMENTS
13.8 DUPONT.
13.8.1 COMPANY SNAPSHOT
13.8.2 REVENUE ANALYSIS
13.8.3 PRODUCT PORTFOLIO
13.8.4 RECENT DEVELOPMENTS
13.9 FOODCHEM INTERNATIONAL CORPORATION
13.9.1 COMPANY SNAPSHOT
13.9.2 PRODUCT PORTFOLIO
13.9.3 RECENT DEVELOPMENTS
13.1 HYET SWEET
13.10.1 COMPANY SNAPSHOT
13.10.2 PRODUCT PORTFOLIO
13.10.3 RECENT DEVELOPMENTS
13.11 JK SUCRALOSE INC.
13.11.1 COMPANY SNAPSHOT
13.11.2 PRODUCT PORTFOLIO
13.11.3 RECENT DEVELOPMENT
13.12 MAFCO WORLDWIDE LLC
13.12.1 COMPANY SNAPSHOT
13.12.2 PRODUCT PORTFOLIO
13.12.3 RECENT DEVELOPMENT
13.13 MATSUTANI CHEMICAL INDUSTRY CO., LTD.
13.13.1 COMPANY SNAPSHOT
13.13.2 PRODUCT PORTFOLIO
13.13.3 RECENT DEVELOPMENT
13.14 MITSUI SUGAR CO.,LTD.
13.14.1 COMPANY SNAPSHOT
13.14.2 REVENUE ANALYSIS
13.14.3 PRODUCT PORTFOLIO
13.14.4 RECENT DEVELOPMENT
13.15 NUTRASWEET CO.
13.15.1 COMPANY SNAPSHOT
13.15.2 PRODUCT PORTFOLIO
13.15.3 RECENT DEVELOPMENT
13.16 PURECIRCLE
13.16.1 COMPANY SNAPSHOT
13.16.2 REVENEUE ANALYSIS
13.16.3 PRODUCT PORTFOLIO
13.16.4 RECENT DEVELOPMENTS
13.17 PYURE BRANDS LLC
13.17.1 COMPANY SNAPSHOT
13.17.2 PRODUCT PORTFOLIO
13.17.3 RECENT DEVELOPMENTS
13.18 ROQUETTE FRÈRES
13.18.1 COMPANY SNAPSHOT
13.18.2 PRODUCT PORTFOLIO
13.18.3 RECENT DEVELOPMENTS
13.19 STARTINGLINE S.P.A.
13.19.1 COMPANY SNAPSHOT
13.19.2 PRODUCT PORTFOLIO
13.19.3 RECENT DEVELOPMENT
13.2 ZUCHEM INC.
13.20.1 COMPANY SNAPSHOT
13.20.2 PRODUCT PORTFOLIO
13.20.3 RECENT DEVELOPMENT
14 CONCLUSION
15 QUESTIONNAIRE
16 RELATED REPORTS
Lista de Tablas
TABLE 1 EUROPE SUGAR SUBSTITUTES MARKET, BY TYPE, 2018-2027 (USD MILLION)
TABLE 2 EUROPE HIGH-FRUCTOSE SYRUPS IN SUGAR SUBSTITUTES MARKET, BY REGION, 2018-2027 (USD MILLION)
TABLE 3 EUROPE HIGH-INTENSITY SWEETENERS IN SUGAR SUBSTITUTES MARKET, BY REGION, 2018-2027 (USD MILLION)
TABLE 4 EUROPE HIGH-INTENSITY SWEETENERS IN SUGAR SUBSTITUTES MARKET, BY COMPOSITION, 2018-2027 (USD MILLION)
TABLE 5 EUROPE LOW-INTENSITY SWEETENERS IN SUGAR SUBSTITUTES MARKET, BY REGION, 2018-2027 (USD MILLION)
TABLE 6 EUROPE LOW-INTENSITY SWEETENERS IN SUGAR SUBSTITUTES MARKET, BY COMPOSITION, 2018-2027 (USD MILLION)
TABLE 7 EUROPE SUGAR SUBSTITUTES MARKET, BY FORM, 2018-2027 (USD MILLION)
TABLE 8 EUROPE CRYSTALLIZED FORM IN SUGAR SUBSTITUTES MARKET, BY REGION, 2018-2027 (USD MILLION)
TABLE 9 EUROPE LIQUID FORM IN SUGAR SUBSTITUTES MARKET, BY REGION, 2018-2027 (USD MILLION)
TABLE 10 EUROPE POWDER FORM IN SUGAR SUBSTITUTES MARKET, BY REGION, 2018-2027 (USD MILLION)
TABLE 11 EUROPE SUGAR SUBSTITUTES MARKET, BY APPLICATION, 2018-2027 (USD MILLION)
TABLE 12 EUROPE BEVERAGES APPLICATION IN SUGAR SUBSTITUTES MARKET, BY REGION, 2018-2027 (USD MILLION)
TABLE 13 EUROPE BEVERAGES IN SUGAR SUBSTITUTES MARKET, BY APPLICATION, 2018-2027 (USD MILLION)
TABLE 14 EUROPE POWDERED BEVERAGES IN SUGAR SUBSTITUTES MARKET, BY APPLICATION, 2018-2027 (USD MILLION)
TABLE 15 EUROPE FOOD PRODUCTS APPLICATION IN SUGAR SUBSTITUTES MARKET, BY REGION, 2018-2027 (USD MILLION)
TABLE 16 EUROPE FOOD PRODUCTS IN SUGAR SUBSTITUTES MARKET, BY APPLICATION, 2018-2027 (USD MILLION)
TABLE 17 EUROPE DAIRY PRODUCTS IN SUGAR SUBSTITUTES MARKET, BY APPLICATION, 2018-2027 (USD MILLION)
TABLE 18 EUROPE BAKERY PRODUCTS IN SUGAR SUBSTITUTES MARKET, BY APPLICATION, 2018-2027 (USD MILLION)
TABLE 19 EUROPE CONFECTIONERY IN SUGAR SUBSTITUTES MARKET, BY APPLICATION, 2018-2027 (USD MILLION)
TABLE 20 EUROPE ORAL CARE APPLICATION IN SUGAR SUBSTITUTES MARKET, BY REGION, 2018-2027 (USD MILLION)
TABLE 21 EUROPE ORAL CARE IN SUGAR SUBSTITUTES MARKET, BY APPLICATION, 2018-2027 (USD MILLION)
TABLE 22 EUROPE PHARMACEUTICALS APPLICATION IN SUGAR SUBSTITUTES MARKET, BY REGION, 2018-2027 (USD MILLION)
TABLE 23 EUROPE PHARMACEUTICALS IN SUGAR SUBSTITUTES MARKET, BY APPLICATION, 2018-2027 (USD MILLION)
TABLE 24 EUROPE OTHERS APPLICATION IN SUGAR SUBSTITUTES MARKET, BY REGION, 2018-2027 (USD MILLION)
TABLE 25 EUROPE SUGAR SUBSTITUTES MARKET, BY CATEGORY, 2018-2027 (USD MILLION)
TABLE 26 EUROPE NATURAL CATGORY IN SUGAR SUBSTITUTES MARKET, BY REGION, 2018-2027 (USD MILLION)
TABLE 27 EUROPE SYNTHETIC CATEGORY IN SUGAR SUBSTITUTES MARKET, BY REGION, 2018-2027 (USD MILLION)
TABLE 28 EUROPE SUGAR SUBSTITUTES MARKET, BY COUNTRY, 2018-2027 (USD MILLION)
TABLE 29 EUROPE SUGAR SUBSTITUTES MARKET, BY TYPE, 2018-2027 (USD MILLION)
TABLE 30 EUROPE HIGH-INTENSITY SWEETENERS IN SUGAR SUBSTITUTES MARKET, BY COMPOSITION, 2018-2027 (USD MILLION)
TABLE 31 EUROPE LOW-INTENSITY SWEETENERS IN SUGAR SUBSTITUTES MARKET, BY COMPOSITION, 2018-2027 (USD MILLION)
TABLE 32 EUROPE SUGAR SUBSTITUTES MARKET, BY FORM, 2018-2027 (USD MILLION)
TABLE 33 EUROPE SUGAR SUBSTITUTES MARKET, BY CATEGORY, 2018-2027 (USD MILLION)
TABLE 34 EUROPE SUGAR SUBSTITUTES MARKET, BY APPLICATION, 2018-2027 (USD MILLION)
TABLE 35 EUROPE BEVERAGES IN SUGAR SUBSTITUTES MARKET, BY APPLICATION, 2018-2027 (USD MILLION)
TABLE 36 EUROPE POWDERED BEVERAGES IN SUGAR SUBSTITUTES MARKET, BY APPLICATION, 2018-2027 (USD MILLION)
TABLE 37 EUROPE FOOD PRODUCTS IN SUGAR SUBSTITUTES MARKET, BY APPLICATION, 2018-2027 (USD MILLION)
TABLE 38 EUROPE BAKERY PRODUCTS IN SUGAR SUBSTITUTES MARKET, BY APPLICATION, 2018-2027 (USD MILLION)
TABLE 39 EUROPE CONFECTIONERY IN SUGAR SUBSTITUTES MARKET, BY APPLICATION, 2018-2027 (USD MILLION)
TABLE 40 EUROPE DAIRY PRODUCTS IN SUGAR SUBSTITUTES MARKET, BY APPLICATION, 2018-2027 (USD MILLION)
TABLE 41 EUROPE ORAL CARE IN SUGAR SUBSTITUTES MARKET, BY APPLICATION, 2018-2027 (USD MILLION)
TABLE 42 EUROPE PHARMACEUTICALS IN SUGAR SUBSTITUTES MARKET, BY APPLICATION, 2018-2027 (USD MILLION)
TABLE 43 GERMANY SUGAR SUBSTITUTES MARKET, BY TYPE, 2018-2027 (USD MILLION)
TABLE 44 GERMANY HIGH-INTENSITY SWEETENERS IN SUGAR SUBSTITUTES MARKET, BY COMPOSITION, 2018-2027 (USD MILLION)
TABLE 45 GERMANY LOW-INTENSITY SWEETENERS IN SUGAR SUBSTITUTES MARKET, BY COMPOSITION, 2018-2027 (USD MILLION)
TABLE 46 GERMANY SUGAR SUBSTITUTES MARKET, BY FORM, 2018-2027 (USD MILLION)
TABLE 47 GERMANY SUGAR SUBSTITUTES MARKET, BY CATEGORY, 2018-2027 (USD MILLION)
TABLE 48 GERMANY SUGAR SUBSTITUTES MARKET, BY APPLICATION, 2018-2027 (USD MILLION)
TABLE 49 GERMANY BEVERAGES IN SUGAR SUBSTITUTES MARKET, BY APPLICATION, 2018-2027 (USD MILLION)
TABLE 50 GERMANY POWDERED BEVERAGES IN SUGAR SUBSTITUTES MARKET, BY APPLICATION, 2018-2027 (USD MILLION)
TABLE 51 GERMANY FOOD PRODUCTS IN SUGAR SUBSTITUTES MARKET, BY APPLICATION, 2018-2027 (USD MILLION)
TABLE 52 GERMANY BAKERY PRODUCTS IN SUGAR SUBSTITUTES MARKET, BY APPLICATION, 2018-2027 (USD MILLION)
TABLE 53 GERMANY CONFECTIONERY IN SUGAR SUBSTITUTES MARKET, BY APPLICATION, 2018-2027 (USD MILLION)
TABLE 54 GERMANY DAIRY PRODUCTS IN SUGAR SUBSTITUTES MARKET, BY APPLICATION, 2018-2027 (USD MILLION)
TABLE 55 GERMANY ORAL CARE IN SUGAR SUBSTITUTES MARKET, BY APPLICATION, 2018-2027 (USD MILLION)
TABLE 56 GERMANY PHARMACEUTICALS IN SUGAR SUBSTITUTES MARKET, BY APPLICATION, 2018-2027 (USD MILLION)
TABLE 57 U.K. SUGAR SUBSTITUTES MARKET, BY TYPE, 2018-2027 (USD MILLION)
TABLE 58 U.K. HIGH-INTENSITY SWEETENERS IN SUGAR SUBSTITUTES MARKET, BY COMPOSITION, 2018-2027 (USD MILLION)
TABLE 59 U.K. LOW-INTENSITY SWEETENERS IN SUGAR SUBSTITUTES MARKET, BY COMPOSITION, 2018-2027 (USD MILLION)
TABLE 60 U.K. SUGAR SUBSTITUTES MARKET, BY FORM, 2018-2027 (USD MILLION)
TABLE 61 U.K. SUGAR SUBSTITUTES MARKET, BY CATEGORY, 2018-2027 (USD MILLION)
TABLE 62 U.K. SUGAR SUBSTITUTES MARKET, BY APPLICATION, 2018-2027 (USD MILLION)
TABLE 63 U.K. BEVERAGES IN SUGAR SUBSTITUTES MARKET, BY APPLICATION, 2018-2027 (USD MILLION)
TABLE 64 U.K. POWDERED BEVERAGES IN SUGAR SUBSTITUTES MARKET, BY APPLICATION, 2018-2027 (USD MILLION)
TABLE 65 U.K. FOOD PRODUCTS IN SUGAR SUBSTITUTES MARKET, BY APPLICATION, 2018-2027 (USD MILLION)
TABLE 66 U.K. BAKERY PRODUCTS IN SUGAR SUBSTITUTES MARKET, BY APPLICATION, 2018-2027 (USD MILLION)
TABLE 67 U.K. CONFECTIONERY IN SUGAR SUBSTITUTES MARKET, BY APPLICATION, 2018-2027 (USD MILLION)
TABLE 68 U.K. DAIRY PRODUCTS IN SUGAR SUBSTITUTES MARKET, BY APPLICATION, 2018-2027 (USD MILLION)
TABLE 69 U.K. ORAL CARE IN SUGAR SUBSTITUTES MARKET, BY APPLICATION, 2018-2027 (USD MILLION)
TABLE 70 U.K. PHARMACEUTICALS IN SUGAR SUBSTITUTES MARKET, BY APPLICATION, 2018-2027 (USD MILLION)
TABLE 71 FRANCE SUGAR SUBSTITUTES MARKET, BY TYPE, 2018-2027 (USD MILLION)
TABLE 72 FRANCE HIGH-INTENSITY SWEETENERS IN SUGAR SUBSTITUTES MARKET, BY COMPOSITION, 2018-2027 (USD MILLION)
TABLE 73 FRANCE LOW-INTENSITY SWEETENERS IN SUGAR SUBSTITUTES MARKET, BY COMPOSITION, 2018-2027 (USD MILLION)
TABLE 74 FRANCE SUGAR SUBSTITUTES MARKET, BY FORM, 2018-2027 (USD MILLION)
TABLE 75 FRANCE SUGAR SUBSTITUTES MARKET, BY CATEGORY, 2018-2027 (USD MILLION)
TABLE 76 FRANCE SUGAR SUBSTITUTES MARKET, BY APPLICATION, 2018-2027 (USD MILLION)
TABLE 77 FRANCE BEVERAGES IN SUGAR SUBSTITUTES MARKET, BY APPLICATION, 2018-2027 (USD MILLION)
TABLE 78 FRANCE POWDERED BEVERAGES IN SUGAR SUBSTITUTES MARKET, BY APPLICATION, 2018-2027 (USD MILLION)
TABLE 79 FRANCE FOOD PRODUCTS IN SUGAR SUBSTITUTES MARKET, BY APPLICATION, 2018-2027 (USD MILLION)
TABLE 80 FRANCE BAKERY PRODUCTS IN SUGAR SUBSTITUTES MARKET, BY APPLICATION, 2018-2027 (USD MILLION)
TABLE 81 FRANCE CONFECTIONERY IN SUGAR SUBSTITUTES MARKET, BY APPLICATION, 2018-2027 (USD MILLION)
TABLE 82 FRANCE DAIRY PRODUCTS IN SUGAR SUBSTITUTES MARKET, BY APPLICATION, 2018-2027 (USD MILLION)
TABLE 83 FRANCE ORAL CARE IN SUGAR SUBSTITUTES MARKET, BY APPLICATION, 2018-2027 (USD MILLION)
TABLE 84 FRANCE PHARMACEUTICALS IN SUGAR SUBSTITUTES MARKET, BY APPLICATION, 2018-2027 (USD MILLION)
TABLE 85 SPAIN SUGAR SUBSTITUTES MARKET, BY TYPE, 2018-2027 (USD MILLION)
TABLE 86 SPAIN HIGH-INTENSITY SWEETENERS IN SUGAR SUBSTITUTES MARKET, BY COMPOSITION, 2018-2027 (USD MILLION)
TABLE 87 SPAIN LOW-INTENSITY SWEETENERS IN SUGAR SUBSTITUTES MARKET, BY COMPOSITION, 2018-2027 (USD MILLION)
TABLE 88 SPAIN SUGAR SUBSTITUTES MARKET, BY FORM, 2018-2027 (USD MILLION)
TABLE 89 SPAIN SUGAR SUBSTITUTES MARKET, BY CATEGORY, 2018-2027 (USD MILLION)
TABLE 90 SPAIN SUGAR SUBSTITUTES MARKET, BY APPLICATION, 2018-2027 (USD MILLION)
TABLE 91 SPAIN BEVERAGES IN SUGAR SUBSTITUTES MARKET, BY APPLICATION, 2018-2027 (USD MILLION)
TABLE 92 SPAIN POWDERED BEVERAGES IN SUGAR SUBSTITUTES MARKET, BY APPLICATION, 2018-2027 (USD MILLION)
TABLE 93 SPAIN FOOD PRODUCTS IN SUGAR SUBSTITUTES MARKET, BY APPLICATION, 2018-2027 (USD MILLION)
TABLE 94 SPAIN BAKERY PRODUCTS IN SUGAR SUBSTITUTES MARKET, BY APPLICATION, 2018-2027 (USD MILLION)
TABLE 95 SPAIN CONFECTIONERY IN SUGAR SUBSTITUTES MARKET, BY APPLICATION, 2018-2027 (USD MILLION)
TABLE 96 SPAIN DAIRY PRODUCTS IN SUGAR SUBSTITUTES MARKET, BY APPLICATION, 2018-2027 (USD MILLION)
TABLE 97 SPAIN ORAL CARE IN SUGAR SUBSTITUTES MARKET, BY APPLICATION, 2018-2027 (USD MILLION)
TABLE 98 SPAIN PHARMACEUTICALS IN SUGAR SUBSTITUTES MARKET, BY APPLICATION, 2018-2027 (USD MILLION)
TABLE 99 ITALY SUGAR SUBSTITUTES MARKET, BY TYPE, 2018-2027 (USD MILLION)
TABLE 100 ITALY HIGH-INTENSITY SWEETENERS IN SUGAR SUBSTITUTES MARKET, BY COMPOSITION, 2018-2027 (USD MILLION)
TABLE 101 ITALY LOW-INTENSITY SWEETENERS IN SUGAR SUBSTITUTES MARKET, BY COMPOSITION, 2018-2027 (USD MILLION)
TABLE 102 ITALY SUGAR SUBSTITUTES MARKET, BY FORM, 2018-2027 (USD MILLION)
TABLE 103 ITALY SUGAR SUBSTITUTES MARKET, BY CATEGORY, 2018-2027 (USD MILLION)
TABLE 104 ITALY SUGAR SUBSTITUTES MARKET, BY APPLICATION, 2018-2027 (USD MILLION)
TABLE 105 ITALY BEVERAGES IN SUGAR SUBSTITUTES MARKET, BY APPLICATION, 2018-2027 (USD MILLION)
TABLE 106 ITALY POWDERED BEVERAGES IN SUGAR SUBSTITUTES MARKET, BY APPLICATION, 2018-2027 (USD MILLION)
TABLE 107 ITALY FOOD PRODUCTS IN SUGAR SUBSTITUTES MARKET, BY APPLICATION, 2018-2027 (USD MILLION)
TABLE 108 ITALY BAKERY PRODUCTS IN SUGAR SUBSTITUTES MARKET, BY APPLICATION, 2018-2027 (USD MILLION)
TABLE 109 ITALY CONFECTIONERY IN SUGAR SUBSTITUTES MARKET, BY APPLICATION, 2018-2027 (USD MILLION)
TABLE 110 ITALY DAIRY PRODUCTS IN SUGAR SUBSTITUTES MARKET, BY APPLICATION, 2018-2027 (USD MILLION)
TABLE 111 ITALY ORAL CARE IN SUGAR SUBSTITUTES MARKET, BY APPLICATION, 2018-2027 (USD MILLION)
TABLE 112 ITALY PHARMACEUTICALS IN SUGAR SUBSTITUTES MARKET, BY APPLICATION, 2018-2027 (USD MILLION)
TABLE 113 DENMARK SUGAR SUBSTITUTES MARKET, BY TYPE, 2018-2027 (USD MILLION)
TABLE 114 DENMARK HIGH-INTENSITY SWEETENERS IN SUGAR SUBSTITUTES MARKET, BY COMPOSITION, 2018-2027 (USD MILLION)
TABLE 115 DENMARK LOW-INTENSITY SWEETENERS IN SUGAR SUBSTITUTES MARKET, BY COMPOSITION, 2018-2027 (USD MILLION)
TABLE 116 DENMARK SUGAR SUBSTITUTES MARKET, BY FORM, 2018-2027 (USD MILLION)
TABLE 117 DENMARK SUGAR SUBSTITUTES MARKET, BY CATEGORY, 2018-2027 (USD MILLION)
TABLE 118 DENMARK SUGAR SUBSTITUTES MARKET, BY APPLICATION, 2018-2027 (USD MILLION)
TABLE 119 DENMARK BEVERAGES IN SUGAR SUBSTITUTES MARKET, BY APPLICATION, 2018-2027 (USD MILLION)
TABLE 120 DENMARK POWDERED BEVERAGES IN SUGAR SUBSTITUTES MARKET, BY APPLICATION, 2018-2027 (USD MILLION)
TABLE 121 DENMARK FOOD PRODUCTS IN SUGAR SUBSTITUTES MARKET, BY APPLICATION, 2018-2027 (USD MILLION)
TABLE 122 DENMARK BAKERY PRODUCTS IN SUGAR SUBSTITUTES MARKET, BY APPLICATION, 2018-2027 (USD MILLION)
TABLE 123 DENMARK CONFECTIONERY IN SUGAR SUBSTITUTES MARKET, BY APPLICATION, 2018-2027 (USD MILLION)
TABLE 124 DENMARK DAIRY PRODUCTS IN SUGAR SUBSTITUTES MARKET, BY APPLICATION, 2018-2027 (USD MILLION)
TABLE 125 DENMARK ORAL CARE IN SUGAR SUBSTITUTES MARKET, BY APPLICATION, 2018-2027 (USD MILLION)
TABLE 126 DENMARK PHARMACEUTICALS IN SUGAR SUBSTITUTES MARKET, BY APPLICATION, 2018-2027 (USD MILLION)
TABLE 127 NETHERLANDS SUGAR SUBSTITUTES MARKET, BY TYPE, 2018-2027 (USD MILLION)
TABLE 128 NETHERLANDS HIGH-INTENSITY SWEETENERS IN SUGAR SUBSTITUTES MARKET, BY COMPOSITION, 2018-2027 (USD MILLION)
TABLE 129 NETHERLANDS LOW-INTENSITY SWEETENERS IN SUGAR SUBSTITUTES MARKET, BY COMPOSITION, 2018-2027 (USD MILLION)
TABLE 130 NETHERLANDS SUGAR SUBSTITUTES MARKET, BY FORM, 2018-2027 (USD MILLION)
TABLE 131 NETHERLANDS SUGAR SUBSTITUTES MARKET, BY CATEGORY, 2018-2027 (USD MILLION)
TABLE 132 NETHERLANDS SUGAR SUBSTITUTES MARKET, BY APPLICATION, 2018-2027 (USD MILLION)
TABLE 133 NETHERLANDS BEVERAGES IN SUGAR SUBSTITUTES MARKET, BY APPLICATION, 2018-2027 (USD MILLION)
TABLE 134 NETHERLANDS POWDERED BEVERAGES IN SUGAR SUBSTITUTES MARKET, BY APPLICATION, 2018-2027 (USD MILLION)
TABLE 135 NETHERLANDS FOOD PRODUCTS IN SUGAR SUBSTITUTES MARKET, BY APPLICATION, 2018-2027 (USD MILLION)
TABLE 136 NETHERLANDS BAKERY PRODUCTS IN SUGAR SUBSTITUTES MARKET, BY APPLICATION, 2018-2027 (USD MILLION)
TABLE 137 NETHERLANDS CONFECTIONERY IN SUGAR SUBSTITUTES MARKET, BY APPLICATION, 2018-2027 (USD MILLION)
TABLE 138 NETHERLANDS DAIRY PRODUCTS IN SUGAR SUBSTITUTES MARKET, BY APPLICATION, 2018-2027 (USD MILLION)
TABLE 139 NETHERLANDS ORAL CARE IN SUGAR SUBSTITUTES MARKET, BY APPLICATION, 2018-2027 (USD MILLION)
TABLE 140 NETHERLANDS PHARMACEUTICALS IN SUGAR SUBSTITUTES MARKET, BY APPLICATION, 2018-2027 (USD MILLION)
TABLE 141 SWITZERLAND SUGAR SUBSTITUTES MARKET, BY TYPE, 2018-2027 (USD MILLION)
TABLE 142 SWITZERLAND HIGH-INTENSITY SWEETENERS IN SUGAR SUBSTITUTES MARKET, BY COMPOSITION, 2018-2027 (USD MILLION)
TABLE 143 SWITZERLAND LOW-INTENSITY SWEETENERS IN SUGAR SUBSTITUTES MARKET, BY COMPOSITION, 2018-2027 (USD MILLION)
TABLE 144 SWITZERLAND SUGAR SUBSTITUTES MARKET, BY FORM, 2018-2027 (USD MILLION)
TABLE 145 SWITZERLAND SUGAR SUBSTITUTES MARKET, BY CATEGORY, 2018-2027 (USD MILLION)
TABLE 146 SWITZERLAND SUGAR SUBSTITUTES MARKET, BY APPLICATION, 2018-2027 (USD MILLION)
TABLE 147 SWITZERLAND BEVERAGES IN SUGAR SUBSTITUTES MARKET, BY APPLICATION, 2018-2027 (USD MILLION)
TABLE 148 SWITZERLAND POWDERED BEVERAGES IN SUGAR SUBSTITUTES MARKET, BY APPLICATION, 2018-2027 (USD MILLION)
TABLE 149 SWITZERLAND FOOD PRODUCTS IN SUGAR SUBSTITUTES MARKET, BY APPLICATION, 2018-2027 (USD MILLION)
TABLE 150 SWITZERLAND BAKERY PRODUCTS IN SUGAR SUBSTITUTES MARKET, BY APPLICATION, 2018-2027 (USD MILLION)
TABLE 151 SWITZERLAND CONFECTIONERY IN SUGAR SUBSTITUTES MARKET, BY APPLICATION, 2018-2027 (USD MILLION)
TABLE 152 SWITZERLAND DAIRY PRODUCTS IN SUGAR SUBSTITUTES MARKET, BY APPLICATION, 2018-2027 (USD MILLION)
TABLE 153 SWITZERLAND ORAL CARE IN SUGAR SUBSTITUTES MARKET, BY APPLICATION, 2018-2027 (USD MILLION)
TABLE 154 SWITZERLAND PHARMACEUTICALS IN SUGAR SUBSTITUTES MARKET, BY APPLICATION, 2018-2027 (USD MILLION)
TABLE 155 POLAND SUGAR SUBSTITUTES MARKET, BY TYPE, 2018-2027 (USD MILLION)
TABLE 156 POLAND HIGH-INTENSITY SWEETENERS IN SUGAR SUBSTITUTES MARKET, BY COMPOSITION, 2018-2027 (USD MILLION)
TABLE 157 POLAND LOW-INTENSITY SWEETENERS IN SUGAR SUBSTITUTES MARKET, BY COMPOSITION, 2018-2027 (USD MILLION)
TABLE 158 POLAND SUGAR SUBSTITUTES MARKET, BY FORM, 2018-2027 (USD MILLION)
TABLE 159 POLAND SUGAR SUBSTITUTES MARKET, BY CATEGORY, 2018-2027 (USD MILLION)
TABLE 160 POLAND SUGAR SUBSTITUTES MARKET, BY APPLICATION, 2018-2027 (USD MILLION)
TABLE 161 POLAND BEVERAGES IN SUGAR SUBSTITUTES MARKET, BY APPLICATION, 2018-2027 (USD MILLION)
TABLE 162 POLAND POWDERED BEVERAGES IN SUGAR SUBSTITUTES MARKET, BY APPLICATION, 2018-2027 (USD MILLION)
TABLE 163 POLAND FOOD PRODUCTS IN SUGAR SUBSTITUTES MARKET, BY APPLICATION, 2018-2027 (USD MILLION)
TABLE 164 POLAND BAKERY PRODUCTS IN SUGAR SUBSTITUTES MARKET, BY APPLICATION, 2018-2027 (USD MILLION)
TABLE 165 POLAND CONFECTIONERY IN SUGAR SUBSTITUTES MARKET, BY APPLICATION, 2018-2027 (USD MILLION)
TABLE 166 POLAND DAIRY PRODUCTS IN SUGAR SUBSTITUTES MARKET, BY APPLICATION, 2018-2027 (USD MILLION)
TABLE 167 POLAND ORAL CARE IN SUGAR SUBSTITUTES MARKET, BY APPLICATION, 2018-2027 (USD MILLION)
TABLE 168 POLAND PHARMACEUTICALS IN SUGAR SUBSTITUTES MARKET, BY APPLICATION, 2018-2027 (USD MILLION)
TABLE 169 RUSSIA SUGAR SUBSTITUTES MARKET, BY TYPE, 2018-2027 (USD MILLION)
TABLE 170 RUSSIA HIGH-INTENSITY SWEETENERS IN SUGAR SUBSTITUTES MARKET, BY COMPOSITION, 2018-2027 (USD MILLION)
TABLE 171 RUSSIA LOW-INTENSITY SWEETENERS IN SUGAR SUBSTITUTES MARKET, BY COMPOSITION, 2018-2027 (USD MILLION)
TABLE 172 RUSSIA SUGAR SUBSTITUTES MARKET, BY FORM, 2018-2027 (USD MILLION)
TABLE 173 RUSSIA SUGAR SUBSTITUTES MARKET, BY CATEGORY, 2018-2027 (USD MILLION)
TABLE 174 RUSSIA SUGAR SUBSTITUTES MARKET, BY APPLICATION, 2018-2027 (USD MILLION)
TABLE 175 RUSSIA BEVERAGES IN SUGAR SUBSTITUTES MARKET, BY APPLICATION, 2018-2027 (USD MILLION)
TABLE 176 RUSSIA POWDERED BEVERAGES IN SUGAR SUBSTITUTES MARKET, BY APPLICATION, 2018-2027 (USD MILLION)
TABLE 177 RUSSIA FOOD PRODUCTS IN SUGAR SUBSTITUTES MARKET, BY APPLICATION, 2018-2027 (USD MILLION)
TABLE 178 RUSSIA BAKERY PRODUCTS IN SUGAR SUBSTITUTES MARKET, BY APPLICATION, 2018-2027 (USD MILLION)
TABLE 179 RUSSIA CONFECTIONERY IN SUGAR SUBSTITUTES MARKET, BY APPLICATION, 2018-2027 (USD MILLION)
TABLE 180 RUSSIA DAIRY PRODUCTS IN SUGAR SUBSTITUTES MARKET, BY APPLICATION, 2018-2027 (USD MILLION)
TABLE 181 RUSSIA ORAL CARE IN SUGAR SUBSTITUTES MARKET, BY APPLICATION, 2018-2027 (USD MILLION)
TABLE 182 RUSSIA PHARMACEUTICALS IN SUGAR SUBSTITUTES MARKET, BY APPLICATION, 2018-2027 (USD MILLION)
TABLE 183 SWEDEN SUGAR SUBSTITUTES MARKET, BY TYPE, 2018-2027 (USD MILLION)
TABLE 184 SWEDEN HIGH-INTENSITY SWEETENERS IN SUGAR SUBSTITUTES MARKET, BY COMPOSITION, 2018-2027 (USD MILLION)
TABLE 185 SWEDEN LOW-INTENSITY SWEETENERS IN SUGAR SUBSTITUTES MARKET, BY COMPOSITION, 2018-2027 (USD MILLION)
TABLE 186 SWEDEN SUGAR SUBSTITUTES MARKET, BY FORM, 2018-2027 (USD MILLION)
TABLE 187 SWEDEN SUGAR SUBSTITUTES MARKET, BY CATEGORY, 2018-2027 (USD MILLION)
TABLE 188 SWEDEN SUGAR SUBSTITUTES MARKET, BY APPLICATION, 2018-2027 (USD MILLION)
TABLE 189 SWEDEN BEVERAGES IN SUGAR SUBSTITUTES MARKET, BY APPLICATION, 2018-2027 (USD MILLION)
TABLE 190 SWEDEN POWDERED BEVERAGES IN SUGAR SUBSTITUTES MARKET, BY APPLICATION, 2018-2027 (USD MILLION)
TABLE 191 SWEDEN FOOD PRODUCTS IN SUGAR SUBSTITUTES MARKET, BY APPLICATION, 2018-2027 (USD MILLION)
TABLE 192 SWEDEN BAKERY PRODUCTS IN SUGAR SUBSTITUTES MARKET, BY APPLICATION, 2018-2027 (USD MILLION)
TABLE 193 SWEDEN CONFECTIONERY IN SUGAR SUBSTITUTES MARKET, BY APPLICATION, 2018-2027 (USD MILLION)
TABLE 194 SWEDEN DAIRY PRODUCTS IN SUGAR SUBSTITUTES MARKET, BY APPLICATION, 2018-2027 (USD MILLION)
TABLE 195 SWEDEN ORAL CARE IN SUGAR SUBSTITUTES MARKET, BY APPLICATION, 2018-2027 (USD MILLION)
TABLE 196 SWEDEN PHARMACEUTICALS IN SUGAR SUBSTITUTES MARKET, BY APPLICATION, 2018-2027 (USD MILLION)
TABLE 197 BELGIUM SUGAR SUBSTITUTES MARKET, BY TYPE, 2018-2027 (USD MILLION)
TABLE 198 BELGIUM HIGH-INTENSITY SWEETENERS IN SUGAR SUBSTITUTES MARKET, BY COMPOSITION, 2018-2027 (USD MILLION)
TABLE 199 BELGIUM LOW-INTENSITY SWEETENERS IN SUGAR SUBSTITUTES MARKET, BY COMPOSITION, 2018-2027 (USD MILLION)
TABLE 200 BELGIUM SUGAR SUBSTITUTES MARKET, BY FORM, 2018-2027 (USD MILLION)
TABLE 201 BELGIUM SUGAR SUBSTITUTES MARKET, BY CATEGORY, 2018-2027 (USD MILLION)
TABLE 202 BELGIUM SUGAR SUBSTITUTES MARKET, BY APPLICATION, 2018-2027 (USD MILLION)
TABLE 203 BELGIUM BEVERAGES IN SUGAR SUBSTITUTES MARKET, BY APPLICATION, 2018-2027 (USD MILLION)
TABLE 204 BELGIUM POWDERED BEVERAGES IN SUGAR SUBSTITUTES MARKET, BY APPLICATION, 2018-2027 (USD MILLION)
TABLE 205 BELGIUM FOOD PRODUCTS IN SUGAR SUBSTITUTES MARKET, BY APPLICATION, 2018-2027 (USD MILLION)
TABLE 206 BELGIUM BAKERY PRODUCTS IN SUGAR SUBSTITUTES MARKET, BY APPLICATION, 2018-2027 (USD MILLION)
TABLE 207 BELGIUM CONFECTIONERY IN SUGAR SUBSTITUTES MARKET, BY APPLICATION, 2018-2027 (USD MILLION)
TABLE 208 BELGIUM DAIRY PRODUCTS IN SUGAR SUBSTITUTES MARKET, BY APPLICATION, 2018-2027 (USD MILLION)
TABLE 209 BELGIUM ORAL CARE IN SUGAR SUBSTITUTES MARKET, BY APPLICATION, 2018-2027 (USD MILLION)
TABLE 210 BELGIUM PHARMACEUTICALS IN SUGAR SUBSTITUTES MARKET, BY APPLICATION, 2018-2027 (USD MILLION)
TABLE 211 TURKEY SUGAR SUBSTITUTES MARKET, BY TYPE, 2018-2027 (USD MILLION)
TABLE 212 TURKEY HIGH-INTENSITY SWEETENERS IN SUGAR SUBSTITUTES MARKET, BY COMPOSITION, 2018-2027 (USD MILLION)
TABLE 213 TURKEY LOW-INTENSITY SWEETENERS IN SUGAR SUBSTITUTES MARKET, BY COMPOSITION, 2018-2027 (USD MILLION)
TABLE 214 TURKEY SUGAR SUBSTITUTES MARKET, BY FORM, 2018-2027 (USD MILLION)
TABLE 215 TURKEY SUGAR SUBSTITUTES MARKET, BY CATEGORY, 2018-2027 (USD MILLION)
TABLE 216 TURKEY SUGAR SUBSTITUTES MARKET, BY APPLICATION, 2018-2027 (USD MILLION)
TABLE 217 TURKEY BEVERAGES IN SUGAR SUBSTITUTES MARKET, BY APPLICATION, 2018-2027 (USD MILLION)
TABLE 218 TURKEY POWDERED BEVERAGES IN SUGAR SUBSTITUTES MARKET, BY APPLICATION, 2018-2027 (USD MILLION)
TABLE 219 TURKEY FOOD PRODUCTS IN SUGAR SUBSTITUTES MARKET, BY APPLICATION, 2018-2027 (USD MILLION)
TABLE 220 TURKEY BAKERY PRODUCTS IN SUGAR SUBSTITUTES MARKET, BY APPLICATION, 2018-2027 (USD MILLION)
TABLE 221 TURKEY CONFECTIONERY IN SUGAR SUBSTITUTES MARKET, BY APPLICATION, 2018-2027 (USD MILLION)
TABLE 222 TURKEY DAIRY PRODUCTS IN SUGAR SUBSTITUTES MARKET, BY APPLICATION, 2018-2027 (USD MILLION)
TABLE 223 TURKEY ORAL CARE IN SUGAR SUBSTITUTES MARKET, BY APPLICATION, 2018-2027 (USD MILLION)
TABLE 224 TURKEY PHARMACEUTICALS IN SUGAR SUBSTITUTES MARKET, BY APPLICATION, 2018-2027 (USD MILLION)
TABLE 225 REST OF EUROPE SUGAR SUBSTITUTES MARKET, BY TYPE, 2018-2027 (USD MILLION)
Lista de figuras
FIGURE 1 EUROPE SUGAR SUBSTITUTES MARKET: SEGMENTATION
FIGURE 2 EUROPE SUGAR SUBSTITUTES MARKET: DATA TRIANGULATION
FIGURE 3 EUROPE SUGAR SUBSTITUTES MARKET: DROC ANALYSIS
FIGURE 4 EUROPE SUGAR SUBSTITUTES MARKET: EUROPE VS REGIONAL MARKET ANALYSIS
FIGURE 5 EUROPE SUGAR SUBSTITUTES MARKET: COMPANY RESEARCH ANALYSIS
FIGURE 6 EUROPE SUGAR SUBSTITUTES MARKET: INTERVIEW DEMOGRAPHICS
FIGURE 7 EUROPE SUGAR SUBSTITUTES MARKET: DBMR MARKET POSITION GRID
FIGURE 8 EUROPE SUGAR SUBSTITUTES MARKET: VENDOR SHARE ANALYSIS
FIGURE 9 EUROPE SUGAR SUBSTITUTES MARKET: MARKET APPLICATION COVERAGE GRID
FIGURE 10 DRIVERS, RESTRAINTS, OPPORTUNITIES AND CHALLENGES OF EUROPE SUGAR SUBSTITUTES MARKET
FIGURE 11 EUROPE SUGAR SUBSTITUTES MARKET: SEGMENTATION
FIGURE 12 GROWING NUMBER OF OBESITY & DIABETIC POPULATION AND RISING TREND OF HEALTHY LIFESTYLE AND HEALTHY PRODUCTS ARE EXPECTED TO DRIVE THE EUROPE SUGAR SUBSTITUTES MARKET IN THE FORECAST PERIOD OF 2020 TO 2027
FIGURE 13 HIGH-FRUCTOSE SYRUPS IS EXPECTED TO ACCOUNT FOR THE LARGEST SHARE OF EUROPE SUGAR SUBSTITUTES MARKET IN 2020 & 2027
FIGURE 14 EUROPE SUGAR SUBSTITUTES MARKET: BY TYPE, 2019
FIGURE 15 EUROPE SUGAR SUBSTITUTES MARKET: BY FORM, 2019
FIGURE 16 EUROPE SUGAR SUBSTITUTES MARKET: BY APPLICATION, 2019
FIGURE 17 EUROPE SUGAR SUBSTITUTES MARKET: BY CATEGORY, 2019
FIGURE 18 EUROPE SUGAR SUBSTITUTES MARKET: SNAPSHOT (2019)
FIGURE 19 EUROPE SUGAR SUBSTITUTES MARKET: BY COUNTRY (2019)
FIGURE 20 EUROPE SUGAR SUBSTITUTES MARKET: BY COUNTRY (2020 & 2027)
FIGURE 21 EUROPE SUGAR SUBSTITUTES MARKET: BY COUNTRY (2019 & 2027)
FIGURE 22 EUROPE SUGAR SUBSTITUTES MARKET: BY TYPE (2020-2027)
FIGURE 23 EUROPE SUGAR SUBSTITUTES MARKET: COMPANY SHARE 2019 (%)
Metodología de investigación
La recopilación de datos y el análisis del año base se realizan utilizando módulos de recopilación de datos con muestras de gran tamaño. La etapa incluye la obtención de información de mercado o datos relacionados a través de varias fuentes y estrategias. Incluye el examen y la planificación de todos los datos adquiridos del pasado con antelación. Asimismo, abarca el examen de las inconsistencias de información observadas en diferentes fuentes de información. Los datos de mercado se analizan y estiman utilizando modelos estadísticos y coherentes de mercado. Además, el análisis de la participación de mercado y el análisis de tendencias clave son los principales factores de éxito en el informe de mercado. Para obtener más información, solicite una llamada de un analista o envíe su consulta.
La metodología de investigación clave utilizada por el equipo de investigación de DBMR es la triangulación de datos, que implica la extracción de datos, el análisis del impacto de las variables de datos en el mercado y la validación primaria (experto en la industria). Los modelos de datos incluyen cuadrícula de posicionamiento de proveedores, análisis de línea de tiempo de mercado, descripción general y guía del mercado, cuadrícula de posicionamiento de la empresa, análisis de patentes, análisis de precios, análisis de participación de mercado de la empresa, estándares de medición, análisis global versus regional y de participación de proveedores. Para obtener más información sobre la metodología de investigación, envíe una consulta para hablar con nuestros expertos de la industria.
Personalización disponible
Data Bridge Market Research es líder en investigación formativa avanzada. Nos enorgullecemos de brindar servicios a nuestros clientes existentes y nuevos con datos y análisis que coinciden y se adaptan a sus objetivos. El informe se puede personalizar para incluir análisis de tendencias de precios de marcas objetivo, comprensión del mercado de países adicionales (solicite la lista de países), datos de resultados de ensayos clínicos, revisión de literatura, análisis de mercado renovado y base de productos. El análisis de mercado de competidores objetivo se puede analizar desde análisis basados en tecnología hasta estrategias de cartera de mercado. Podemos agregar tantos competidores sobre los que necesite datos en el formato y estilo de datos que esté buscando. Nuestro equipo de analistas también puede proporcionarle datos en archivos de Excel sin procesar, tablas dinámicas (libro de datos) o puede ayudarlo a crear presentaciones a partir de los conjuntos de datos disponibles en el informe.

