
>Mercado de embalajes de papel y cartón de Asia-Pacífico, por tipo (pegatinas, bolsas de la compra, revestimiento, embalaje, invitaciones/sobres/papel de notas, etiquetas, cubiertas, catálogos, impresión digital), producto ( vasos de papel , cartones de papel kraft, cartón para cajas, cajas plegables y estuches, bolsas de papel, otros), propiedad (coloreado, natural, recubierto, perlado, textura, reciclado, algodón, otros), peso (70 g/m2 a 100 g/m2, 101 g/m2 a 150 g/m2, 151 g/m2 a 200 g/m2, 201 g/m2 a 250 g/m2, más de 250 g/m2), usuario final (cuidado personal y cosméticos , alimentos y bebidas, atención médica, bienes de consumo, educación y papelería, otros), país (China, Japón, India, Corea del Sur, Indonesia, Australia y Nueva Zelanda, Tailandia, Taiwán, Malasia, Filipinas, Hong Kong, etc.). Kong, Singapur, resto de Asia-Pacífico), tendencias de la industria y pronóstico hasta 2029
Análisis y perspectivas del mercado : mercado de envases de papel y cartón de Asia y el Pacífico
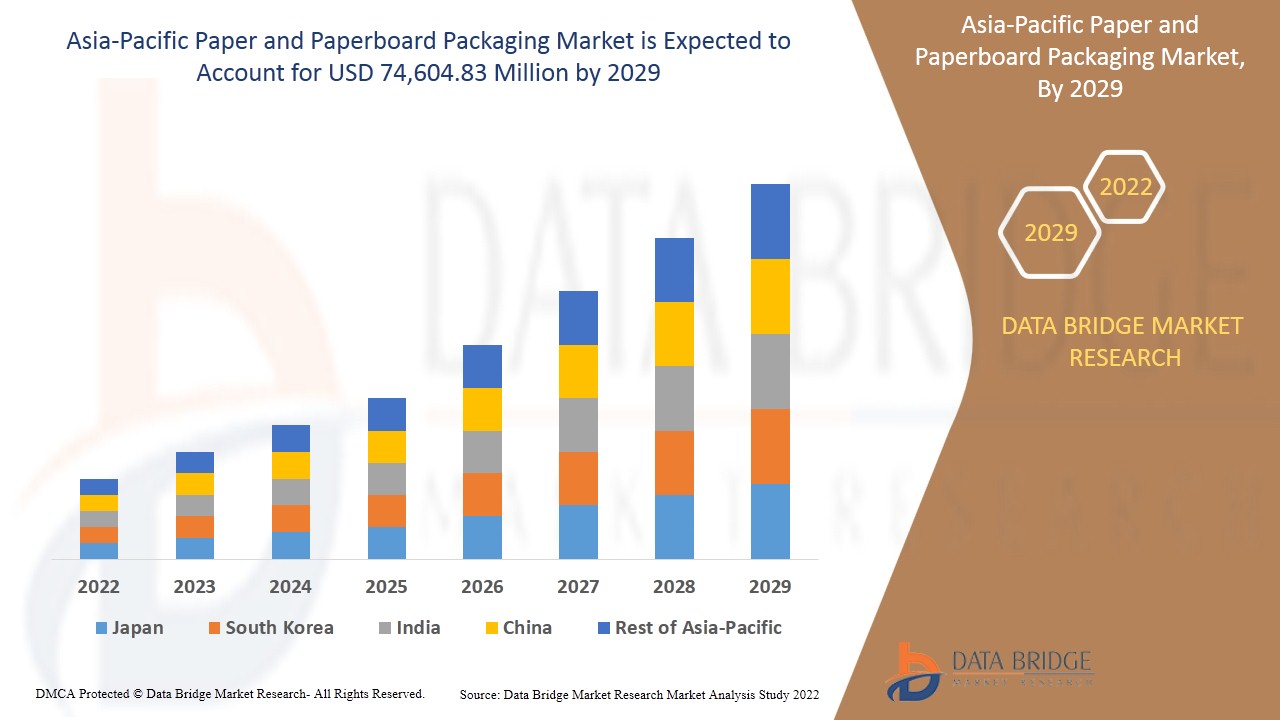
Se espera que el mercado de envases de papel y cartón de Asia-Pacífico gane crecimiento de mercado en el período de pronóstico de 2022 a 2029. Data Bridge Market Research analiza que el mercado está creciendo con una CAGR del 5,9% en el período de pronóstico de 2022 a 2029 y se espera que alcance los USD 74.604,83 millones para 2029.
Los envases y productos a base de papel, como cartón, cartulina, sacos de envío y bolsas de papel, se fabrican a partir de recursos renovables (fibra de papel reciclada y árboles) que se replantan para garantizar un suministro sostenible. Los materiales a base de papel incluyen papel de periódico; papeles de oficina, de impresión, finos y sensibles a la presión; servilletas de papel, toallas y papel higiénico; bolsas kraft, papeles de construcción y otros papeles kraft industriales; cartón, envases para líquidos, cartón para contenedores, envases corrugados y de fibra sólida, incluidos el cartón para revestimiento y el medio corrugado; y tipos relacionados de productos celulósicos que contienen principalmente, por peso o volumen, materiales celulósicos. En el mercado se comercializan numerosos tipos de productos de papel y cartón, como vasos de papel, vasos de papel fríos, cartones de papel kraft, cartones para cajas, cajas y estuches plegables, bolsas de papel y otros. Los productos a base de papel kraft tienen una gran demanda entre los consumidores porque tienen una alta elasticidad y resistencia al desgarro.
Los principales factores que impulsan el crecimiento del mercado de envases de papel y cartón son la creciente demanda de cajas de cartón para envases por parte de la industria de la salud y la creciente conciencia sobre los materiales de envasado sostenibles y la adopción de envases ecológicos . Las sólidas iniciativas de reciclaje de papel en varios países están creando oportunidades para el crecimiento del mercado. La creciente competencia de los envases de plástico flexibles está actuando como la principal restricción para el mercado de envases de papel y cartón. La dificultad para mantener la calidad de los productos de envasado a base de papel está actuando como un gran desafío para el crecimiento del mercado.
This paper and paperboard packaging market report provide details of market share, new developments, and product pipeline analysis, the impact of domestic and localized market players, analyses opportunities in terms of emerging revenue pockets, changes in market regulations, product approvals, strategic decisions, product launches, geographical expansions, and technological innovations in the market. To understand the analysis and the market scenario, contact us for an Analyst Brief, our team will help you create a revenue impact solution to achieve your desired goal.
Asia-Pacific Paper and Paperboard Packaging Market Scope and Market Size
Asia-Pacific paper and paperboard packaging market is segmented into five notable segments, which are based on the type, product, property, weight and end user.
- On the basis of type, the Asia-Pacific paper and paperboard packaging market is segmented into stickers, shopper, coating, packaging, invitations/envelopes/notepaper, labels, covers, catalogs and digital print. In 2022, packaging segment is expected to dominate the market as the demand for packaging is increasing in the paper and paperboard packaging market as packaging is recyclable and biodegradable
- On the basis of product, the Asia-Pacific paper and paperboard packaging market is segmented into paper cups, kraft paper boards, boxboard, folding boxes and cases, paper bags, and others. In 2022, the kraft paper boards segment is expected to dominate the market as the demand for kraft paper boards is increasing in the paper and paperboard packaging market as kraft paper boards are highly strong and have a high tensile strength
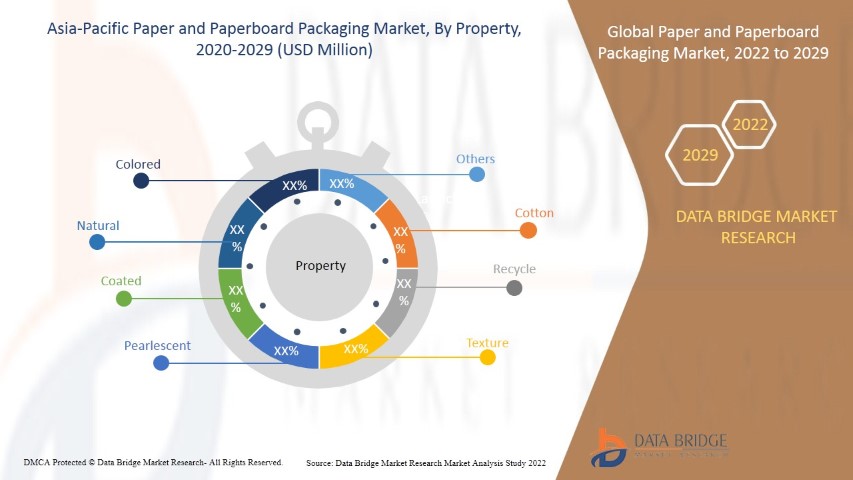
- On the basis of property, the Asia-Pacific paper and paperboard packaging market is segmented into colored, natural, coated, pearlescent, texture, recycle, cotton and others. In 2022, recycle segment is expected to dominate the market as the demand for recycling is increasing in the paper and paperboard packaging market as recycling property helps to reduce pollution
- On the basis of weight, the global paper and paperboard packaging market is segmented into 70 G/M2 TO 100 G/M2, 101 G/M2 TO 150 G/M2, 151 G/M2 TO 200 G/M2, 201 G/M2 TO 250 G/M2 and more than 250 G/M2. In 2022, the 151 G/M2 to 200 G/M2 segment is expected to dominate the market as the demand for 151 G/M2 TO 200 G/M2 is increasing in the paper and paperboard packaging market as this provides excellent flexibility to the products
- On the basis of end user, the Asia-Pacific paper and paperboard packaging market is segmented into personal care and cosmetics, food and beverages, healthcare, consumer goods, education and stationary, and others. In 2022, the food and beverages segment is expected to dominate the market. The demand for paper and paperboards in the food and beverage industry is increasing in the paper and paperboard packaging market as paper packaging maintains the flavor of the products
Asia-Pacific Paper and Paperboard Packaging Market Country Level Analysis
Asia-Pacific paper and paperboard packaging market is analysed and market size information is provided by the country, type, product, property, weight and end user.
The countries covered in Asia-Pacific Paper and paperboard packaging market report are China, Japan, India, South Korea, Australia & New Zealand, Indonesia, Singapore, Thailand, Malaysia, Philippines and Rest of Asia-Pacific.
China is dominating the market in Asia-Pacific region due to rising demand from the e-commerce industry for paper and paperboard containers.
The country section of the report also provides individual market impacting factors and changes in regulation in the market domestically that impacts the current and future trends of the market. Data points such as new sales, replacement sales, country demographics, regulatory acts and import-export tariffs are some of the major pointers used to forecast the market scenario for individual countries. Also, presence and availability of global brands and their challenges faced due to large or scarce competition from local and domestic brands, impact of sales channels are considered while providing forecast analysis of the country data.
Rising Demand of Paper and Paperboard Packaging
Asia-Pacific paper and paperboard packaging market also provides you with detailed market analysis for every country growth in the industry with sales, components sales, impact of technological development in paper and paperboard packaging, and changes in regulatory scenarios with their support for the Paper and paperboard packaging market. The data is available for historic period 2012 to 2020.
Competitive Landscape and Asia-Pacific Paper and Paperboard Packaging Market Share Analysis
Asia-Pacific Paper and paperboard packaging market competitive landscape provide details by competitor. Details included are company overview, company financials, revenue generated, market potential, investment in research and development, new market initiatives, global presence, production sites and facilities, company strengths and weaknesses, product launch, product trials pipelines, product approvals, patents, product width and breadth, application dominance, technology lifeline curve. The above data points are only related to the companies’ focus on Asia-Pacific paper and paperboard packaging market.
Some of the major players operating in the paper and paperboard packaging market are International Paper, Westrock Company, Oji Holdings Corporation, Amcor plc, Packaging Corporation of America, DS Smith, Fedrigoni S.P.A., Mayr-Melnhof Karton AG, Mondi, Nippon Paper Industries Co., Ltd., Rengo Co., Ltd., Sonoco Products Company, Stora Enso, Svenska Cellulosa, Aktiebolaget SCA, and UPM among others. DBMR analysts understand competitive strengths and provide competitive analysis for each competitor separately.
Las empresas de todo el mundo también están iniciando muchos desarrollos de productos, lo que también está acelerando el crecimiento del mercado de envases de papel y cartón en Asia-Pacífico.
Por ejemplo,
- En marzo de 2021, Packaging Corporation of America anunció sus planes de lanzar proyectos trienales por un valor de 440 millones de dólares para convertir de forma permanente una máquina de papel en su fábrica del condado de Clarke para producir cartón para embalajes de cartón ondulado. La empresa instalará una planta OCC para reciclar viejos contenedores de cartón ondulado y varias modificaciones de la fábrica de pulpa. Esto llevó al desarrollo de nuevos productos por parte de la empresa.
- En diciembre de 2021, Amcor plc anunció la apertura de una planta de envasado de última generación para el sector sanitario en Singapur. Con esta ampliación, la empresa se propuso atender las necesidades de los consumidores de la región de Asia y el Pacífico. La nueva instalación se diseñó para satisfacer y superar las necesidades de la industria sanitaria en materia de calidad y cumplimiento normativo, con capacidad de crecimiento para respaldar a los fabricantes de dispositivos médicos. La empresa amplió su presencia global a través de su nueva instalación.
Las asociaciones, las empresas conjuntas y otras estrategias mejoran la participación de mercado de la empresa con una mayor cobertura y presencia. También brindan a la organización la ventaja de mejorar su oferta de envases de papel y cartón mediante una gama más amplia de tamaños.
SKU-
Obtenga acceso en línea al informe sobre la primera nube de inteligencia de mercado del mundo

- Panel de análisis de datos interactivo
- Panel de análisis de empresas para oportunidades con alto potencial de crecimiento
- Acceso de analista de investigación para personalización y consultas
- Análisis de la competencia con panel interactivo
- Últimas noticias, actualizaciones y análisis de tendencias
- Aproveche el poder del análisis de referencia para un seguimiento integral de la competencia
Tabla de contenido
1 INTRODUCTION
1.1 OBJECTIVES OF THE STUDY
1.2 MARKET DEFINITION
1.3 OVERVIEW OF ASIA-PACIFIC PAPER AND PAPERBOARD PACKAGING MARKET
1.4 LIMITATIONS
1.5 MARKETS COVERED
2 MARKET SEGMENTATION
2.1 MARKETS COVERED
2.2 GEOGRAPHICAL SCOPE
2.3 YEARS CONSIDERED FOR THE STUDY
2.4 CURRENCY AND PRICING
2.5 DBMR TRIPOD DATA VALIDATION MODEL
2.6 THE TYPE LINE CURVE
2.7 MULTIVARIATE MODELING
2.8 PRIMARY INTERVIEWS WITH KEY OPINION LEADERS
2.9 DBMR MARKET POSITION GRID
2.1 MARKET END-USER COVERAGE GRID
2.11 DBMR MARKET CHALLENGE MATRIX
2.12 VENDOR SHARE ANALYSIS
2.13 IMPORT-EXPORT DATA
2.14 SECONDARY SOURCES
2.15 ASSUMPTIONS
3 EXECUTIVE SUMMARY
4 PREMIUM INSIGHTS
4.1 TECHNOLOGY OVERVIEW
4.1.1 CORRUGATED SHEET
4.1.2 BUTTER PAPER
4.1.3 CARDBOARD
4.1.4 VIRGIN PAPER
4.1.5 KRAFT LINER
4.1.6 TESTLINER
4.1.7 SBS (SOLID BLEACHED SULFATE) BOARD
4.1.8 CCNB (CLAY COATED NEWS BACKBOARD)
4.2 MANUFACTURING INSIGHTS
5 REGIONAL SUMMARY
5.1 ASIA-PACIFIC
5.2 EUROPE
5.3 THE MIDDLE EAST AND AFRICA
5.4 ASIA-PACIFIC
5.5 NORTH AMERICA
5.6 SOUTH AMERICA
6 MARKET OVERVIEW
6.1 DRIVERS
6.1.1 GROWING DEMAND FOR PAPERBOARD PACKAGING BOXES FROM THE HEALTHCARE INDUSTRY
6.1.2 INCREASING AWARENESS ABOUT SUSTAINABLE PACKAGING MATERIAL AND ADOPTION OF ECO-FRIENDLY PACKAGING
6.1.3 INCREASING ADOPTION OF PAPER-BASED PACKAGING IN THE FOOD INDUSTRY
6.1.4 MOUNTING REQUIREMENT FOR LIGHTWEIGHT PACKAGING BOARDS
6.1.5 INCREASING USE OF PAPERBOARD PACKAGING BY E-COMMERCE INDUSTRIES
6.2 RESTRAINTS
6.2.1 REGULATIONS IMPOSED BY GOVERNMENTS REGARDING THE USE OF PACKAGING MATERIALS
6.2.2 INCREASING COMPETITION FROM FLEXIBLE PLASTIC PACKAGING
6.3 OPPORTUNITIES
6.3.1 ENVIRONMENTAL BENEFITS ASSOCIATED WITH PAPER AND PAPERBOARD PACKAGING
6.3.2 STRONG EMPHASIS ON PAPER RECYCLING INITIATIVES IN SEVERAL COUNTRIES
6.3.3 SURGE IN INNOVATIVE PACKAGING SOLUTIONS WITH DIGITAL PRINTING
6.3.4 INCREASING USAGE OF COMPOSITE CARDBOARD PACKAGING IN THE PERSONAL CARE INDUSTRY
6.4 CHALLENGES
6.4.1 DIFFICULTY IN MAINTAINING QUALITY OF PAPER-BASED PACKAGING PRODUCTS
6.4.2 TEMPERATURE FLUCTUATIONS MAY AFFECT STRENGTH OF THE PAPERBOARD BOXES
7 IMPACT OF COVID-19 ON ASIA-PACIFIC PAPER AND PAPERBOARD PACKAGING MARKET
7.1 ANALYSIS ON IMPACT OF COVID-19 ON ASIA-PACIFIC PAPER AND PAPERBOARD PACKAGING MARKET
7.2 AFTERMATH OF COVID-19 AND GOVERNMENT INITIATIVE TO BOOST ASIA-PACIFIC PAPER AND PAPERBOARD MARKET
7.3 STRATEGIC DECISIONS FOR MANUFACTURERS AFTER COVID-19 TO GAIN COMPETITIVE MARKET SHARE
7.4 IMPACT ON PRICE
7.5 IMPACT ON DEMAND
7.6 IMPACT ON SUPPLY CHAIN
7.7 CONCLUSION
8 ASIA-PACIFIC PAPER AND PAPERBOARD PACKAGING MARKET, BY PRODUCT
8.1 OVERVIEW
8.2 KRAFT PAPER BOARDS
8.3 FOLDING BOXES AND CASES
8.4 PAPER CUPS
8.4.1 COLD PAPER CUPS
8.4.1.1 Serving Cups
8.4.1.2 Portion Cups
8.4.1.3 OTHERS
8.4.2 HOT PAPER CUPS
8.4.2.1 Serving Cups
8.4.2.2 Portion Cups
8.4.2.3 OTHERS
8.5 PAPER BAGS
8.6 BOXBOARD
8.7 OTHERS
9 ASIA-PACIFIC PAPER AND PAPERBOARD PACKAGING MARKET, BY TYPE
9.1 OVERVIEW
9.2 PACKAGING
9.3 SHOPPER
9.4 LABELS
9.5 COATING
9.6 CATALOGS
9.7 COVERS
9.8 DIGITAL PRINT
9.9 STICKERS
9.1 INVITATIONS/ENVELOPES/NOTEPAPER
10 ASIA-PACIFIC PAPER AND PAPERBOARD PACKAGING MARKET, BY PROPERTY
10.1 OVERVIEW
10.2 RECYCLE
10.3 COLORED
10.4 NATURAL
10.5 COATED
10.6 PEARLESCENT
10.7 TEXTURE
10.8 COTTON
10.9 OTHERS
11 ASIA-PACIFIC PAPER AND PAPERBOARD PACKAGING MARKET, BY WEIGHT
11.1 OVERVIEW
11.2 G/M2 TO 200 G/M2
11.3 G/M2 TO 150 G/M2
11.4 G/M2 TO 100 G/M2
11.5 G/M2 TO 250 G/M2
11.6 MORE THAN 250 G/M2
12 ASIA-PACIFIC PAPER AND PAPERBOARD PACKAGING MARKET, BY END-USER
12.1 OVERVIEW
12.2 FOOD & BEVERAGES
12.2.1 FOOD & BEVERAGES, BY END-USER
12.2.1.1 FRUITS & VEGETABLES
12.2.1.2 BAKERY & CONFECTIONERY
12.2.1.3 PROCESSED FOOD
12.2.1.4 FROZEN FOOD
12.2.1.5 MEAT & POULTRY PRODUCTS
12.2.1.6 DAIRY PRODUCTS
12.2.1.7 MILK & MILK DERIVED PRODUCTS
12.2.1.8 JUICES
12.2.1.9 OTHERS
12.2.2 FOOD & BEVERAGES, BY TYPE
12.2.2.1 PACKAGING
12.2.2.2 SHOPPER
12.2.2.3 LABELS
12.2.2.4 COATING
12.2.2.5 CATALOGS
12.2.2.6 COVERS
12.2.2.7 DIGITAL PRINT
12.2.2.8 STICKERS
12.2.2.9 INVITATIONS / ENVELOPES / NOTEPAPER
12.3 HEALTHCARE
12.3.1 HEALTHCARE, BY TYPE
12.3.1.1 PACKAGING
12.3.1.2 SHOPPER
12.3.1.3 LABELS
12.3.1.4 COATING
12.3.1.5 CATALOGS
12.3.1.6 COVERS
12.3.1.7 DIGITAL PRINT
12.3.1.8 STICKERS
12.3.1.9 INVITATIONS / ENVELOPES / NOTEPAPER
12.4 PERSONAL CARE & COSMETICS
12.4.1 PERSONAL CARE & COSMETICS, BY END-USER
12.4.1.1 SKIN CARE
12.4.1.2 HAIR CARE
12.4.1.3 NAIL CARE
12.4.1.4 OTHERS
12.4.2 PERSONAL CARE & COSMETICS, BY TYPE
12.4.2.1 PACKAGING
12.4.2.2 SHOPPER
12.4.2.3 LABELS
12.4.2.4 COATING
12.4.2.5 CATALOGS
12.4.2.6 COVERS
12.4.2.7 DIGITAL PRINT
12.4.2.8 STICKERS
12.4.2.9 INVITATIONS / ENVELOPES / NOTEPAPER
12.5 CONSUMER GOODS
12.5.1 CONSUMER GOODS, BY TYPE
12.5.1.1 PACKAGING
12.5.1.2 SHOPPER
12.5.1.3 LABELS
12.5.1.4 COATING
12.5.1.5 CATALOGS
12.5.1.6 COVERS
12.5.1.7 DIGITAL PRINT
12.5.1.8 STICKERS
12.5.1.9 INVITATIONS / ENVELOPES / NOTEPAPER
12.6 EDUCATION & STATIONERY
12.6.1 EDUCATION & STATIONERY, BY TYPE
12.6.1.1 PACKAGING
12.6.1.2 SHOPPER
12.6.1.3 LABELS
12.6.1.4 COATING
12.6.1.5 CATALOGS
12.6.1.6 COVERS
12.6.1.7 DIGITAL PRINT
12.6.1.8 STICKERS
12.6.1.9 INVITATIONS / ENVELOPES / NOTEPAPER
12.7 OTHERS
12.7.1 OTHERS, BY TYPE
12.7.1.1 PACKAGING
12.7.1.2 SHOPPER
12.7.1.3 LABELS
12.7.1.4 COATING
12.7.1.5 CATALOGS
12.7.1.6 COVERS
12.7.1.7 DIGITAL PRINT
12.7.1.8 STICKERS
12.7.1.9 INVITATIONS / ENVELOPES / NOTEPAPER
13 ASIA-PACIFIC PAPER AND PAPERBOARD PACKAGING MARKET, BY REGION
13.1 ASIA-PACIFIC
13.1.1 CHINA
13.1.2 JAPAN
13.1.3 INDIA
13.1.4 SOUTH KOREA
13.1.5 INDONESIA
13.1.6 AUSTRALIA AND NEW ZEALAND
13.1.7 THAILAND
13.1.8 TAIWAN
13.1.9 MALAYSIA
13.1.10 PHILIPPINES
13.1.11 HONG KONG
13.1.12 SINGAPORE
13.1.13 REST OF ASIA-PACIFIC
14 ASIA-PACIFIC PAPER AND PAPERBOARD PACKAGING MARKET: COMPANY LANDSCAPE
14.1 COMPANY SHARE ANALYSIS: ASIA-PACIFIC
14.2 MERGERS & ACQUISITIONS
14.3 EXPANSIONS
14.4 NEW PRODUCT DEVELOPMENTS
15 SWOT ANALYSIS
16 COMPANY PROFILE
16.1 INTERNATIONAL PAPER
16.1.1 COMPANY SNAPSHOT
16.1.2 REVENUE ANALYSIS
16.1.3 COMPANY SHARE ANALYSIS
16.1.4 PRODUCT PORTFOLIO
16.1.5 RECENT DEVELOPMENTS
16.2 WESTROCK COMPANY
16.2.1 COMPANY SNAPSHOT
16.2.2 REVENUE ANALYSIS
16.2.3 COMPANY SHARE ANALYSIS
16.2.4 PRODUCT PORTFOLIO
16.2.5 RECENT UPDATES
16.3 OJI HOLDINGS CORPORATION
16.3.1 COMPANY SNAPSHOT
16.3.2 REVENUE ANALYSIS
16.3.3 COMPANY SHARE ANALYSIS
16.3.4 PRODUCT PORTFOLIO
16.3.5 RECENT UPDATES
16.4 AMCOR PLC
16.4.1 COMPANY SNAPSHOT
16.4.2 REVENUE ANALYSIS
16.4.3 COMPANY SHARE ANALYSIS
16.4.4 PRODUCT PORTFOLIO
16.4.5 RECENT DEVELOPMENTS
16.5 PACKAGING CORPORATION OF AMERICA
16.5.1 COMPANY SNAPSHOT
16.5.2 REVENUE ANALYSIS
16.5.3 COMPANY SHARE ANALYSIS
16.5.4 PRODUCT PORTFOLIO
16.5.5 RECENT DEVELOPMENTS
16.6 ATLANTIC PACKAGING
16.6.1 COMPANY SNAPSHOT
16.6.2 PRODUCT PORTFOLIO
16.6.3 RECENT DEVELOPMENTS
16.7 CASCADES INC.
16.7.1 COMPANY SNAPSHOT
16.7.2 REVENUE ANALYSIS
16.7.3 PRODUCT PORTFOLIO
16.7.4 RECENT DEVELOPMENTS
16.8 DS SMITH
16.8.1 COMPANY SNAPSHOT
16.8.2 REVENUE ANALYSIS
16.8.3 PRODUCT PORTFOLIO
16.8.4 RECENT DEVELOPMENTS
16.9 FEDRIGONI S.P.A.
16.9.1 COMPANY SNAPSHOT
16.9.2 PRODUCT PORTFOLIO
16.9.3 RECENT DEVELOPMENTS
16.1 GEORGIA-PACIFIC
16.10.1 COMPANY SNAPSHOT
16.10.2 PRODUCT PORTFOLIO
16.10.3 RECENT UPDATES
16.11 MAYR-MELNHOF KARTON AG
16.11.1 COMPANY SNAPSHOT
16.11.2 REVENUE ANALYSIS
16.11.3 PRODUCT PORTFOLIO
16.11.4 RECENT UPDATES
16.12 METSÄ GROUP
16.12.1 COMPANY SNAPSHOT
16.12.2 PRODUCT PORTFOLIO
16.12.3 RECENT UPDATE
16.13 MONDI
16.13.1 COMPANY SNAPSHOT
16.13.2 REVENUE ANALYSIS
16.13.3 PRODUCT PORTFOLIO
16.13.4 RECENT UPDATES
16.14 NIPPON PAPER INDUSTRIES CO., LTD.
16.14.1 COMPANY SNAPSHOT
16.14.2 REVENUE ANALYSIS
16.14.3 PRODUCT PORTFOLIO
16.14.4 RECENT UPDATES
16.15 RENGO CO., LTD.
16.15.1 COMPANY SNAPSHOT
16.15.2 REVENUE ANALYSIS
16.15.3 PRODUCT PORTFOLIO
16.15.4 RECENT UPDATES
16.16 SMURFIT KAPPA
16.16.1 COMPANY SNAPSHOT
16.16.2 REVENUE ANALYSIS
16.16.3 PRODUCT PORTFOLIO
16.16.4 RECENT DEVELOPMENTS
16.17 SONOCO PRODUCTS COMPANY
16.17.1 COMPANY SNAPSHOT
16.17.2 REVENUE ANALYSIS
16.17.3 PRODUCT PORTFOLIO
16.17.4 RECENT UPDATES
16.18 STORA ENSO
16.18.1 COMPANY SNAPSHOT
16.18.2 REVENUE ANALYSIS
16.18.3 PRODUCT PORTFOLIO
16.18.4 RECENT UPDATES
16.19 SVENSKA CELLULOSA AKTIEBOLAGET SCA
16.19.1 COMPANY SNAPSHOT
16.19.2 REVENUE ANALYSIS
16.19.3 PRODUCT PORTFOLIO
16.19.4 RECENT DEVELOPMENTS
16.2 UPM
16.20.1 COMPANY SNAPSHOT
16.20.2 REVENUE ANALYSIS
16.20.3 PRODUCT PORTFOLIO
16.20.4 RECENT UPDATES
17 QUESTIONNAIRES
18 RELATED REPORTS
Lista de Tablas
TABLE 1 EXPORT DATA OF CARTONS, BOXES, CASES, BAGS AND OTHER PACKING CONTAINERS, OF PAPER, PAPERBOARD, CELLULOSE WADDING OR WEBS OF CELLULOSE FIBRES, N.E.S.; BOX FILES, LETTER TRAYS, AND SIMILAR ARTICLES, OF PAPERBOARD OF A KIND USED IN OFFICES, SHOPS , HS CODE: 4819 (USD THOUSAND)
TABLE 2 IMPORT DATA OF CARTONS, BOXES, CASES, BAGS AND OTHER PACKING CONTAINERS, OF PAPER, PAPERBOARD, CELLULOSE WADDING OR WEBS OF CELLULOSE FIBRES, N.E.S.; BOX FILES, LETTER TRAYS, AND SIMILAR ARTICLES, OF PAPERBOARD OF A KIND USED IN OFFICES, SHOPS , HS CODE: 4819 (USD THOUSAND)
TABLE 3 TYPES OF RAW MATERIALS USED IN PHARMACEUTICAL PACKAGING
TABLE 4 ASIA-PACIFIC PAPER AND PAPERBOARD PACKAGING MARKET, BY PRODUCT, 2020-2029 (USD MILLION)
TABLE 5 ASIA-PACIFIC PAPER AND PAPERBOARD PACKAGING MARKET, BY PRODUCT, 2020-2029 (TONS)
TABLE 6 ASIA-PACIFIC KRAFT PAPER BOARDS IN PAPER AND PAPERBOARD PACKAGING MARKET, BY REGION, 2020-2029 (USD MILLION)
TABLE 7 ASIA-PACIFIC KRAFT PAPER BOARDS IN PAPER AND PAPERBOARD PACKAGING MARKET, BY REGION, 2020-2029 (TONS)
TABLE 8 ASIA-PACIFIC FOLDING BOXES AND CASES IN PAPER AND PAPERBOARD PACKAGING MARKET, BY REGION, 2020-2029 (USD MILLION)
TABLE 9 ASIA-PACIFIC FOLDING BOXES AND CASES IN PAPER AND PAPERBOARD PACKAGING MARKET, BY REGION, 2020-2029 (TONS)
TABLE 10 ASIA-PACIFIC PAPER CUPS IN PAPER AND PAPERBOARD PACKAGING MARKET, BY REGION, 2020-2029 (USD MILLION)
TABLE 11 ASIA-PACIFIC PAPER CUPS IN PAPER AND PAPERBOARD PACKAGING MARKET, BY REGION, 2020-2029 (TONS)
TABLE 12 ASIA-PACIFIC PAPER CUPS IN PAPER AND PAPERBOARD PACKAGING MARKET, BY PRODUCT, 2020-2029 (USD MILLION)
TABLE 13 ASIA-PACIFIC COLD PAPER CUPS IN PAPER CUPS IN PAPER AND PAPERBOARD PACKAGING MARKET, BY PRODUCT, 2020-2029 (USD MILLION)
TABLE 14 ASIA-PACIFIC HOT PAPER CUPS IN PAPER CUPS IN PAPER AND PAPERBOARD PACKAGING MARKET, BY PRODUCT, 2020-2029 (USD MILLION)
TABLE 15 ASIA-PACIFIC PAPER BAGS IN PAPER AND PAPERBOARD PACKAGING MARKET, BY REGION, 2020-2029 (USD MILLION)
TABLE 16 ASIA-PACIFIC PAPER BAGS IN PAPER AND PAPERBOARD PACKAGING MARKET, BY REGION, 2020-2029 (TONS)
TABLE 17 ASIA-PACIFIC BOXBOARD IN PAPER AND PAPERBOARD PACKAGING MARKET, BY REGION, 2020-2029 (USD MILLION)
TABLE 18 ASIA-PACIFIC BOXBOARD IN PAPER AND PAPERBOARD PACKAGING MARKET, BY REGION, 2020-2029 (TONS)
TABLE 19 ASIA-PACIFIC OTHERS IN PAPER AND PAPERBOARD PACKAGING MARKET, BY REGION, 2020-2029 (USD MILLION)
TABLE 20 ASIA-PACIFIC OTHERS IN PAPER AND PAPERBOARD PACKAGING MARKET, BY REGION, 2020-2029 (TONS)
TABLE 21 ASIA-PACIFIC PAPER AND PAPERBOARD PACKAGING MARKET, BY TYPE, 2020-2029 (USD MILLION)
TABLE 22 ASIA-PACIFIC PACKAGING IN PAPER AND PAPERBOARD PACKAGING MARKET, BY REGION, 2020-2029 (USD MILLION)
TABLE 23 ASIA-PACIFIC SHOPPER IN PAPER AND PAPERBOARD PACKAGING MARKET, BY REGION, 2020-2029 (USD MILLION)
TABLE 24 ASIA-PACIFIC LABELS IN PAPER AND PAPERBOARD PACKAGING MARKET, BY REGION, 2020-2029 (USD MILLION)
TABLE 25 ASIA-PACIFIC COATING IN PAPER AND PAPERBOARD PACKAGING MARKET, BY REGION, 2020-2029 (USD MILLION)
TABLE 26 ASIA-PACIFIC CATALOGS IN PAPER AND PAPERBOARD PACKAGING MARKET, BY REGION, 2020-2029 (USD MILLION)
TABLE 27 ASIA-PACIFIC COVERS IN PAPER AND PAPERBOARD PACKAGING MARKET, BY REGION, 2020-2029 (USD MILLION)
TABLE 28 ASIA-PACIFIC DIGITAL PRINT IN PAPER AND PAPERBOARD PACKAGING MARKET, BY REGION, 2020-2029 (USD MILLION)
TABLE 29 ASIA-PACIFIC STICKERS IN PAPER AND PAPERBOARD PACKAGING MARKET, BY REGION, 2020-2029 (USD MILLION)
TABLE 30 ASIA-PACIFIC INVITATIONS/ENVELOPES/NOTEPAPER IN PAPER AND PAPERBOARD PACKAGING MARKET, BY REGION, 2020-2029 (USD MILLION)
TABLE 31 ASIA-PACIFIC PAPER AND PAPERBOARD PACKAGING MARKET, BY PROPERTY, 2020-2029 (USD MILLION)
TABLE 32 ASIA-PACIFIC RECYCLE IN PAPER AND PAPERBOARD PACKAGING MARKET, BY REGION, 2020-2029 (USD MILLION)
TABLE 33 ASIA-PACIFIC COLORED IN PAPER AND PAPERBOARD PACKAGING MARKET, BY REGION, 2020-2029 (USD MILLION)
TABLE 34 ASIA-PACIFIC NATURAL IN PAPER AND PAPERBOARD PACKAGING MARKET, BY REGION, 2020-2029 (USD MILLION)
TABLE 35 ASIA-PACIFIC COATED IN PAPER AND PAPERBOARD PACKAGING MARKET, BY REGION, 2020-2029 (USD MILLION)
TABLE 36 ASIA-PACIFIC PEARLESCENT IN PAPER AND PAPERBOARD PACKAGING MARKET, BY REGION, 2020-2029 (USD MILLION)
TABLE 37 ASIA-PACIFIC TEXTURE IN PAPER AND PAPERBOARD PACKAGING MARKET, BY REGION, 2020-2029 (USD MILLION)
TABLE 38 ASIA-PACIFIC COTTON IN PAPER AND PAPERBOARD PACKAGING MARKET, BY REGION, 2020-2029 (USD MILLION)
TABLE 39 ASIA-PACIFIC OTHERS IN PAPER AND PAPERBOARD PACKAGING MARKET, BY REGION, 2020-2029 (USD MILLION)
TABLE 40 ASIA-PACIFIC PAPER AND PAPERBOARD PACKAGING MARKET, BY WEIGHT, 2020-2029 (USD MILLION)
TABLE 41 ASIA-PACIFIC 151 G/M2 TO 200 G/M2 IN PAPER AND PAPERBOARD PACKAGING MARKET, BY REGION, 2020-2029 (USD MILLION)
TABLE 42 ASIA-PACIFIC 101 G/M2 TO 150 G/M2 IN PAPER AND PAPERBOARD PACKAGING MARKET, BY REGION, 2020-2029 (USD MILLION)
TABLE 43 ASIA-PACIFIC 70 G/M2 TO 100 G/M2 IN PAPER AND PAPERBOARD PACKAGING MARKET, BY REGION, 2020-2029 (USD MILLION)
TABLE 44 ASIA-PACIFIC 201 G/M2 TO 250 G/M2 IN PAPER AND PAPERBOARD PACKAGING MARKET, BY REGION, 2020-2029 (USD MILLION)
TABLE 45 ASIA-PACIFIC MORE THAN 250 G/M2 IN PAPER AND PAPERBOARD PACKAGING MARKET, BY REGION, 2020-2029 (USD MILLION)
TABLE 46 ASIA-PACIFIC PAPER AND PAPERBOARD PACKAGING MARKET, BY END-USER, 2020-2029 (USD MILLION)
TABLE 47 ASIA-PACIFIC FOOD & BEVERAGES IN PAPER AND PAPERBOARD PACKAGING MARKET, BY REGION, 2020-2029 (USD MILLION)
TABLE 48 ASIA-PACIFIC FOOD & BEVERAGES IN PAPER AND PAPERBOARD PACKAGING MARKET, BY END-USER, 2020-2029 (USD MILLION)
TABLE 49 ASIA-PACIFIC FOOD & BEVERAGES IN PAPER AND PAPERBOARD PACKAGING MARKET, BY TYPE, 2020-2029 (USD MILLION)
TABLE 50 ASIA-PACIFIC HEALTHCARE IN PAPER AND PAPERBOARD PACKAGING MARKET, BY REGION, 2020-2029 (USD MILLION)
TABLE 51 ASIA-PACIFIC HEALTHCARE IN PAPER AND PAPERBOARD PACKAGING MARKET, BY TYPE, 2020-2029 (USD MILLION)
TABLE 52 ASIA-PACIFIC PERSONAL CARE & COSMETICS IN PAPER AND PAPERBOARD PACKAGING MARKET, BY REGION, 2020-2029 (USD MILLION)
TABLE 53 ASIA-PACIFIC PERSONAL CARE & COSMETICS IN PAPER AND PAPERBOARD PACKAGING MARKET, BY END-USER, 2020-2029 (USD MILLION)
TABLE 54 ASIA-PACIFIC PERSONAL CARE & COSMETICS IN PAPER AND PAPERBOARD PACKAGING MARKET, BY TYPE, 2020-2029 (USD MILLION)
TABLE 55 ASIA-PACIFIC CONSUMER GOODS IN PAPER AND PAPERBOARD PACKAGING MARKET, BY REGION, 2020-2029 (USD MILLION)
TABLE 56 ASIA-PACIFIC CONSUMER GOODS IN PAPER AND PAPERBOARD PACKAGING MARKET, BY TYPE, 2020-2029 (USD MILLION)
TABLE 57 ASIA-PACIFIC EDUCATION & STATIONERY IN PAPER AND PAPERBOARD PACKAGING MARKET, BY REGION, 2020-2029 (USD MILLION)
TABLE 58 ASIA-PACIFIC EDUCATION & STATIONERY IN PAPER AND PAPERBOARD PACKAGING MARKET, BY TYPE, 2020-2029 (USD MILLION)
TABLE 59 ASIA-PACIFIC OTHERS IN PAPER AND PAPERBOARD PACKAGING MARKET, BY REGION, 2020-2029 (USD MILLION)
TABLE 60 ASIA-PACIFIC OTHERS IN PAPER AND PAPERBOARD PACKAGING MARKET, BY TYPE, 2020-2029 (USD MILLION)
TABLE 61 ASIA-PACIFIC PAPER AND PAPERBOARD PACKAGING MARKET, BY COUNTRY, 2020-2029 (USD MILLION)
TABLE 62 ASIA-PACIFIC PAPER AND PAPERBOARD PACKAGING MARKET, BY COUNTRY, 2020-2029 (TONS)
TABLE 63 ASIA-PACIFIC PAPER AND PAPERBOARD PACKAGING MARKET, BY PRODUCT, 2020-2029 (USD MILLION)
TABLE 64 ASIA-PACIFIC PAPER AND PAPERBOARD PACKAGING MARKET, BY PRODUCT, 2020-2029 (TONS)
TABLE 65 ASIA-PACIFIC PAPER CUPS IN PAPER AND PAPERBOARD PACKAGING MARKET, BY PRODUCT, 2020-2029 (USD MILLION)
TABLE 66 ASIA-PACIFIC COLD PAPER CUPS IN PAPER AND PAPERBOARD PACKAGING MARKET, BY PRODUCT, 2020-2029 (USD MILLION)
TABLE 67 ASIA-PACIFIC HOT PAPER CUPS IN PAPER AND PAPERBOARD PACKAGING MARKET, BY PRODUCT, 2020-2029 (USD MILLION)
TABLE 68 ASIA-PACIFIC PAPER AND PAPERBOARD PACKAGING MARKET, BY TYPE, 2020-2029 (USD MILLION)
TABLE 69 ASIA-PACIFIC PAPER AND PAPERBOARD PACKAGING MARKET, BY PROPERTY, 2020-2029 (USD MILLION)
TABLE 70 ASIA-PACIFIC PAPER AND PAPERBOARD PACKAGING MARKET, BY WEIGHT, 2020-2029 (USD MILLION)
TABLE 71 ASIA-PACIFIC PAPER AND PAPERBOARD PACKAGING MARKET, BY END-USER, 2020-2029 (USD MILLION)
TABLE 72 ASIA-PACIFIC FOOD & BEVERAGES IN PAPER AND PAPERBOARD PACKAGING MARKET, BY END-USER, 2020-2029 (USD MILLION)
TABLE 73 ASIA-PACIFIC FOOD & BEVERAGES IN PAPER AND PAPERBOARD PACKAGING MARKET, BY TYPE, 2020-2029 (USD MILLION)
TABLE 74 ASIA-PACIFIC HEALTHCARE PAPER AND PAPERBOARD PACKAGING MARKET, BY TYPE, 2020-2029 (USD MILLION)
TABLE 75 ASIA-PACIFIC PERSONAL CARE & COSMETICS IN PAPER AND PAPERBOARD PACKAGING MARKET, BY END-USER, 2020-2029 (USD MILLION)
TABLE 76 ASIA-PACIFIC PERSONAL CARE & COSMETICS IN PAPER AND PAPERBOARD PACKAGING MARKET, BY TYPE, 2020-2029 (USD MILLION)
TABLE 77 ASIA-PACIFIC CONSUMER GOODS IN PAPER AND PAPERBOARD PACKAGING MARKET, BY TYPE, 2020-2029 (USD MILLION)
TABLE 78 ASIA-PACIFIC EDUCATION & STATIONERY IN PAPER AND PAPERBOARD PACKAGING MARKET, BY TYPE, 2020-2029 (USD MILLION)
TABLE 79 ASIA-PACIFIC OTHERS IN PAPER AND PAPERBOARD PACKAGING MARKET, BY TYPE, 2020-2029 (USD MILLION)
TABLE 80 CHINA PAPER AND PAPERBOARD PACKAGING MARKET, BY PRODUCT, 2020-2029 (USD MILLION)
TABLE 81 CHINA PAPER AND PAPERBOARD PACKAGING MARKET, BY PRODUCT, 2020-2029 (TONS)
TABLE 82 CHINA PAPER CUPS IN PAPER AND PAPERBOARD PACKAGING MARKET, BY PRODUCT, 2020-2029 (USD MILLION)
TABLE 83 CHINA COLD PAPER CUPS IN PAPER AND PAPERBOARD PACKAGING MARKET, BY PRODUCT, 2020-2029 (USD MILLION)
TABLE 84 CHINA HOT PAPER CUPS IN PAPER AND PAPERBOARD PACKAGING MARKET, BY PRODUCT, 2020-2029 (USD MILLION)
TABLE 85 CHINA PAPER AND PAPERBOARD PACKAGING MARKET, BY TYPE, 2020-2029 (USD MILLION)
TABLE 86 CHINA PAPER AND PAPERBOARD PACKAGING MARKET, BY PROPERTY, 2020-2029 (USD MILLION)
TABLE 87 CHINA PAPER AND PAPERBOARD PACKAGING MARKET, BY WEIGHT, 2020-2029 (USD MILLION)
TABLE 88 CHINA PAPER AND PAPERBOARD PACKAGING MARKET, BY END-USER, 2020-2029 (USD MILLION)
TABLE 89 CHINA FOOD & BEVERAGES IN PAPER AND PAPERBOARD PACKAGING MARKET, BY END-USER, 2020-2029 (USD MILLION)
TABLE 90 CHINA FOOD & BEVERAGES IN PAPER AND PAPERBOARD PACKAGING MARKET, BY TYPE, 2020-2029 (USD MILLION)
TABLE 91 CHINA HEALTHCARE PAPER AND PAPERBOARD PACKAGING MARKET, BY TYPE, 2020-2029 (USD MILLION)
TABLE 92 CHINA PERSONAL CARE & COSMETICS IN PAPER AND PAPERBOARD PACKAGING MARKET, BY END-USER, 2020-2029 (USD MILLION)
TABLE 93 CHINA PERSONAL CARE & COSMETICS IN PAPER AND PAPERBOARD PACKAGING MARKET, BY TYPE, 2020-2029 (USD MILLION)
TABLE 94 CHINA CONSUMER GOODS IN PAPER AND PAPERBOARD PACKAGING MARKET, BY TYPE, 2020-2029 (USD MILLION)
TABLE 95 CHINA EDUCATION & STATIONERY IN PAPER AND PAPERBOARD PACKAGING MARKET, BY TYPE, 2020-2029 (USD MILLION)
TABLE 96 CHINA OTHERS IN PAPER AND PAPERBOARD PACKAGING MARKET, BY TYPE, 2020-2029 (USD MILLION)
TABLE 97 JAPAN PAPER AND PAPERBOARD PACKAGING MARKET, BY PRODUCT, 2020-2029 (USD MILLION)
TABLE 98 JAPAN PAPER AND PAPERBOARD PACKAGING MARKET, BY PRODUCT, 2020-2029 (TONS)
TABLE 99 JAPAN PAPER CUPS IN PAPER AND PAPERBOARD PACKAGING MARKET, BY PRODUCT, 2020-2029 (USD MILLION)
TABLE 100 JAPAN COLD PAPER CUPS IN PAPER AND PAPERBOARD PACKAGING MARKET, BY PRODUCT, 2020-2029 (USD MILLION)
TABLE 101 JAPAN HOT PAPER CUPS IN PAPER AND PAPERBOARD PACKAGING MARKET, BY PRODUCT, 2020-2029 (USD MILLION)
TABLE 102 JAPAN PAPER AND PAPERBOARD PACKAGING MARKET, BY TYPE, 2020-2029 (USD MILLION)
TABLE 103 JAPAN PAPER AND PAPERBOARD PACKAGING MARKET, BY PROPERTY, 2020-2029 (USD MILLION)
TABLE 104 JAPAN PAPER AND PAPERBOARD PACKAGING MARKET, BY WEIGHT, 2020-2029 (USD MILLION)
TABLE 105 JAPAN PAPER AND PAPERBOARD PACKAGING MARKET, BY END-USER, 2020-2029 (USD MILLION)
TABLE 106 JAPAN FOOD & BEVERAGES IN PAPER AND PAPERBOARD PACKAGING MARKET, BY END-USER, 2020-2029 (USD MILLION)
TABLE 107 JAPAN FOOD & BEVERAGES IN PAPER AND PAPERBOARD PACKAGING MARKET, BY TYPE, 2020-2029 (USD MILLION)
TABLE 108 JAPAN HEALTHCARE PAPER AND PAPERBOARD PACKAGING MARKET, BY TYPE, 2020-2029 (USD MILLION)
TABLE 109 JAPAN PERSONAL CARE & COSMETICS IN PAPER AND PAPERBOARD PACKAGING MARKET, BY END-USER, 2020-2029 (USD MILLION)
TABLE 110 JAPAN PERSONAL CARE & COSMETICS IN PAPER AND PAPERBOARD PACKAGING MARKET, BY TYPE, 2020-2029 (USD MILLION)
TABLE 111 JAPAN CONSUMER GOODS IN PAPER AND PAPERBOARD PACKAGING MARKET, BY TYPE, 2020-2029 (USD MILLION)
TABLE 112 JAPAN EDUCATION & STATIONERY IN PAPER AND PAPERBOARD PACKAGING MARKET, BY TYPE, 2020-2029 (USD MILLION)
TABLE 113 JAPAN OTHERS IN PAPER AND PAPERBOARD PACKAGING MARKET, BY TYPE, 2020-2029 (USD MILLION)
TABLE 114 INDIA PAPER AND PAPERBOARD PACKAGING MARKET, BY PRODUCT, 2020-2029 (USD MILLION)
TABLE 115 INDIA PAPER AND PAPERBOARD PACKAGING MARKET, BY PRODUCT, 2020-2029 (TONS)
TABLE 116 INDIA PAPER CUPS IN PAPER AND PAPERBOARD PACKAGING MARKET, BY PRODUCT, 2020-2029 (USD MILLION)
TABLE 117 INDIA COLD PAPER CUPS IN PAPER AND PAPERBOARD PACKAGING MARKET, BY PRODUCT, 2020-2029 (USD MILLION)
TABLE 118 INDIA HOT PAPER CUPS IN PAPER AND PAPERBOARD PACKAGING MARKET, BY PRODUCT, 2020-2029 (USD MILLION)
TABLE 119 INDIA PAPER AND PAPERBOARD PACKAGING MARKET, BY TYPE, 2020-2029 (USD MILLION)
TABLE 120 INDIA PAPER AND PAPERBOARD PACKAGING MARKET, BY PROPERTY, 2020-2029 (USD MILLION)
TABLE 121 INDIA PAPER AND PAPERBOARD PACKAGING MARKET, BY WEIGHT, 2020-2029 (USD MILLION)
TABLE 122 INDIA PAPER AND PAPERBOARD PACKAGING MARKET, BY END-USER, 2020-2029 (USD MILLION)
TABLE 123 INDIA FOOD & BEVERAGES IN PAPER AND PAPERBOARD PACKAGING MARKET, BY END-USER, 2020-2029 (USD MILLION)
TABLE 124 INDIA FOOD & BEVERAGES IN PAPER AND PAPERBOARD PACKAGING MARKET, BY TYPE, 2020-2029 (USD MILLION)
TABLE 125 INDIA HEALTHCARE PAPER AND PAPERBOARD PACKAGING MARKET, BY TYPE, 2020-2029 (USD MILLION)
TABLE 126 INDIA PERSONAL CARE & COSMETICS IN PAPER AND PAPERBOARD PACKAGING MARKET, BY END-USER, 2020-2029 (USD MILLION)
TABLE 127 INDIA PERSONAL CARE & COSMETICS IN PAPER AND PAPERBOARD PACKAGING MARKET, BY TYPE, 2020-2029 (USD MILLION)
TABLE 128 INDIA CONSUMER GOODS IN PAPER AND PAPERBOARD PACKAGING MARKET, BY TYPE, 2020-2029 (USD MILLION)
TABLE 129 INDIA EDUCATION & STATIONERY IN PAPER AND PAPERBOARD PACKAGING MARKET, BY TYPE, 2020-2029 (USD MILLION)
TABLE 130 INDIA OTHERS IN PAPER AND PAPERBOARD PACKAGING MARKET, BY TYPE, 2020-2029 (USD MILLION)
TABLE 131 SOUTH KOREA PAPER AND PAPERBOARD PACKAGING MARKET, BY PRODUCT, 2020-2029 (USD MILLION)
TABLE 132 SOUTH KOREA PAPER AND PAPERBOARD PACKAGING MARKET, BY PRODUCT, 2020-2029 (TONS)
TABLE 133 SOUTH KOREA PAPER CUPS IN PAPER AND PAPERBOARD PACKAGING MARKET, BY PRODUCT, 2020-2029 (USD MILLION)
TABLE 134 SOUTH KOREA COLD PAPER CUPS IN PAPER AND PAPERBOARD PACKAGING MARKET, BY PRODUCT, 2020-2029 (USD MILLION)
TABLE 135 SOUTH KOREA HOT PAPER CUPS IN PAPER AND PAPERBOARD PACKAGING MARKET, BY PRODUCT, 2020-2029 (USD MILLION)
TABLE 136 SOUTH KOREA PAPER AND PAPERBOARD PACKAGING MARKET, BY TYPE, 2020-2029 (USD MILLION)
TABLE 137 SOUTH KOREA PAPER AND PAPERBOARD PACKAGING MARKET, BY PROPERTY, 2020-2029 (USD MILLION)
TABLE 138 SOUTH KOREA PAPER AND PAPERBOARD PACKAGING MARKET, BY WEIGHT, 2020-2029 (USD MILLION)
TABLE 139 SOUTH KOREA PAPER AND PAPERBOARD PACKAGING MARKET, BY END-USER, 2020-2029 (USD MILLION)
TABLE 140 SOUTH KOREA FOOD & BEVERAGES IN PAPER AND PAPERBOARD PACKAGING MARKET, BY END-USER, 2020-2029 (USD MILLION)
TABLE 141 SOUTH KOREA FOOD & BEVERAGES IN PAPER AND PAPERBOARD PACKAGING MARKET, BY TYPE, 2020-2029 (USD MILLION)
TABLE 142 SOUTH KOREA HEALTHCARE PAPER AND PAPERBOARD PACKAGING MARKET, BY TYPE, 2020-2029 (USD MILLION)
TABLE 143 SOUTH KOREA PERSONAL CARE & COSMETICS IN PAPER AND PAPERBOARD PACKAGING MARKET, BY END-USER, 2020-2029 (USD MILLION)
TABLE 144 SOUTH KOREA PERSONAL CARE & COSMETICS IN PAPER AND PAPERBOARD PACKAGING MARKET, BY TYPE, 2020-2029 (USD MILLION)
TABLE 145 SOUTH KOREA CONSUMER GOODS IN PAPER AND PAPERBOARD PACKAGING MARKET, BY TYPE, 2020-2029 (USD MILLION)
TABLE 146 SOUTH KOREA EDUCATION & STATIONERY IN PAPER AND PAPERBOARD PACKAGING MARKET, BY TYPE, 2020-2029 (USD MILLION)
TABLE 147 SOUTH KOREA OTHERS IN PAPER AND PAPERBOARD PACKAGING MARKET, BY TYPE, 2020-2029 (USD MILLION)
TABLE 148 INDONESIA PAPER AND PAPERBOARD PACKAGING MARKET, BY PRODUCT, 2020-2029 (USD MILLION)
TABLE 149 INDONESIA PAPER AND PAPERBOARD PACKAGING MARKET, BY PRODUCT, 2020-2029 (TONS)
TABLE 150 INDONESIA PAPER CUPS IN PAPER AND PAPERBOARD PACKAGING MARKET, BY PRODUCT, 2020-2029 (USD MILLION)
TABLE 151 INDONESIA COLD PAPER CUPS IN PAPER AND PAPERBOARD PACKAGING MARKET, BY PRODUCT, 2020-2029 (USD MILLION)
TABLE 152 INDONESIA HOT PAPER CUPS IN PAPER AND PAPERBOARD PACKAGING MARKET, BY PRODUCT, 2020-2029 (USD MILLION)
TABLE 153 INDONESIA PAPER AND PAPERBOARD PACKAGING MARKET, BY TYPE, 2020-2029 (USD MILLION)
TABLE 154 INDONESIA PAPER AND PAPERBOARD PACKAGING MARKET, BY PROPERTY, 2020-2029 (USD MILLION)
TABLE 155 INDONESIA PAPER AND PAPERBOARD PACKAGING MARKET, BY WEIGHT, 2020-2029 (USD MILLION)
TABLE 156 INDONESIA PAPER AND PAPERBOARD PACKAGING MARKET, BY END-USER, 2020-2029 (USD MILLION)
TABLE 157 INDONESIA FOOD & BEVERAGES IN PAPER AND PAPERBOARD PACKAGING MARKET, BY END-USER, 2020-2029 (USD MILLION)
TABLE 158 INDONESIA FOOD & BEVERAGES IN PAPER AND PAPERBOARD PACKAGING MARKET, BY TYPE, 2020-2029 (USD MILLION)
TABLE 159 INDONESIA HEALTHCARE PAPER AND PAPERBOARD PACKAGING MARKET, BY TYPE, 2020-2029 (USD MILLION)
TABLE 160 INDONESIA PERSONAL CARE & COSMETICS IN PAPER AND PAPERBOARD PACKAGING MARKET, BY END-USER, 2020-2029 (USD MILLION)
TABLE 161 INDONESIA PERSONAL CARE & COSMETICS IN PAPER AND PAPERBOARD PACKAGING MARKET, BY TYPE, 2020-2029 (USD MILLION)
TABLE 162 INDONESIA CONSUMER GOODS IN PAPER AND PAPERBOARD PACKAGING MARKET, BY TYPE, 2020-2029 (USD MILLION)
TABLE 163 INDONESIA EDUCATION & STATIONERY IN PAPER AND PAPERBOARD PACKAGING MARKET, BY TYPE, 2020-2029 (USD MILLION)
TABLE 164 INDONESIA OTHERS IN PAPER AND PAPERBOARD PACKAGING MARKET, BY TYPE, 2020-2029 (USD MILLION)
TABLE 165 AUSTRALIA AND NEW ZEALAND PAPER AND PAPERBOARD PACKAGING MARKET, BY PRODUCT, 2020-2029 (USD MILLION)
TABLE 166 AUSTRALIA AND NEW ZEALAND PAPER AND PAPERBOARD PACKAGING MARKET, BY PRODUCT, 2020-2029 (TONS)
TABLE 167 AUSTRALIA AND NEW ZEALAND PAPER CUPS IN PAPER AND PAPERBOARD PACKAGING MARKET, BY PRODUCT, 2020-2029 (USD MILLION)
TABLE 168 AUSTRALIA AND NEW ZEALAND COLD PAPER CUPS IN PAPER AND PAPERBOARD PACKAGING MARKET, BY PRODUCT, 2020-2029 (USD MILLION)
TABLE 169 AUSTRALIA AND NEW ZEALAND HOT PAPER CUPS IN PAPER AND PAPERBOARD PACKAGING MARKET, BY PRODUCT, 2020-2029 (USD MILLION)
TABLE 170 AUSTRALIA AND NEW ZEALAND PAPER AND PAPERBOARD PACKAGING MARKET, BY TYPE, 2020-2029 (USD MILLION)
TABLE 171 AUSTRALIA AND NEW ZEALAND PAPER AND PAPERBOARD PACKAGING MARKET, BY PROPERTY, 2020-2029 (USD MILLION)
TABLE 172 AUSTRALIA AND NEW ZEALAND PAPER AND PAPERBOARD PACKAGING MARKET, BY WEIGHT, 2020-2029 (USD MILLION)
TABLE 173 AUSTRALIA AND NEW ZEALAND PAPER AND PAPERBOARD PACKAGING MARKET, BY END-USER, 2020-2029 (USD MILLION)
TABLE 174 AUSTRALIA AND NEW ZEALAND FOOD & BEVERAGES IN PAPER AND PAPERBOARD PACKAGING MARKET, BY END-USER, 2020-2029 (USD MILLION)
TABLE 175 AUSTRALIA AND NEW ZEALAND FOOD & BEVERAGES IN PAPER AND PAPERBOARD PACKAGING MARKET, BY TYPE, 2020-2029 (USD MILLION)
TABLE 176 AUSTRALIA AND NEW ZEALAND HEALTHCARE PAPER AND PAPERBOARD PACKAGING MARKET, BY TYPE, 2020-2029 (USD MILLION)
TABLE 177 AUSTRALIA AND NEW ZEALAND PERSONAL CARE & COSMETICS IN PAPER AND PAPERBOARD PACKAGING MARKET, BY END-USER, 2020-2029 (USD MILLION)
TABLE 178 AUSTRALIA AND NEW ZEALAND PERSONAL CARE & COSMETICS IN PAPER AND PAPERBOARD PACKAGING MARKET, BY TYPE, 2020-2029 (USD MILLION)
TABLE 179 AUSTRALIA AND NEW ZEALAND CONSUMER GOODS IN PAPER AND PAPERBOARD PACKAGING MARKET, BY TYPE, 2020-2029 (USD MILLION)
TABLE 180 AUSTRALIA AND NEW ZEALAND EDUCATION & STATIONERY IN PAPER AND PAPERBOARD PACKAGING MARKET, BY TYPE, 2020-2029 (USD MILLION)
TABLE 181 AUSTRALIA AND NEW ZEALAND OTHERS IN PAPER AND PAPERBOARD PACKAGING MARKET, BY TYPE, 2020-2029 (USD MILLION)
TABLE 182 THAILAND PAPER AND PAPERBOARD PACKAGING MARKET, BY PRODUCT, 2020-2029 (USD MILLION)
TABLE 183 THAILAND PAPER AND PAPERBOARD PACKAGING MARKET, BY PRODUCT, 2020-2029 (TONS)
TABLE 184 THAILAND PAPER CUPS IN PAPER AND PAPERBOARD PACKAGING MARKET, BY PRODUCT, 2020-2029 (USD MILLION)
TABLE 185 THAILAND COLD PAPER CUPS IN PAPER AND PAPERBOARD PACKAGING MARKET, BY PRODUCT, 2020-2029 (USD MILLION)
TABLE 186 THAILAND HOT PAPER CUPS IN PAPER AND PAPERBOARD PACKAGING MARKET, BY PRODUCT, 2020-2029 (USD MILLION)
TABLE 187 THAILAND PAPER AND PAPERBOARD PACKAGING MARKET, BY TYPE, 2020-2029 (USD MILLION)
TABLE 188 THAILAND PAPER AND PAPERBOARD PACKAGING MARKET, BY PROPERTY, 2020-2029 (USD MILLION)
TABLE 189 THAILAND PAPER AND PAPERBOARD PACKAGING MARKET, BY WEIGHT, 2020-2029 (USD MILLION)
TABLE 190 THAILAND PAPER AND PAPERBOARD PACKAGING MARKET, BY END-USER, 2020-2029 (USD MILLION)
TABLE 191 THAILAND FOOD & BEVERAGES IN PAPER AND PAPERBOARD PACKAGING MARKET, BY END-USER, 2020-2029 (USD MILLION)
TABLE 192 THAILAND FOOD & BEVERAGES IN PAPER AND PAPERBOARD PACKAGING MARKET, BY TYPE, 2020-2029 (USD MILLION)
TABLE 193 THAILAND HEALTHCARE PAPER AND PAPERBOARD PACKAGING MARKET, BY TYPE, 2020-2029 (USD MILLION)
TABLE 194 THAILAND PERSONAL CARE & COSMETICS IN PAPER AND PAPERBOARD PACKAGING MARKET, BY END-USER, 2020-2029 (USD MILLION)
TABLE 195 THAILAND PERSONAL CARE & COSMETICS IN PAPER AND PAPERBOARD PACKAGING MARKET, BY TYPE, 2020-2029 (USD MILLION)
TABLE 196 THAILAND CONSUMER GOODS IN PAPER AND PAPERBOARD PACKAGING MARKET, BY TYPE, 2020-2029 (USD MILLION)
TABLE 197 THAILAND EDUCATION & STATIONERY IN PAPER AND PAPERBOARD PACKAGING MARKET, BY TYPE, 2020-2029 (USD MILLION)
TABLE 198 THAILAND OTHERS IN PAPER AND PAPERBOARD PACKAGING MARKET, BY TYPE, 2020-2029 (USD MILLION)
TABLE 199 TAIWAN PAPER AND PAPERBOARD PACKAGING MARKET, BY PRODUCT, 2020-2029 (USD MILLION)
TABLE 200 TAIWAN PAPER AND PAPERBOARD PACKAGING MARKET, BY PRODUCT, 2020-2029 (TONS)
TABLE 201 TAIWAN PAPER CUPS IN PAPER AND PAPERBOARD PACKAGING MARKET, BY PRODUCT, 2020-2029 (USD MILLION)
TABLE 202 TAIWAN COLD PAPER CUPS IN PAPER AND PAPERBOARD PACKAGING MARKET, BY PRODUCT, 2020-2029 (USD MILLION)
TABLE 203 TAIWAN HOT PAPER CUPS IN PAPER AND PAPERBOARD PACKAGING MARKET, BY PRODUCT, 2020-2029 (USD MILLION)
TABLE 204 TAIWAN PAPER AND PAPERBOARD PACKAGING MARKET, BY TYPE, 2020-2029 (USD MILLION)
TABLE 205 TAIWAN PAPER AND PAPERBOARD PACKAGING MARKET, BY PROPERTY, 2020-2029 (USD MILLION)
TABLE 206 TAIWAN PAPER AND PAPERBOARD PACKAGING MARKET, BY WEIGHT, 2020-2029 (USD MILLION)
TABLE 207 TAIWAN PAPER AND PAPERBOARD PACKAGING MARKET, BY END-USER, 2020-2029 (USD MILLION)
TABLE 208 TAIWAN FOOD & BEVERAGES IN PAPER AND PAPERBOARD PACKAGING MARKET, BY END-USER, 2020-2029 (USD MILLION)
TABLE 209 TAIWAN FOOD & BEVERAGES IN PAPER AND PAPERBOARD PACKAGING MARKET, BY TYPE, 2020-2029 (USD MILLION)
TABLE 210 TAIWAN HEALTHCARE PAPER AND PAPERBOARD PACKAGING MARKET, BY TYPE, 2020-2029 (USD MILLION)
TABLE 211 TAIWAN PERSONAL CARE & COSMETICS IN PAPER AND PAPERBOARD PACKAGING MARKET, BY END-USER, 2020-2029 (USD MILLION)
TABLE 212 TAIWAN PERSONAL CARE & COSMETICS IN PAPER AND PAPERBOARD PACKAGING MARKET, BY TYPE, 2020-2029 (USD MILLION)
TABLE 213 TAIWAN CONSUMER GOODS IN PAPER AND PAPERBOARD PACKAGING MARKET, BY TYPE, 2020-2029 (USD MILLION)
TABLE 214 TAIWAN EDUCATION & STATIONERY IN PAPER AND PAPERBOARD PACKAGING MARKET, BY TYPE, 2020-2029 (USD MILLION)
TABLE 215 TAIWAN OTHERS IN PAPER AND PAPERBOARD PACKAGING MARKET, BY TYPE, 2020-2029 (USD MILLION)
TABLE 216 MALAYSIA PAPER AND PAPERBOARD PACKAGING MARKET, BY PRODUCT, 2020-2029 (USD MILLION)
TABLE 217 MALAYSIA PAPER AND PAPERBOARD PACKAGING MARKET, BY PRODUCT, 2020-2029 (TONS)
TABLE 218 MALAYSIA PAPER CUPS IN PAPER AND PAPERBOARD PACKAGING MARKET, BY PRODUCT, 2020-2029 (USD MILLION)
TABLE 219 MALAYSIA COLD PAPER CUPS IN PAPER AND PAPERBOARD PACKAGING MARKET, BY PRODUCT, 2020-2029 (USD MILLION)
TABLE 220 MALAYSIA HOT PAPER CUPS IN PAPER AND PAPERBOARD PACKAGING MARKET, BY PRODUCT, 2020-2029 (USD MILLION)
TABLE 221 MALAYSIA PAPER AND PAPERBOARD PACKAGING MARKET, BY TYPE, 2020-2029 (USD MILLION)
TABLE 222 MALAYSIA PAPER AND PAPERBOARD PACKAGING MARKET, BY PROPERTY, 2020-2029 (USD MILLION)
TABLE 223 MALAYSIA PAPER AND PAPERBOARD PACKAGING MARKET, BY WEIGHT, 2020-2029 (USD MILLION)
TABLE 224 MALAYSIA PAPER AND PAPERBOARD PACKAGING MARKET, BY END-USER, 2020-2029 (USD MILLION)
TABLE 225 MALAYSIA FOOD & BEVERAGES IN PAPER AND PAPERBOARD PACKAGING MARKET, BY END-USER, 2020-2029 (USD MILLION)
TABLE 226 MALAYSIA FOOD & BEVERAGES IN PAPER AND PAPERBOARD PACKAGING MARKET, BY TYPE, 2020-2029 (USD MILLION)
TABLE 227 MALAYSIA HEALTHCARE PAPER AND PAPERBOARD PACKAGING MARKET, BY TYPE, 2020-2029 (USD MILLION)
TABLE 228 MALAYSIA PERSONAL CARE & COSMETICS IN PAPER AND PAPERBOARD PACKAGING MARKET, BY END-USER, 2020-2029 (USD MILLION)
TABLE 229 MALAYSIA PERSONAL CARE & COSMETICS IN PAPER AND PAPERBOARD PACKAGING MARKET, BY TYPE, 2020-2029 (USD MILLION)
TABLE 230 MALAYSIA CONSUMER GOODS IN PAPER AND PAPERBOARD PACKAGING MARKET, BY TYPE, 2020-2029 (USD MILLION)
TABLE 231 MALAYSIA EDUCATION & STATIONERY IN PAPER AND PAPERBOARD PACKAGING MARKET, BY TYPE, 2020-2029 (USD MILLION)
TABLE 232 MALAYSIA OTHERS IN PAPER AND PAPERBOARD PACKAGING MARKET, BY TYPE, 2020-2029 (USD MILLION)
TABLE 233 PHILIPPINES PAPER AND PAPERBOARD PACKAGING MARKET, BY PRODUCT, 2020-2029 (USD MILLION)
TABLE 234 PHILIPPINES PAPER AND PAPERBOARD PACKAGING MARKET, BY PRODUCT, 2020-2029 (TONS)
TABLE 235 PHILIPPINES PAPER CUPS IN PAPER AND PAPERBOARD PACKAGING MARKET, BY PRODUCT, 2020-2029 (USD MILLION)
TABLE 236 PHILIPPINES COLD PAPER CUPS IN PAPER AND PAPERBOARD PACKAGING MARKET, BY PRODUCT, 2020-2029 (USD MILLION)
TABLE 237 PHILIPPINES HOT PAPER CUPS IN PAPER AND PAPERBOARD PACKAGING MARKET, BY PRODUCT, 2020-2029 (USD MILLION)
TABLE 238 PHILIPPINES PAPER AND PAPERBOARD PACKAGING MARKET, BY TYPE, 2020-2029 (USD MILLION)
TABLE 239 PHILIPPINES PAPER AND PAPERBOARD PACKAGING MARKET, BY PROPERTY, 2020-2029 (USD MILLION)
TABLE 240 PHILIPPINES PAPER AND PAPERBOARD PACKAGING MARKET, BY WEIGHT, 2020-2029 (USD MILLION)
TABLE 241 PHILIPPINES PAPER AND PAPERBOARD PACKAGING MARKET, BY END-USER, 2020-2029 (USD MILLION)
TABLE 242 PHILIPPINES FOOD & BEVERAGES IN PAPER AND PAPERBOARD PACKAGING MARKET, BY END-USER, 2020-2029 (USD MILLION)
TABLE 243 PHILIPPINES FOOD & BEVERAGES IN PAPER AND PAPERBOARD PACKAGING MARKET, BY TYPE, 2020-2029 (USD MILLION)
TABLE 244 PHILIPPINES HEALTHCARE PAPER AND PAPERBOARD PACKAGING MARKET, BY TYPE, 2020-2029 (USD MILLION)
TABLE 245 PHILIPPINES PERSONAL CARE & COSMETICS IN PAPER AND PAPERBOARD PACKAGING MARKET, BY END-USER, 2020-2029 (USD MILLION)
TABLE 246 PHILIPPINES PERSONAL CARE & COSMETICS IN PAPER AND PAPERBOARD PACKAGING MARKET, BY TYPE, 2020-2029 (USD MILLION)
TABLE 247 PHILIPPINES CONSUMER GOODS IN PAPER AND PAPERBOARD PACKAGING MARKET, BY TYPE, 2020-2029 (USD MILLION)
TABLE 248 PHILIPPINES EDUCATION & STATIONERY IN PAPER AND PAPERBOARD PACKAGING MARKET, BY TYPE, 2020-2029 (USD MILLION)
TABLE 249 PHILIPPINES OTHERS IN PAPER AND PAPERBOARD PACKAGING MARKET, BY TYPE, 2020-2029 (USD MILLION)
TABLE 250 HONG KONG PAPER AND PAPERBOARD PACKAGING MARKET, BY PRODUCT, 2020-2029 (USD MILLION)
TABLE 251 HONG KONG PAPER AND PAPERBOARD PACKAGING MARKET, BY PRODUCT, 2020-2029 (TONS)
TABLE 252 HONG KONG PAPER CUPS IN PAPER AND PAPERBOARD PACKAGING MARKET, BY PRODUCT, 2020-2029 (USD MILLION)
TABLE 253 HONG KONG COLD PAPER CUPS IN PAPER AND PAPERBOARD PACKAGING MARKET, BY PRODUCT, 2020-2029 (USD MILLION)
TABLE 254 HONG KONG HOT PAPER CUPS IN PAPER AND PAPERBOARD PACKAGING MARKET, BY PRODUCT, 2020-2029 (USD MILLION)
TABLE 255 HONG KONG PAPER AND PAPERBOARD PACKAGING MARKET, BY TYPE, 2020-2029 (USD MILLION)
TABLE 256 HONG KONG PAPER AND PAPERBOARD PACKAGING MARKET, BY PROPERTY, 2020-2029 (USD MILLION)
TABLE 257 HONG KONG PAPER AND PAPERBOARD PACKAGING MARKET, BY WEIGHT, 2020-2029 (USD MILLION)
TABLE 258 HONG KONG PAPER AND PAPERBOARD PACKAGING MARKET, BY END-USER, 2020-2029 (USD MILLION)
TABLE 259 HONG KONG FOOD & BEVERAGES IN PAPER AND PAPERBOARD PACKAGING MARKET, BY END-USER, 2020-2029 (USD MILLION)
TABLE 260 HONG KONG FOOD & BEVERAGES IN PAPER AND PAPERBOARD PACKAGING MARKET, BY TYPE, 2020-2029 (USD MILLION)
TABLE 261 HONG KONG HEALTHCARE PAPER AND PAPERBOARD PACKAGING MARKET, BY TYPE, 2020-2029 (USD MILLION)
TABLE 262 HONG KONG PERSONAL CARE & COSMETICS IN PAPER AND PAPERBOARD PACKAGING MARKET, BY END-USER, 2020-2029 (USD MILLION)
TABLE 263 HONG KONG PERSONAL CARE & COSMETICS IN PAPER AND PAPERBOARD PACKAGING MARKET, BY TYPE, 2020-2029 (USD MILLION)
TABLE 264 HONG KONG CONSUMER GOODS IN PAPER AND PAPERBOARD PACKAGING MARKET, BY TYPE, 2020-2029 (USD MILLION)
TABLE 265 HONG KONG EDUCATION & STATIONERY IN PAPER AND PAPERBOARD PACKAGING MARKET, BY TYPE, 2020-2029 (USD MILLION)
TABLE 266 HONG KONG OTHERS IN PAPER AND PAPERBOARD PACKAGING MARKET, BY TYPE, 2020-2029 (USD MILLION)
TABLE 267 SINGAPORE PAPER AND PAPERBOARD PACKAGING MARKET, BY PRODUCT, 2020-2029 (USD MILLION)
TABLE 268 SINGAPORE PAPER AND PAPERBOARD PACKAGING MARKET, BY PRODUCT, 2020-2029 (TONS)
TABLE 269 SINGAPORE PAPER CUPS IN PAPER AND PAPERBOARD PACKAGING MARKET, BY PRODUCT, 2020-2029 (USD MILLION)
TABLE 270 SINGAPORE COLD PAPER CUPS IN PAPER AND PAPERBOARD PACKAGING MARKET, BY PRODUCT, 2020-2029 (USD MILLION)
TABLE 271 SINGAPORE HOT PAPER CUPS IN PAPER AND PAPERBOARD PACKAGING MARKET, BY PRODUCT, 2020-2029 (USD MILLION)
TABLE 272 SINGAPORE PAPER AND PAPERBOARD PACKAGING MARKET, BY TYPE, 2020-2029 (USD MILLION)
TABLE 273 SINGAPORE PAPER AND PAPERBOARD PACKAGING MARKET, BY PROPERTY, 2020-2029 (USD MILLION)
TABLE 274 SINGAPORE PAPER AND PAPERBOARD PACKAGING MARKET, BY WEIGHT, 2020-2029 (USD MILLION)
TABLE 275 SINGAPORE PAPER AND PAPERBOARD PACKAGING MARKET, BY END-USER, 2020-2029 (USD MILLION)
TABLE 276 SINGAPORE FOOD & BEVERAGES IN PAPER AND PAPERBOARD PACKAGING MARKET, BY END-USER, 2020-2029 (USD MILLION)
TABLE 277 SINGAPORE FOOD & BEVERAGES IN PAPER AND PAPERBOARD PACKAGING MARKET, BY TYPE, 2020-2029 (USD MILLION)
TABLE 278 SINGAPORE HEALTHCARE PAPER AND PAPERBOARD PACKAGING MARKET, BY TYPE, 2020-2029 (USD MILLION)
TABLE 279 SINGAPORE PERSONAL CARE & COSMETICS IN PAPER AND PAPERBOARD PACKAGING MARKET, BY END-USER, 2020-2029 (USD MILLION)
TABLE 280 SINGAPORE PERSONAL CARE & COSMETICS IN PAPER AND PAPERBOARD PACKAGING MARKET, BY TYPE, 2020-2029 (USD MILLION)
TABLE 281 SINGAPORE CONSUMER GOODS IN PAPER AND PAPERBOARD PACKAGING MARKET, BY TYPE, 2020-2029 (USD MILLION)
TABLE 282 SINGAPORE EDUCATION & STATIONERY IN PAPER AND PAPERBOARD PACKAGING MARKET, BY TYPE, 2020-2029 (USD MILLION)
TABLE 283 SINGAPORE OTHERS IN PAPER AND PAPERBOARD PACKAGING MARKET, BY TYPE, 2020-2029 (USD MILLION)
TABLE 284 REST OF ASIA-PACIFIC PAPER AND PAPERBOARD PACKAGING MARKET, BY PRODUCT, 2020-2029 (USD MILLION)
TABLE 285 REST OF ASIA-PACIFIC PAPER AND PAPERBOARD PACKAGING MARKET, BY PRODUCT, 2020-2029 (TONS)
Lista de figuras
FIGURE 1 ASIA-PACIFIC PAPER AND PAPERBOARD PACKAGING MARKET: SEGMENTATION
FIGURE 2 ASIA-PACIFIC PAPER AND PAPERBOARD PACKAGING MARKET: DATA TRIANGULATION
FIGURE 3 ASIA-PACIFIC PAPER AND PAPERBOARD PACKAGING MARKET: DROC ANALYSIS
FIGURE 4 ASIA-PACIFIC PAPER AND PAPERBOARD PACKAGING MARKET: ASIA-PACIFIC VS REGIONAL MARKET ANALYSIS
FIGURE 5 ASIA-PACIFIC PAPER AND PAPERBOARD PACKAGING MARKET: COMPANY RESEARCH ANALYSIS
FIGURE 6 ASIA-PACIFIC PAPER AND PAPERBOARD PACKAGING MARKET: THE TYPE LINE CURVE
FIGURE 7 ASIA-PACIFIC PAPER AND PAPERBOARD PACKAGING MARKET: MULTIVARIATE MODELLING
FIGURE 8 ASIA-PACIFIC PAPER AND PAPERBOARD PACKAGING MARKET: INTERVIEW DEMOGRAPHICS
FIGURE 9 ASIA-PACIFIC PAPER AND PAPERBOARD PACKAGING MARKET: DBMR MARKET POSITION GRID
FIGURE 10 ASIA-PACIFIC PAPER AND PAPERBOARD PACKAGING MARKET: MARKET END-USER COVERAGE GRID
FIGURE 11 ASIA-PACIFIC PAPER AND PAPERBOARD PACKAGING MARKET: THE MARKET CHALLENGE MATRIX
FIGURE 12 ASIA-PACIFIC PAPER AND PAPERBOARD PACKAGING MARKET: VENDOR SHARE ANALYSIS
FIGURE 13 ASIA-PACIFIC PAPER AND PAPERBOARD PACKAGING MARKET: SEGMENTATION
FIGURE 14 RISING DEMAND FROM THE E-COMMERCE INDUSTRY FOR PAPER AND PAPERBOARD CONTAINERS IS EXPECTED TO DRIVE THE ASIA-PACIFIC PAPER AND PAPERBOARD PACKAGING MARKET IN THE FORECAST PERIOD OF 2022 TO 2029
FIGURE 15 KRAFT PAPER BOARDS SEGMENT IS EXPECTED TO ACCOUNT FOR THE LARGEST SHARE OF THE ASIA-PACIFIC PAPER AND PAPERBOARD PACKAGING MARKET IN 2022 & 2029
FIGURE 16 ASIA-PACIFIC IS THE FASTEST GROWING MARKET FOR PAPER AND PAPERBOARD PACKAGING MARKET IN THE FORECAST PERIOD OF 2022 TO 2029
FIGURE 17 DRIVERS, RESTRAINTS, OPPORTUNITIES, AND CHALLENGES OF ASIA-PACIFIC PAPER AND PAPERBOARD PACKAGING MARKET
FIGURE 18 ASIA-PACIFIC PAPER AND PAPERBOARD PACKAGING MARKET, BY PRODUCT, 2021
FIGURE 19 ASIA-PACIFIC PAPER AND PAPERBOARD PACKAGING MARKET, BY TYPE, 2021
FIGURE 20 ASIA-PACIFIC PAPER AND PAPERBOARD PACKAGING MARKET, BY PROPERTY, 2021
FIGURE 21 ASIA-PACIFIC PAPER AND PAPERBOARD PACKAGING MARKET, BY WEIGHT, 2021
FIGURE 22 ASIA-PACIFIC PAPER AND PAPERBOARD PACKAGING MARKET, BY END-USER, 2021
FIGURE 23 ASIA-PACIFIC PAPER AND PAPERBOARD PACKAGING MARKET: SNAPSHOT (2021)
FIGURE 24 ASIA-PACIFIC PAPER AND PAPERBOARD PACKAGING MARKET: BY COUNTRY (2021)
FIGURE 25 ASIA-PACIFIC PAPER AND PAPERBOARD PACKAGING MARKET: BY COUNTRY (2022 & 2029)
FIGURE 26 ASIA-PACIFIC PAPER AND PAPERBOARD PACKAGING MARKET: BY COUNTRY (2021 & 2029)
FIGURE 27 ASIA-PACIFIC PAPER AND PAPERBOARD PACKAGING MARKET: BY PRODUCT (2022-2029)
FIGURE 28 ASIA-PACIFIC PAPER AND PAPERBOARD PACKAGING MARKET: COMPANY SHARE 2021 (%)
Metodología de investigación
La recopilación de datos y el análisis del año base se realizan utilizando módulos de recopilación de datos con muestras de gran tamaño. La etapa incluye la obtención de información de mercado o datos relacionados a través de varias fuentes y estrategias. Incluye el examen y la planificación de todos los datos adquiridos del pasado con antelación. Asimismo, abarca el examen de las inconsistencias de información observadas en diferentes fuentes de información. Los datos de mercado se analizan y estiman utilizando modelos estadísticos y coherentes de mercado. Además, el análisis de la participación de mercado y el análisis de tendencias clave son los principales factores de éxito en el informe de mercado. Para obtener más información, solicite una llamada de un analista o envíe su consulta.
La metodología de investigación clave utilizada por el equipo de investigación de DBMR es la triangulación de datos, que implica la extracción de datos, el análisis del impacto de las variables de datos en el mercado y la validación primaria (experto en la industria). Los modelos de datos incluyen cuadrícula de posicionamiento de proveedores, análisis de línea de tiempo de mercado, descripción general y guía del mercado, cuadrícula de posicionamiento de la empresa, análisis de patentes, análisis de precios, análisis de participación de mercado de la empresa, estándares de medición, análisis global versus regional y de participación de proveedores. Para obtener más información sobre la metodología de investigación, envíe una consulta para hablar con nuestros expertos de la industria.
Personalización disponible
Data Bridge Market Research es líder en investigación formativa avanzada. Nos enorgullecemos de brindar servicios a nuestros clientes existentes y nuevos con datos y análisis que coinciden y se adaptan a sus objetivos. El informe se puede personalizar para incluir análisis de tendencias de precios de marcas objetivo, comprensión del mercado de países adicionales (solicite la lista de países), datos de resultados de ensayos clínicos, revisión de literatura, análisis de mercado renovado y base de productos. El análisis de mercado de competidores objetivo se puede analizar desde análisis basados en tecnología hasta estrategias de cartera de mercado. Podemos agregar tantos competidores sobre los que necesite datos en el formato y estilo de datos que esté buscando. Nuestro equipo de analistas también puede proporcionarle datos en archivos de Excel sin procesar, tablas dinámicas (libro de datos) o puede ayudarlo a crear presentaciones a partir de los conjuntos de datos disponibles en el informe.

