
>Mercado de alimentos para animales de Asia y el Pacífico por tipo (aminoácidos, minerales, vitaminas, acidificantes , desintoxicantes de micotoxinas, enzimas, fosfatos, carotenoides, antioxidantes, sabores y edulcorantes, antibióticos, nitrógeno no proteico y otros), ganado (cerdos, aves de corral, rumiantes, animales acuáticos y otros), forma (seca y líquida), tendencias de la industria y pronóstico hasta 2029
Análisis y tamaño del mercado
Para satisfacer las necesidades de los cambiantes hábitos alimentarios de la población, la producción ganadera ha aumentado en varios países del mundo, en particular en los mercados en desarrollo. El sector ganadero en el mercado de Asia y el Pacífico, en particular en esa región, se está volviendo cada vez más industrial, a pesar de que un gran número de agricultores en países como la India y China siguen siendo pequeños y marginales.
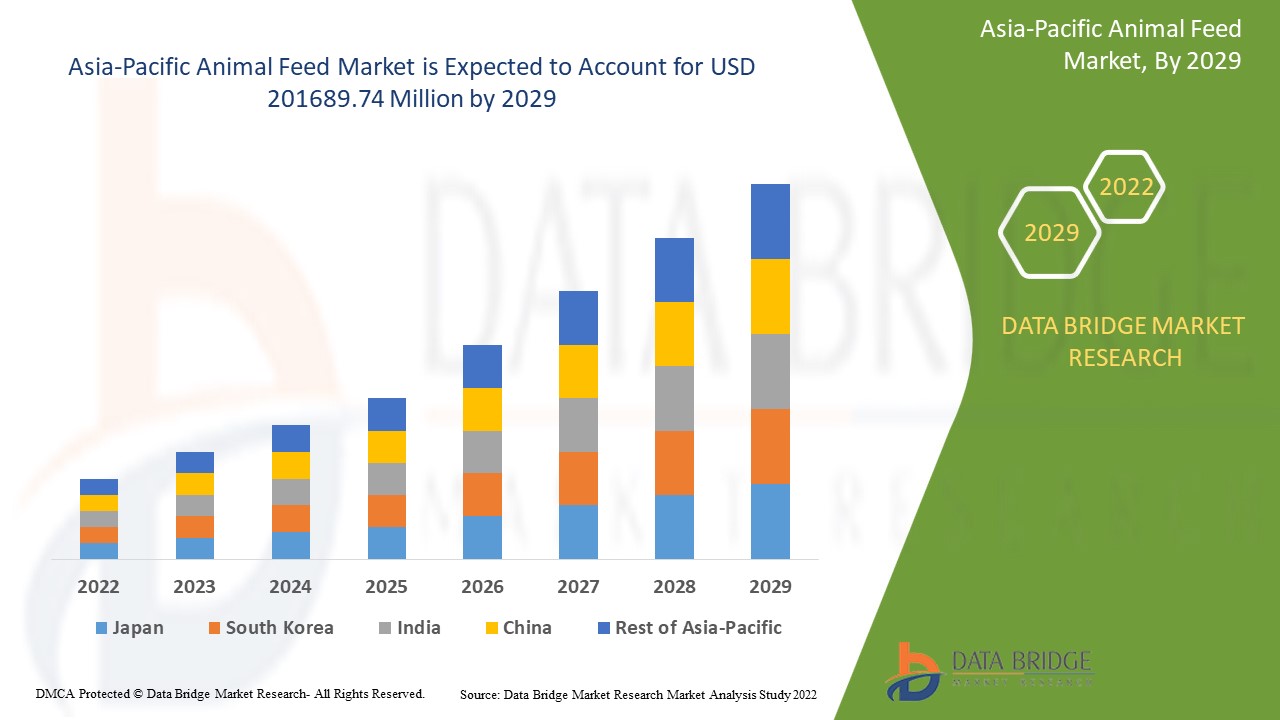
Data Bridge Market Research analiza que el mercado de alimentos para animales estaba creciendo a un valor de 140744,14 millones en 2021 y se espera que alcance el valor de USD 201689,74 millones para 2029, a una CAGR del 4,6% durante el período de pronóstico de 2022 a 2029.
Definición de mercado
El alimento para animales es un alimento nutritivo con altos niveles de proteínas, minerales y vitaminas que se le da al ganado, a los animales de granja y a los animales acuáticos. Lo consumen principalmente los animales domésticos en forma de forraje, heno, ensilado, piensos granulados, semillas oleaginosas, granos germinados y forrajes, entre otros. El alimento para animales es un componente importante de la cría de animales y varía según si los animales se crían para obtener carne, huevos o leche.
Alcance del informe y segmentación del mercado
|
Métrica del informe |
Detalles |
|
Período de pronóstico |
2022 a 2029 |
|
Año base |
2021 |
|
Años históricos |
2020 (Personalizable para 2014 - 2019) |
|
Unidades cuantitativas |
Ingresos en millones de USD, volúmenes en unidades, precios en USD |
|
Segmentos cubiertos |
Por tipo (aminoácidos, minerales, vitaminas, acidificantes, desintoxicantes de micotoxinas, enzimas, fosfatos, carotenoides, antioxidantes, sabores y edulcorantes, antibióticos, nitrógeno no proteico y otros), ganado (cerdos, aves de corral, rumiantes, animales acuáticos y otros), forma (seca y líquida) |
|
Países cubiertos |
China, India, Japón, Australia, Corea del Sur, Singapur, Indonesia, Tailandia, Filipinas, Malasia y resto de Asia-Pacífico |
|
Actores del mercado cubiertos |
CHR. Hansen Holdings A/S (Dinamarca), Lallemand Inc. (Canadá), Novus International (EE. UU.), DSM (Países Bajos), BASF SE (Alemania), Alltech (EE. UU.), ADM (EE. UU.), Charoen Popkphand Foods PCL (Tailandia), Associated British Foods Plc (Reino Unido), Cargill Incorporated (EE. UU.), Purina Animal Nutrition LLC (EE. UU.), Zinpro Corp (EE. UU.), Dallas Keith (Reino Unido), Balchem Inc. (EE. UU.), Kemin Industries, Inc. (EE. UU.) |
|
Oportunidades |
|
Dinámica del mercado de alimentos para animales
Conductores
- Creciente atención a la salud animal
Increased focus on animal health will also drive market expansion. Increased cattle farming will almost certainly increase demand for animal feed. The growing demand for animal-based products by humans will drive up market demand. Natural growth supporters are expected to be active in the market as their momentum grows. Consumer awareness of the advantages of using feed additives to reduce disease has increased market demand.
- Increase in the demand for organic meat
Concerns about food safety have increased the demand for high-quality animal feed to ensure the safety of meat. Another factor driving the growth of the animal feed market is increasing farm owner awareness of the importance of maintaining a healthy animal diet. As a result, they are shifting from standard animal feed to functional and premium variants that help improve enzootic disease immunity while also minimising the risk of metabolic disorders, acidosis, injuries, and infections.
Furthermore, an increase in demand for organic meat from consumers in developed countries, as well as the adoption of new animal rearing practises and the upholding of high farming standards, has created a positive outlook for the industry.
Opportunity
Rising meat consumption in developing economies such as China, India, and Brazil is expected to drive Asia-Pacific demand. Australia is a major pork exporting country that is expected to drive product demand during the forecast period.
Restraints
During the forecast period, high raw material prices, as well as an increasing number of restrictions and regulatory bans, will act as market restraints for animal feed growth. Product awareness will be a restraint on the growth of the animal feed market during the forecast period.
This animal feed market report provides details of new recent developments, trade regulations, import-export analysis, production analysis, value chain optimization, market share, impact of domestic and localized market players, analyses opportunities in terms of emerging revenue pockets, changes in market regulations, strategic market growth analysis, market size, category market growths, application niches and dominance, product approvals, product launches, geographic expansions, technological innovations in the market. To gain more info on the animal feed market contact Data Bridge Market Research for an Analyst Brief, our team will help you take an informed market decision to achieve market growth.
COVID-19 Impact on Animal Feed Market
During the COVID-19 situation, agriculture and food production have been identified as critical sectors in Asia-Pacific. As a result, farmers have continued to provide high-quality nutrition to farm animals in order to feed an increasing number of Asia-Pacific consumers. However, supply chain disruption has become the most significant factor affecting the animal feed market. China is a major producer and exporter of animal feed, and it stockpiled enough product for 2-3 months' supply during the emergence of the COVID-19 situation while businesses were closed for the Lunar New Year. Additionally, logistics issues have hampered the supply of containers and vessels, as well as the transportation of certain micro-ingredients.
Recent Development
- In October 2021, Cargill and BASF announced a partnership in the animal nutrition business, adding research and development capabilities and new markets to the partners' existing feed enzymes distribution agreements. This collaboration aided in the creation, manufacture, marketing, and sale of customer-focused enzyme products and solutions for animals, including swine.
- In July 2021, De Heus acquired Coppens Diervoeding, a Dutch feed manufacturing company specialising in the pig farming sector. With this acquisition, the company was able to double its production capacity and increase its regional presence by 400k.
Asia-Pacific Animal Feed Market Scope
The animal feed market is segmented on the basis of type, livestock and form. The growth amongst these segments will help you analyze meagre growth segments in the industries and provide the users with a valuable market overview and market insights to help them make strategic decisions for identifying core market applications.
Type
- Amino acid
- Minerals
- Vitamins
- Acidifiers
- Mycotoxin detoxifiers
- Enzymes
- Phosphate
- Carotenoids
- Antioxidants
- Flavors & sweeteners
- Antibiotics
- Non-protein nitrogen
- Others
Based on type, the market is segmented into amino acids, minerals, vitamins, acidifiers, mycotoxin detoxifiers, enzymes, phosphate, carotenoids, antioxidants, flavors & sweeteners, antibiotics, non-protein nitrogen and others.
Livestock
- Swine
- Poultry
- Ruminants
- Aquatic animals
- Others
Based on livestock, the market is segmented into swine, poultry, ruminants, aquatic animals and others.
Form
- Dry
- Liquid
Based on form, the market is segmented into dry and liquid.
Animal Feed Market Regional Analysis/Insights
The animal feed market is analysed and market size insights and trends are provided by country, type, livestock and form as referenced above.
The countries covered in the animal feed market report are China, India, Japan, Australia, South Korea, Singapore, Indonesia, Thailand, Philippines, Malaysia and Rest of Asia-Pacific.
Asia representa aproximadamente la mitad de la producción de Asia-Pacífico y es el mercado más importante para el consumo y la producción de carne de cerdo. Debido al alto consumo de carne de cerdo, la región de Asia-Pacífico es el mayor mercado de productos de alimentación animal. El Sudeste Asiático es el mayor productor y exportador de carne de cerdo del mundo. China es el mercado más importante para los productores de carne de cerdo, seguido de Vietnam, Tailandia, Corea del Sur, Japón y Filipinas. Los mercados de consumo de carne de cerdo en Japón, Corea del Sur y Taiwán están saturados, mientras que Vietnam y Filipinas están emergiendo.
La sección de países del informe también proporciona factores de impacto de mercado individuales y cambios en la regulación del mercado que afectan las tendencias actuales y futuras del mercado. Los puntos de datos como el análisis de la cadena de valor ascendente y descendente, las tendencias técnicas y el análisis de las cinco fuerzas de Porter, los estudios de casos son algunos de los indicadores utilizados para pronosticar el escenario del mercado para países individuales. Además, la presencia y disponibilidad de marcas de Asia-Pacífico y sus desafíos enfrentados debido a la gran o escasa competencia de las marcas locales y nacionales, el impacto de los aranceles nacionales y las rutas comerciales se consideran al proporcionar un análisis de pronóstico de los datos del país.
Análisis del panorama competitivo y de la cuota de mercado de los alimentos para animales
El panorama competitivo del mercado de alimentos para animales proporciona detalles por competidor. Los detalles incluidos son una descripción general de la empresa, las finanzas de la empresa, los ingresos generados, el potencial de mercado, la inversión en investigación y desarrollo, las nuevas iniciativas de mercado, la presencia en Asia-Pacífico, los sitios e instalaciones de producción, las capacidades de producción, las fortalezas y debilidades de la empresa, el lanzamiento de productos, la amplitud y variedad de productos, el dominio de las aplicaciones. Los puntos de datos anteriores proporcionados solo están relacionados con el enfoque de las empresas en relación con el mercado de alimentos para animales.
Algunos de los principales actores que operan en el mercado de alimentos para animales son:
- CHR. Hansen Holdings A/S (Dinamarca)
- Lallemand Inc. (Canadá)
- Novus Internacional (Estados Unidos)
- DSM (Países Bajos)
- BASF SE (Alemania)
- Alltech (Estados Unidos)
- ADM (Estados Unidos)
- Charoen Popkphand Foods PCL (Tailandia)
- Associated British Foods Plc (Reino Unido)
- Cargill Incorporated (Estados Unidos)
- Purina Animal Nutrition LLC (Estados Unidos)
- Zinpro Corp (Estados Unidos)
- Dallas Keith (Reino Unido)
- Balchem Inc., (Estados Unidos)
- Kemin Industries, Inc. (Estados Unidos)
SKU-
Obtenga acceso en línea al informe sobre la primera nube de inteligencia de mercado del mundo

- Panel de análisis de datos interactivo
- Panel de análisis de empresas para oportunidades con alto potencial de crecimiento
- Acceso de analista de investigación para personalización y consultas
- Análisis de la competencia con panel interactivo
- Últimas noticias, actualizaciones y análisis de tendencias
- Aproveche el poder del análisis de referencia para un seguimiento integral de la competencia
Tabla de contenido
1 INTRODUCTION
1.1 OBJECTIVES OF THE STUDY
1.2 MARKET DEFINITION
1.3 OVERVIEW OF ASIA-PACIFIC ANIMAL FEED MARKET
1.4 LIMITATIONS
1.5 MARKETS COVERED
2 MARKET SEGMENTATION
2.1 MARKETS COVERED
2.2 GEOGRAPHICAL SCOPE
2.3 YEARS CONSIDERED FOR THE STUDY
2.4 CURRENCY AND PRICING
2.5 DBMR TRIPOD DATA VALIDATION MODEL
2.6 TECHNOLOGY LIFE LINE CURVE
2.7 MULTIVARIATE MODELLING
2.8 PRIMARY INTERVIEWS WITH KEY OPINION LEADERS
2.9 DBMR MARKET POSITION GRID
2.1 MARKET APPLICATION COVERAGE GRID
2.11 DBMR MARKET CHALLENGE MATRIX
2.12 IMPORT-EXPORT DATA
2.13 SECONDARY SOURCES
2.14 ASSUMPTIONS
3 MARKET OVERVIEW
3.1 DRIVERS
3.1.1 GROWING DEMAND OF EDIBLE MEAT
3.1.2 MODERNIZATION AND GROWTH OF AQUACULTURE & LIVESTOCK FEED SECTORS
3.1.3 OUTBURSTS OF DISEASES VIA ANIMALS IS CONTRIBUTING TO THE INCREASE IN ADOPTION FOR ANIMAL FEED
3.1.4 BAN ON THE USE OF ANTIBIOTIC GROWTH PROMOTERS (AGPS) ON ANIMALS
3.1.5 RAPID INCREASING POPULATION OF PETS AND DOMESTICATED ANIMALS
3.2 RESTRAINTS
3.2.1 INCREASING VEGAN POPULATION IS HINDERING THE SALES OF MEAT AND MEAT-BASED PROTEINS
3.2.2 LOW QUALITY OF NUTRITION CHEMICALS IS A MAJOR DETERRENT FOR THE MARKET GROWTH
3.2.3 HIGH COST OF RAW MATERIALS
3.3 OPPORTUNITIES
3.3.1 IMPLEMENTING ALTERNATIVE FEEDING STRATEGIES THAT FOSTER EFFICIENCY IN MODERN ANIMAL NUTRITION
3.3.2 UREA MOLASSES MINERAL BLOCK (UMMB) LICKS USAGE IN CROP RESIDUE FOR ENHANCEMENT OF LIVESTOCK PRODUCTIVITY
3.3.3 BYPASS PROTEIN (UDP) DIET FOR CROSSBRED COWS CAN PAVE THE WAY FOR HIGH YIELD
3.4 CHALLENGES
3.4.1 REGULATIONS ON DIFFERENT FEED ADDITIVES AT COUNTRY LEVEL ESPECIALLY IN EUROPE AND THE U.S.
3.4.2 OUTBREAK OF EPIDEMIC CONTAGIOUS DISEASES THAT AFFECTS THE ANIMAL HEALTH IS LEADING TO LOSS OF LIVESTOCKS
3.4.3 AVAILABILITY OF LIMITED OPTIONS FOR SHRIMP FEED PRODUCTS IN PLANT-BASED MEALS
4 EXECUTIVE SUMMARY
5 PREMIUM INSIGHTS
5.1 RAW MATERIAL PRICING IN ASIA-PACIFIC, 2019 (USD/KG)
5.2 PRODUCTION AND CONSUMPTION PATTERN
5.3 MARKETING STRATEGIES
5.4 LIST OF SUBSTITUTES
6 REGULATORY FRAMEWORK
7 BRAND ANALYSIS
7.1 TOP BRANDS OF ANIMAL FEED AND THEIR COMPANY
8 ASIA-PACIFIC ANIMAL FEED MARKET, BY TYPE
8.1 OVERVIEW
8.2 AMINO ACID
8.2.1 METHIONINE
8.2.2 LYSINE
8.2.3 THREONINE
8.2.4 OTHERS
8.3 MINERALS
8.3.1 CALCIUM
8.3.2 POTASSIUM
8.3.3 MAGNESIUM
8.3.4 OTHERS
8.4 VITAMINS
8.4.1 WATER-SOLUBLE
8.4.2 FAT-SOLUBLE
8.5 ACIDIFIERS
8.5.1 PROPIONIC ACID
8.5.2 FUMARIC ACID
8.5.3 FORMIC ACID
8.5.4 OTHERS
8.6 MYCOTOXIN DETOXIFIERS
8.6.1 BINDERS
8.6.2 MODIFIERS
8.7 ENZYMES
8.7.1 PHYTASE
8.7.2 PROTEASE
8.7.3 OTHERS
8.8 PHOSPHATE
8.8.1 DICALCIUM
8.8.2 MONOCALCIUM
8.8.3 OTHERS
8.9 CAROTENOIDS
8.9.1 ASTAXANTHIN
8.9.2 BETA-CAROTENE
8.9.3 OTHERS
8.1 ANTIOXIDANTS
8.10.1 ETHOXYQUIN
8.10.2 BHA
8.10.3 BHT
8.10.4 OTHERS
8.11 FLAVORS & SWEETENERS
8.11.1 SWEETENERS
8.11.2 FLAVORS
8.12 ANTIBIOTICS
8.12.1 TETRACYCLINE
8.12.2 PENICILLIN
8.12.3 OTHERS
8.13 NON-PROTEIN NITROGEN
8.13.1 UREA
8.13.2 AMMONIA
8.13.3 OTHERS
8.14 OTHERS
9 ASIA-PACIFIC ANIMAL FEED MARKET, BY LIVESTOCK
9.1 OVERVIEW
9.2 SWINE
9.2.1 GROWER
9.2.2 STARTER
9.2.3 SOW
9.3 POULTRY
9.3.1 BROILERS
9.3.2 LAYERS
9.3.3 BREEDERS
9.4 RUMINANTS
9.4.1 DAIRY CATTLE
9.4.2 BEEF CATTLE
9.4.3 CALVES
9.4.4 OTHERS
9.5 AQUATIC ANIMALS
9.6 OTHERS
10 ASIA-PACIFIC ANIMAL FEED MARKET, BY FORM
10.1 OVERVIEW
10.2 DRY
10.2.1 PELLETS
10.2.2 CRUMBLES
10.2.3 MASH
10.2.4 OTHERS
10.2.4.1 GRAIN MIX
10.2.4.2 CRUSHED GRAIN OR SCRATCH
10.2.4.3 OTHERS
10.3 LIQUID
11 ASIA-PACIFIC ANIMAL FEED MARKET: COUNTRY
11.1 ASIA- PACIFIC
11.1.1 CHINA
11.1.2 INDIA
11.1.3 JAPAN
11.1.4 AUSTRALIA
11.1.5 SOUTH KOREA
11.1.6 SINGAPORE
11.1.7 INDONESIA
11.1.8 THAILAND
11.1.9 PHILIPPINES
11.1.10 MALAYSIA
11.1.11 REST OF ASIA-PACIFIC
12 ASIA-PACIFIC ANIMAL FEED MARKET, COMPANY LANDSCAPE
12.1 COMPANY SHARE ANALYSIS: ASIA-PACIFIC
12.2 MERGERS & ACQUISITIONS
12.3 NEW PRODUCT DEVELOPMENT & APPROVALS
12.4 EXPANSIONS
12.5 PARTNERSHIP AND OTHER STRATEGIC DEVELOPMENTS
13 SWOT AND DATA BRIDGE MARKET RESEARCH ANALYSIS
13.1 SWOT ANALYSIS
13.1.1 STRENGTH: - ENHANCING PRODUCT PORTFOLIO FOR VARIOUS TYPES OF ANIMAL FEED
13.1.2 WEAKNESS: - LOW LABOR EFFICIENCY OF POOR FARMERS
13.1.3 OPPORTUNITY: - HIGH RATE OF AGRICULTURAL DIVERSIFICATION AND ANIMAL WELFARE
13.1.4 THREAT: - SEVERE CLIMATIC CHANGES AFFECTS THE FARM ANIMALS
13.2 DATA BRIDGE MARKET RESEARCH ANALYSIS
14 COMPANY PROFILES
14.1 NEW HOPE GROUP
14.1.1 COMPANY SNAPSHOT
14.1.2 PRODUCT PORTFOLIO
14.1.3 RECENT DEVELOPMENT
14.2 BASF SE
14.2.1 COMPANY SNAPSHOT
14.2.2 REVENUE ANALYSIS
14.2.3 PRODUCT PORTFOLIO
14.2.4 RECENT DEVELOPMENT
14.3 AMBOS STOCKFEEDS
14.3.1 COMPANY SNAPSHOT
14.3.2 PRODUCT PORTFOLIO
14.3.3 RECENT DEVELOPMENT
14.4 GUANGDONG HAID GROUP CO., LTD.
14.4.1 COMPANY SNAPSHOT
14.4.2 PRODUCT PORTFOLIO
14.4.3 RECENT DEVELOPMENT
14.5 ALLTECH.
14.5.1 COMPANY SNAPSHOT
14.5.2 PRODUCT PORTFOLIO
14.5.3 RECENT DEVELOPMENT
14.6 CHAROEN POKPHAND GROUP
14.6.1 COMPANY SNAPSHOT
14.6.2 REVENUE ANALYSIS
14.6.3 PRODUCT PORTFOLIO
14.6.4 RECENT DEVELOPMENT
14.7 GEORGE WESTON FOODS LIMITED
14.7.1 COMPANY SNAPSHOT
14.7.2 PRODUCT PORTFOLIO
14.7.3 RECENT DEVELOPMENT
14.8 AJINOMOTO CO., INC.
14.8.1 COMPANY SNAPSHOT
14.8.2 REVENUE ANALYSIS
14.8.3 PRODUCT PORTFOLIO
14.8.4 RECENT DEVELOPMENT
14.9 ARCHER DANIELS MIDLAND COMPANY
14.9.1 COMPANY SNAPSHOT
14.9.2 REVENUE ANALYSIS
14.9.3 PRODUCT PORTFOLIO
14.9.4 RECENT DEVELOPMENTS
14.1 AUSTRALIAN PREMIUM FEEDS
14.10.1 COMPANY SNAPSHOT
14.10.2 PRODUCT PORTFOLIO
14.10.3 RECENT DEVELOPMEN
14.11 CARGILL, INCORPORATED
14.11.1 COMPANY SNAPSHOT
14.11.2 REVENUE ANALYSIS
14.11.3 PRODUCT PORTFOLIO
14.11.4 RECENT DEVELOPMENTS
14.12 CHR. HANSEN HOLDING A/S
14.12.1 COMPANY SNAPSHOT
14.12.2 REVENUE ANALYSIS
14.12.3 PRODUCT PORTFOLIO
14.12.4 RECENT DEVELOPMENT
14.13 DSM
14.13.1 COMPANY SNAPSHOT
14.13.2 REVENUE ANALYSIS
14.13.3 PRODUCT PORTFOLIO
14.13.4 RECENT DEVELOPMENT
14.14 DUPONT
14.14.1 COMPANY SNAPSHOT
14.14.2 REVENUE ANALYSIS
14.14.3 PRODUCT PORTFOLIO
14.14.4 RECENT DEVELOPMENT
14.15 EVONIK INDUSTRIES AG
14.15.1 COMPANY SNAPSHOT
14.15.2 REVENUE ANALYSIS
14.15.3 PRODUCT PORTFOLIO
14.15.4 RECENT DEVELOPMENTS
14.16 INVIVO
14.16.1 COMPANY SNAPSHOT
14.16.2 PRODUCT PORTFOLIO
14.16.3 RECENT DEVELOPMENT
14.17 KEMIN INDUSTRIES, INC.
14.17.1 COMPANY SNAPSHOT
14.17.2 PRODUCT PORTFOLIO
14.17.3 RECENT DEVELOPMENTS
14.18 NUTRECO (A SUBSIDIARY OF SHV HOLDINGS N.V.)
14.18.1 COMPANY SNAPSHOT
14.18.2 PRODUCT PORTFOLIO
14.18.3 RECENT DEVELOPMENT
14.19 SOLVAY
14.19.1 COMPANY SNAPSHOT
14.19.2 REVENUE ANALYSIS
14.19.3 PRODUCT PORTFOLIO
14.19.4 RECENT DEVELOPMENTS
14.2 TYSON FOODS, INC.
14.20.1 COMPANY SNAPSHOT
14.20.2 REVENUE ANALYSIS
14.20.3 PRODUCT PORTFOLIO - TYSON INGREDIENT SOLUTIONS
14.20.4 PRODUCT PORTFOLIO-NUDGES
14.20.5 RECENT DEVELOPMENT
15 CONCLUSION
16 QUESTIONNAIRE
17 RELATED REPORTS
Lista de Tablas
TABLE 1 IMPORT DATA OF OF PREPARATIONS OF A KIND USED IN ANIMAL FEEDING; HS CODE: 2309 (USD MILLION)
TABLE 2 EXPORT DATA OF OF PREPARATIONS OF A KIND USED IN ANIMAL FEEDING; HS CODE: 2309 (USD MILLION)
TABLE 3 ASIA-PACIFIC ANIMAL FEED MARKET, BY TYPE, 2018-2027 (THOUSAND TONS)
TABLE 4 ASIA-PACIFIC ANIMAL FEED MARKET, BY TYPE, 2018-2027 (USD MILLION)
TABLE 5 ASIA-PACIFIC AMINO ACID IN ANIMAL FEED MARKET, BY COUNTRY, 2018-2027 (THOUSAND TONS)
TABLE 6 ASIA-PACIFIC AMINO ACID IN ANIMAL FEED MARKET, BY COUNTRY, 2018-2027 (USD MILLION)
TABLE 7 ASIA-PACIFIC AMINO ACID IN ANIMAL FEED MARKET, BY AMINO ACID TYPE, 2018-2027 (USD MILLION)
TABLE 8 ASIA-PACIFIC MINERALS IN ANIMAL FEED MARKET, BY COUNTRY, 2018-2027 (THOUSAND TONS)
TABLE 9 ASIA-PACIFIC MINERALS IN ANIMAL FEED MARKET, BY COUNTRY, 2018-2027 (USD MILLION)
TABLE 10 ASIA-PACIFIC MINERALS IN ANIMAL FEED MARKET, BY MINERALS TYPE, 2018-2027 (USD MILLION)
TABLE 11 ASIA-PACIFIC VITAMINS IN ANIMAL FEED MARKET, BY COUNTRY, 2018-2027 (THOUSAND TONS)
TABLE 12 ASIA-PACIFIC VITAMINS IN ANIMAL FEED MARKET, BY COUNTRY, 2018-2027 (USD MILLION)
TABLE 13 ASIA-PACIFIC VITAMINS IN ANIMAL FEED MARKET, BY VITAMINS TYPE, 2018-2027 (USD MILLION)
TABLE 14 ASIA-PACIFIC ACIDIFIERS IN ANIMAL FEED MARKET, BY COUNTRY, 2018-2027 (THOUSAND TONS)
TABLE 15 ASIA-PACIFIC ACIDIFIERS IN ANIMAL FEED MARKET, BY COUNTRY, 2018-2027 (USD MILLION)
TABLE 16 ASIA-PACIFIC ACIDIFIERS IN ANIMAL FEED MARKET, BY ACIDIFIERS TYPE, 2018-2027 (USD MILLION)
TABLE 17 ASIA-PACIFIC MYCOTOXIN DETOXIFIERS IN ANIMAL FEED MARKET, BY COUNTRY, 2018-2027 (THOUSAND TONS)
TABLE 18 ASIA-PACIFIC MYCOTOXIN DETOXIFIERS IN ANIMAL FEED MARKET, BY COUNTRY, 2018-2027 (USD MILLION)
TABLE 19 ASIA-PACIFIC MYCOTOXIN DETOXIFIERS IN ANIMAL FEED MARKET, BY MYCOTOXIN DETOXIFIERS TYPE, 2018-2027 (USD MILLION)
TABLE 20 ASIA-PACIFIC ENZYMES IN ANIMAL FEED MARKET, BY COUNTRY, 2018-2027 (THOUSAND TONS)
TABLE 21 ASIA-PACIFIC ENZYMES IN ANIMAL FEED MARKET, BY COUNTRY, 2018-2027 (USD MILLION)
TABLE 22 ASIA-PACIFIC ENZYMES IN ANIMAL FEED MARKET, BY ENZYMES TYPE, 2018-2027 (USD MILLION)
TABLE 23 ASIA-PACIFIC PHOSPHATE IN ANIMAL FEED MARKET, BY COUNTRY, 2018-2027 (THOUSAND TONS)
TABLE 24 ASIA-PACIFIC PHOSPHATE IN ANIMAL FEED MARKET, BY COUNTRY, 2018-2027 (USD MILLION)
TABLE 25 ASIA-PACIFIC PHOSPHATE IN ANIMAL FEED MARKET, BY PHOSPHATE TYPE, 2018-2027 (USD MILLION)
TABLE 26 ASIA-PACIFIC CAROTENOIDS IN ANIMAL FEED MARKET, BY COUNTRY, 2018-2027 (THOUSAND TONS)
TABLE 27 ASIA-PACIFIC CAROTENOIDS IN ANIMAL FEED MARKET, BY COUNTRY, 2018-2027 (USD MILLION)
TABLE 28 ASIA-PACIFIC CAROTENOIDS IN ANIMAL FEED MARKET, BY PHOSPHATE TYPE, 2018-2027 (USD MILLION)
TABLE 29 ASIA-PACIFIC ANTIOXIDANTS IN ANIMAL FEED MARKET, BY COUNTRY, 2018-2027 (THOUSAND TONS)
TABLE 30 ASIA-PACIFIC ANTIOXIDANTS IN ANIMAL FEED MARKET, BY COUNTRY, 2018-2027 (USD MILLION)
TABLE 31 ASIA-PACIFIC ANTIOXIDANTS IN ANIMAL FEED MARKET, BY ANTIOXIDANTS TYPE, 2018-2027 (USD MILLION)
TABLE 32 ASIA-PACIFIC FLAVOURS & SWEETENERS IN ANIMAL FEED MARKET, BY COUNTRY, 2018-2027 (THOUSAND TONS)
TABLE 33 ASIA-PACIFIC FLAVORS & SWEETENERS IN ANIMAL FEED MARKET, BY COUNTRY, 2018-2027 (USD MILLION)
TABLE 34 ASIA-PACIFIC FLAVORS & SWEETENERS IN ANIMAL FEED MARKET, BY FLAVOURS & SWEETENERS TYPE, 2018-2027 (USD MILLION)
TABLE 35 ASIA-PACIFIC ANTIBIOTICS IN ANIMAL FEED MARKET, BY COUNTRY, 2018-2027 (THOUSAND TONS)
TABLE 36 ASIA-PACIFIC ANTIBIOTICS IN ANIMAL FEED MARKET, BY COUNTRY, 2018-2027 (USD MILLION)
TABLE 37 ASIA-PACIFIC ANTIBIOTICS IN ANIMAL FEED MARKET, BY ANTIBIOTICS TYPE, 2018-2027 (USD MILLION)
TABLE 38 ASIA-PACIFIC NON-PROTEIN NITROGEN IN ANIMAL FEED MARKET, BY COUNTRY, 2018-2027 (THOUSAND TONS)
TABLE 39 ASIA-PACIFIC NON-PROTEIN NITROGEN IN ANIMAL FEED MARKET, BY COUNTRY, 2018-2027 (USD MILLION)
TABLE 40 ASIA-PACIFIC NON-PROTEIN NITROGEN IN ANIMAL FEED MARKET, BY NON-PROTEIN NITROGEN TYPE, 2018-2027 (USD MILLION)
TABLE 41 ASIA-PACIFIC OTHERS IN ANIMAL FEED MARKET, BY COUNTRY, 2018-2027 (THOUSAND TONS)
TABLE 42 ASIA-PACIFIC OTHERS IN ANIMAL FEED MARKET, BY COUNTRY, 2018-2027 (USD MILLION)
TABLE 43 ASIA-PACIFIC ANIMAL FEED MARKET, BY LIVESTOCK, 2018-2027 (USD MILLION)
TABLE 44 ASIA-PACIFIC SWINE IN ANIMAL FEED MARKET, BY COUNTRY, 2018-2027 (USD MILLION)
TABLE 45 ASIA-PACIFIC SWINE IN ANIMAL FEED MARKET, BY SWINE LIVESTOCK, 2018-2027 (USD MILLION)
TABLE 46 ASIA-PACIFIC POULTRY IN ANIMAL FEED MARKET, BY COUNTRY, 2018-2027 (USD MILLION)
TABLE 47 ASIA-PACIFIC POULTRY IN ANIMAL FEED MARKET, BY POULTRY LIVESTOCK, 2018-2027 (USD MILLION)
TABLE 48 ASIA-PACIFIC RUMINANTS IN ANIMAL FEED MARKET, BY COUNTRY, 2018-2027 (USD MILLION)
TABLE 49 ASIA-PACIFIC RUMINANTS IN ANIMAL FEED MARKET, BY RUMINANTS LIVESTOCK, 2018-2027 (USD MILLION)
TABLE 50 ASIA-PACIFIC RUMINANTS IN ANIMAL FEED MARKET, BY COUNTRY, 2018-2027 (USD MILLION)
TABLE 51 ASIA-PACIFIC OTHERS IN ANIMAL FEED MARKET, BY COUNTRY, 2018-2027 (USD MILLION)
TABLE 52 ASIA-PACIFIC ANIMAL FEED MARKET, BY FORM, 2018-2027 (USD MILLION)
TABLE 53 ASIA-PACIFIC DRY IN ANIMAL FEED MARKET, BY COUNTRY, 2018-2027 (USD MILLION)
TABLE 54 ASIA-PACIFIC DRY IN ANIMAL FEED MARKET, BY DRY FROM, 2018-2027 (USD MILLION)
TABLE 55 ASIA-PACIFIC OTHERS IN ANIMAL FEED MARKET, BY OTHERS DRY FROM, 2018-2027 (USD MILLION)
TABLE 56 ASIA-PACIFIC LIQUID IN ANIMAL FEED MARKET, BY COUNTRY, 2018-2027 (USD MILLION)
TABLE 57 ASIA- PACIFIC ANIMAL FEED MARKET, BY COUNTRY, 2018-2027 (THOUSAND TONS)
TABLE 58 ASIA-PACIFIC ANIMAL FEED MARKET, BY COUNTRY, 2018-2027 (USD MILLION)
TABLE 59 ASIA-PACIFIC ANIMAL FEED MARKET, BY TYPE, 2018-2027 (THOUSAND TONS)
TABLE 60 ASIA- PACIFIC ANIMAL FEED MARKET, BY TYPE, 2018-2027 (USD MILLION)
TABLE 61 ASIA-PACIFIC AMINO ACID IN ANIMAL FEED MARKET, BY AMINO ACID TYPE, 2018-2027 (USD MILLION)
TABLE 62 ASIA-PACIFIC PHOSPHATE IN ANIMAL FEED MARKET, BY PHOSPHATE TYPE, 2018-2027 (USD MILLION)
TABLE 63 ASIA-PACIFIC VITAMINS IN ANIMAL FEED MARKET, BY VITAMINS TYPE, 2018-2027 (USD MILLION)
TABLE 64 ASIA-PACIFIC ACIDIFIERS IN ANIMAL FEED MARKET, BY ACIDIFIERS TYPE, 2018-2027 (USD MILLION)
TABLE 65 ASIA-PACIFIC CAROTENOIDS IN ANIMAL FEED MARKET, BY CAROTENOIDS TYPE, 2018-2027 (USD MILLION)
TABLE 66 ASIA-PACIFIC ENZYMES IN ANIMAL FEED MARKET, BY ENZYMES TYPE, 2018-2027 (USD MILLION)
TABLE 67 ASIA-PACIFIC MYCOTOXIN DETOXIFIERS IN ANIMAL FEED MARKET, BY MYCOTOXIN DETOXIFIERS TYPE, 2018-2027 (USD MILLION)
TABLE 68 ASIA-PACIFIC FLAVORS & SWEETENERS IN ANIMAL FEED MARKET, BY FLAVORS & SWEETENERS TYPE, 2018-2027 (USD MILLION)
TABLE 69 ASIA-PACIFIC ANTIBIOTICS IN ANIMAL FEED MARKET, BY ANTIBIOTICS TYPE, 2018-2027 (USD MILLION)
TABLE 70 ASIA-PACIFIC MINERALS IN ANIMAL FEED MARKET, BY MINERALS TYPE, 2018-2027 (USD MILLION)
TABLE 71 ASIA-PACIFIC ANTIOXIDENTS IN ANIMAL FEED MARKET, BY ANTIOXIDENTS TYPE, 2018-2027 (USD MILLION)
TABLE 72 ASIA-PACIFIC NON-PROTEIN NITROGEN IN ANIMAL FEED MARKET, BY NON-PROTEIN NITROGEN TYPE, 2018-2027 (USD MILLION)
TABLE 73 ASIA-PACIFIC ANIMAL FEED MARKET, BY LIVESTOCK,2018-2027 (USD MILLION)
TABLE 74 ASIA-PACIFIC RUMINANTS IN ANIMAL FEED MARKET, BY RUMINANTS LIVESTOCK, 2018-2027 (USD MILLION)
TABLE 75 ASIA-PACIFIC POULTRY IN ANIMAL FEED MARKET, BY POULTRY LIVESTOCK,2018-2027 (USD MILLION)
TABLE 76 ASIA-PACIFIC SWINE IN ANIMAL FEED MARKET, BY SWINE LIVESTOCK, 2018-2027 (USD MILLION)
TABLE 77 ASIA-PACIFIC ANIMAL FEED MARKET, BY FORM, 2018-2027 (USD MILLION)
TABLE 78 ASIA-PACIFIC DRY IN ANIMAL FEED MARKET, BY DRY FORM, 2018-2027 (USD MILLION)
TABLE 79 ASIA-PACIFIC OTHERS IN DRY FORM IN ANIMAL FEED MARKET, BY OTHERS DRY FORM, 2018-2027 (USD MILLION)
TABLE 80 CHINA ANIMAL FEED MARKET, BY TYPE, 2018-2027 (THOUSAND TONS)
TABLE 81 CHINA ANIMAL FEED MARKET, BY TYPE, 2018-2027 (USD MILLION)
TABLE 82 CHINA AMINO ACID IN ANIMAL FEED MARKET, BY AMINO ACID TYPE, 2018-2027 (USD MILLION)
TABLE 83 CHINA PHOSPHATE IN ANIMAL FEED MARKET, BY PHOSPHATE TYPE, 2018-2027 (USD MILLION)
TABLE 84 CHINA VITAMINS IN ANIMAL FEED MARKET, BY VITAMINS TYPE, 2018-2027 (USD MILLION)
TABLE 85 CHINA ACIDIFIERS IN ANIMAL FEED MARKET, BY ACIDIFIERS TYPE, 2018-2027 (USD MILLION)
TABLE 86 CHINA CAROTENOIDS IN ANIMAL FEED MARKET, BY CAROTENOIDS TYPE, 2018-2027 (USD MILLION)
TABLE 87 CHINA ENZYMES IN ANIMAL FEED MARKET, BY ENZYMES TYPE, 2018-2027 (USD MILLION)
TABLE 88 CHINA MYCOTOXIN DETOXIFIERS IN ANIMAL FEED MARKET, BY MYCOTOXIN DETOXIFIERS TYPE, 2018-2027 (USD MILLION)
TABLE 89 CHINA FLAVORS & SWEETENERS IN ANIMAL FEED MARKET, BY FLAVORS & SWEETENERS TYPE, 2018-2027 (USD MILLION)
TABLE 90 CHINA ANTIBIOTICS IN ANIMAL FEED MARKET, BY ANTIBIOTICS TYPE, 2018-2027 (USD MILLION)
TABLE 91 CHINA MINERALS IN ANIMAL FEED MARKET, BY MINERALS TYPE, 2018-2027 (USD MILLION)
TABLE 92 CHINA ANTIOXIDENTS IN ANIMAL FEED MARKET, BY ANTIOXIDENTS TYPE, 2018-2027 (USD MILLION)
TABLE 93 CHINA NON-PROTEIN NITROGEN IN ANIMAL FEED MARKET, BY NON-PROTEIN NITROGEN TYPE, 2018-2027 (USD MILLION)
TABLE 94 CHINA ANIMAL FEED MARKET, BY LIVESTOCK, 2018-2027 (USD MILLION)
TABLE 95 CHINA RUMINANTS IN ANIMAL FEED MARKET, BY RUMINANTS LIVESTOCK, 2018-2027 (USD MILLION)
TABLE 96 CHINA POULTRY IN ANIMAL FEED MARKET, BY POULTRY LIVESTOCK, 2018-2027 (USD MILLION)
TABLE 97 CHINA SWINE IN ANIMAL FEED MARKET, BY SWINE LIVESTOCK, 2018-2027 (USD MILLION)
TABLE 98 CHINA ANIMAL FEED MARKET, BY FORM, 2018-2027 (USD MILLION)
TABLE 99 CHINA DRY IN ANIMAL FEED MARKET, BY DRY FORM, 2018-2027 (USD MILLION)
TABLE 100 CHINA OTHERS IN DRY FORM IN ANIMAL FEED MARKET, BY OTHERS DRY FORM, 2018-2027 (USD MILLION)
TABLE 101 INDIA ANIMAL FEED MARKET, BY TYPE, 2018-2027 (THOUSAND TONS)
TABLE 102 INDIA ANIMAL FEED MARKET, BY TYPE, 2018-2027 (USD MILLION)
TABLE 103 INDIA AMINO ACID IN ANIMAL FEED MARKET, BY AMINO ACID TYPE, 2018-2027 (USD MILLION)
TABLE 104 INDIA PHOSPHATE IN ANIMAL FEED MARKET, BY PHOSPHATE TYPE, 2018-2027 (USD MILLION)
TABLE 105 INDIA VITAMINS IN ANIMAL FEED MARKET, BY VITAMINS TYPE, 2018-2027 (USD MILLION)
TABLE 106 INDIA ACIDIFIERS IN ANIMAL FEED MARKET, BY ACIDIFIERS TYPE, 2018-2027 (USD MILLION)
TABLE 107 INDIA CAROTENOIDS IN ANIMAL FEED MARKET, BY CAROTENOIDS TYPE, 2018-2027 (USD MILLION)
TABLE 108 INDIA ENZYMES IN ANIMAL FEED MARKET, BY ENZYMES TYPE, 2018-2027 (USD MILLION)
TABLE 109 INDIA MYCOTOXIN DETOXIFIERS IN ANIMAL FEED MARKET, BY MYCOTOXIN DETOXIFIERS TYPE, 2018-2027 (USD MILLION)
TABLE 110 INDIA FLAVORS & SWEETENERS IN ANIMAL FEED MARKET, BY FLAVORS & SWEETENERS TYPE, 2018-2027 (USD MILLION)
TABLE 111 INDIA ANTIBIOTICS IN ANIMAL FEED MARKET, BY ANTIBIOTICS TYPE, 2018-2027 (USD MILLION)
TABLE 112 INDIA MINERALS IN ANIMAL FEED MARKET, BY MINERALS TYPE, 2018-2027 (USD MILLION)
TABLE 113 INDIA ANTIOXIDENTS IN ANIMAL FEED MARKET, BY ANTIOXIDENTS TYPE, 2018-2027 (USD MILLION)
TABLE 114 INDIA NON-PROTEIN NITROGEN IN ANIMAL FEED MARKET, BY NON-PROTEIN NITROGEN TYPE, 2018-2027 (USD MILLION)
TABLE 115 INDIA ANIMAL FEED MARKET, BY LIVESTOCK, 2018-2027 (USD MILLION)
TABLE 116 INDIA RUMINANTS IN ANIMAL FEED MARKET, BY RUMINANTS LIVESTOCK, 2018-2027 (USD MILLION)
TABLE 117 INDIA POULTRY IN ANIMAL FEED MARKET, BY POULTRY LIVESTOCK, 2018-2027 (USD MILLION)
TABLE 118 INDIA SWINE IN ANIMAL FEED MARKET, BY SWINE LIVESTOCK, 2018-2027 (USD MILLION)
TABLE 119 INDIA ANIMAL FEED MARKET, BY FORM, 2018-2027 (USD MILLION)
TABLE 120 INDIA DRY IN ANIMAL FEED MARKET, BY DRY FORM, 2018-2027 (USD MILLION)
TABLE 121 INDIA OTHERS IN DRY FORM IN ANIMAL FEED MARKET, BY OTHERS DRY FORM, 2018-2027 (USD MILLION)
TABLE 122 JAPAN ANIMAL FEED MARKET, BY TYPE, 2018-2027 (THOUSAND TONS)
TABLE 123 JAPAN ANIMAL FEED MARKET, BY TYPE, 2018-2027 (USD MILLION)
TABLE 124 JAPAN AMINO ACID IN ANIMAL FEED MARKET, BY AMINO ACID TYPE, 2018-2027 (USD MILLION)
TABLE 125 JAPAN PHOSPHATE IN ANIMAL FEED MARKET, BY PHOSPHATE TYPE, 2018-2027 (USD MILLION)
TABLE 126 JAPAN VITAMINS IN ANIMAL FEED MARKET, BY VITAMINS TYPE, 2018-2027 (USD MILLION)
TABLE 127 JAPAN ACIDIFIERS IN ANIMAL FEED MARKET, BY ACIDIFIERS TYPE, 2018-2027 (USD MILLION)
TABLE 128 JAPAN CAROTENOIDS IN ANIMAL FEED MARKET, BY CAROTENOIDS TYPE, 2018-2027 (USD MILLION)
TABLE 129 JAPAN ENZYMES IN ANIMAL FEED MARKET, BY ENZYMES TYPE, 2018-2027 (USD MILLION)
TABLE 130 JAPAN MYCOTOXIN DETOXIFIERS IN ANIMAL FEED MARKET, BY MYCOTOXIN DETOXIFIERS TYPE, 2018-2027 (USD MILLION)
TABLE 131 JAPAN FLAVORS & SWEETENERS IN ANIMAL FEED MARKET, BY FLAVORS & SWEETENERS TYPE, 2018-2027 (USD MILLION)
TABLE 132 JAPAN ANTIBIOTICS IN ANIMAL FEED MARKET, BY ANTIBIOTICS TYPE, 2018-2027 (USD MILLION)
TABLE 133 JAPAN MINERALS IN ANIMAL FEED MARKET, BY MINERALS TYPE, 2018-2027 (USD MILLION)
TABLE 134 JAPAN ANTIOXIDENTS IN ANIMAL FEED MARKET, BY ANTIOXIDENTS TYPE, 2018-2027 (USD MILLION)
TABLE 135 JAPAN NON-PROTEIN NITROGEN IN ANIMAL FEED MARKET, BY NON-PROTEIN NITROGEN TYPE, 2018-2027 (USD MILLION)
TABLE 136 JAPAN ANIMAL FEED MARKET, BY LIVESTOCK, 2018-2027 (USD MILLION)
TABLE 137 JAPAN RUMINANTS IN ANIMAL FEED MARKET, BY RUMINANTS LIVESTOCK, 2018-2027 (USD MILLION)
TABLE 138 JAPAN POULTRY IN ANIMAL FEED MARKET, BY POULTRY LIVESTOCK, 2018-2027 (USD MILLION)
TABLE 139 JAPAN SWINE IN ANIMAL FEED MARKET, BY SWINE LIVESTOCK, 2018-2027 (USD MILLION)
TABLE 140 JAPAN ANIMAL FEED MARKET, BY FORM, 2018-2027 (USD MILLION)
TABLE 141 JAPAN DRY IN ANIMAL FEED MARKET, BY DRY FORM, 2018-2027 (USD MILLION)
TABLE 142 JAPAN OTHERS IN DRY FORM IN ANIMAL FEED MARKET, BY OTHERS DRY FORM, 2018-2027 (USD MILLION)
TABLE 143 AUSTRALIA ANIMAL FEED MARKET , BY TYPE, 2018-2027 (THOUSAND TONS)
TABLE 144 AUSTRALIA ANIMAL FEED MARKET, BY TYPE, 2018-2027 (USD MILLION)
TABLE 145 AUSTRALIA AMINO ACID IN ANIMAL FEED MARKET, BY AMINO ACID TYPE, 2018-2027 (USD MILLION)
TABLE 146 AUSTRALIA PHOSPHATE IN ANIMAL FEED MARKET, BY PHOSPHATE TYPE, 2018-2027 (USD MILLION)
TABLE 147 AUSTRALIA VITAMINS IN ANIMAL FEED MARKET, BY VITAMINS TYPE, 2018-2027 (USD MILLION)
TABLE 148 AUSTRALIA ACIDIFIERS IN ANIMAL FEED MARKET, BY ACIDIFIERS TYPE, 2018-2027 (USD MILLION)
TABLE 149 AUSTRALIA CAROTENOIDS IN ANIMAL FEED MARKET, BY CAROTENOIDS TYPE, 2018-2027 (USD MILLION)
TABLE 150 AUSTRALIA ENZYMES IN ANIMAL FEED MARKET, BY ENZYMES TYPE, 2018-2027 (USD MILLION)
TABLE 151 AUSTRALIA MYCOTOXIN DETOXIFIERS IN ANIMAL FEED MARKET, BY MYCOTOXIN DETOXIFIERS TYPE, 2018-2027 (USD MILLION)
TABLE 152 AUSTRALIA FLAVORS & SWEETENERS IN ANIMAL FEED MARKET, BY FLAVORS & SWEETENERS TYPE, 2018-2027 (USD MILLION)
TABLE 153 AUSTRALIA ANTIBIOTICS IN ANIMAL FEED MARKET, BY ANTIBIOTICS TYPE, 2018-2027 (USD MILLION)
TABLE 154 AUSTRALIA MINERALS IN ANIMAL FEED MARKET, BY MINERALS TYPE, 2018-2027 (USD MILLION)
TABLE 155 AUSTRALIA ANTIOXIDENTS IN ANIMAL FEED MARKET, BY ANTIOXIDENTS TYPE, 2018-2027 (USD MILLION)
TABLE 156 AUSTRALIA NON-PROTEIN NITROGEN IN ANIMAL FEED MARKET, BY NON-PROTEIN NITROGEN TYPE, 2018-2027 (USD MILLION)
TABLE 157 AUSTRALIA ANIMAL FEED MARKET, BY LIVESTOCK, 2018-2027 (USD MILLION)
TABLE 158 AUSTRALIA RUMINANTS IN ANIMAL FEED MARKET, BY RUMINANTS LIVESTOCK, 2018-2027 (USD MILLION)
TABLE 159 AUSTRALIA POULTRY IN ANIMAL FEED MARKET, BY POULTRY LIVESTOCK, 2018-2027 (USD MILLION)
TABLE 160 AUSTRALIA SWINE IN ANIMAL FEED MARKET, BY SWINE LIVESTOCK, 2018-2027 (USD MILLION)
TABLE 161 AUSTRALIA ANIMAL FEED MARKET, BY FORM, 2018-2027 (USD MILLION)
TABLE 162 AUSTRALIA DRY IN ANIMAL FEED MARKET, BY DRY FORM, 2018-2027 (USD MILLION)
TABLE 163 AUSTRALIA OTHERS IN DRY FORM IN ANIMAL FEED MARKET, BY OTHERS DRY FORM, 2018-2027 (USD MILLION)
TABLE 164 SOUTH KOREA ANIMAL FEED MARKET, BY TYPE, 2018-2027 (THOUSAND TONS)
TABLE 165 SOUTH KOREA ANIMAL FEED MARKET, BY TYPE, 2018-2027 (USD MILLION)
TABLE 166 SOUTH KOREA AMINO ACID IN ANIMAL FEED MARKET, BY AMINO ACID TYPE, 2018-2027 (USD MILLION)
TABLE 167 SOUTH KOREA PHOSPHATE IN ANIMAL FEED MARKET, BY PHOSPHATE TYPE, 2018-2027 (USD MILLION)
TABLE 168 SOUTH KOREA VITAMINS IN ANIMAL FEED MARKET, BY VITAMINS TYPE, 2018-2027 (USD MILLION)
TABLE 169 SOUTH KOREA ACIDIFIERS IN ANIMAL FEED MARKET, BY ACIDIFIERS TYPE, 2018-2027 (USD MILLION)
TABLE 170 SOUTH KOREA CAROTENOIDS IN ANIMAL FEED MARKET, BY CAROTENOIDS TYPE, 2018-2027 (USD MILLION)
TABLE 171 SOUTH KOREA ENZYMES IN ANIMAL FEED MARKET, BY ENZYMES TYPE, 2018-2027 (USD MILLION)
TABLE 172 SOUTH KOREA MYCOTOXIN DETOXIFIERS IN ANIMAL FEED MARKET, BY MYCOTOXIN DETOXIFIERS TYPE, 2018-2027 (USD MILLION)
TABLE 173 SOUTH KOREA FLAVORS & SWEETENERS IN ANIMAL FEED MARKET, BY FLAVORS & SWEETENERS TYPE, 2018-2027 (USD MILLION)
TABLE 174 SOUTH KOREA ANTIBIOTICS IN ANIMAL FEED MARKET, BY ANTIBIOTICS TYPE, 2018-2027 (USD MILLION)
TABLE 175 SOUTH KOREA MINERALS IN ANIMAL FEED MARKET, BY MINERALS TYPE, 2018-2027 (USD MILLION)
TABLE 176 SOUTH KOREA ANTIOXIDENTS IN ANIMAL FEED MARKET, BY ANTIOXIDENTS TYPE, 2018-2027 (USD MILLION)
TABLE 177 SOUTH KOREA NON-PROTEIN NITROGEN IN ANIMAL FEED MARKET, BY NON-PROTEIN NITROGEN TYPE, 2018-2027 (USD MILLION)
TABLE 178 SOUTH KOREA ANIMAL FEED MARKET, BY LIVESTOCK, 2018-2027 (USD MILLION)
TABLE 179 SOUTH KOREA RUMINANTS IN ANIMAL FEED MARKET, BY RUMINANTS LIVESTOCK, 2018-2027 (USD MILLION)
TABLE 180 SOUTH KOREA POULTRY IN ANIMAL FEED MARKET, BY POULTRY LIVESTOCK, 2018-2027 (USD MILLION)
TABLE 181 SOUTH KOREA SWINE IN ANIMAL FEED MARKET, BY SWINE LIVESTOCK, 2018-2027 (USD MILLION)
TABLE 182 SOUTH KOREA ANIMAL FEED MARKET, BY FORM, 2018-2027 (USD MILLION)
TABLE 183 SOUTH KOREA DRY IN ANIMAL FEED MARKET, BY DRY FORM, 2018-2027 (USD MILLION)
TABLE 184 SOUTH KOREA OTHERS IN DRY FORM IN ANIMAL FEED MARKET, BY OTHERS DRY FORM, 2018-2027 (USD MILLION)
TABLE 185 SINGAPORE ANIMAL FEED MARKET, BY TYPE, 2018-2027 (THOUSAND TONS)
TABLE 186 SINGAPORE ANIMAL FEED MARKET, BY TYPE, 2018-2027 (USD MILLION)
TABLE 187 SINGAPORE AMINO ACID IN ANIMAL FEED MARKET, BY AMINO ACID TYPE, 2018-2027 (USD MILLION)
TABLE 188 SINGAPORE PHOSPHATE IN ANIMAL FEED MARKET, BY PHOSPHATE TYPE, 2018-2027 (USD MILLION)
TABLE 189 SINGAPORE VITAMINS IN ANIMAL FEED MARKET, BY VITAMINS TYPE, 2018-2027 (USD MILLION)
TABLE 190 SINGAPORE ACIDIFIERS IN ANIMAL FEED MARKET, BY ACIDIFIERS TYPE, 2018-2027 (USD MILLION)
TABLE 191 SINGAPORE CAROTENOIDS IN ANIMAL FEED MARKET, BY CAROTENOIDS TYPE, 2018-2027 (USD MILLION)
TABLE 192 SINGAPORE ENZYMES IN ANIMAL FEED MARKET, BY ENZYMES TYPE, 2018-2027 (USD MILLION)
TABLE 193 SINGAPORE MYCOTOXIN DETOXIFIERS IN ANIMAL FEED MARKET, BY MYCOTOXIN DETOXIFIERS TYPE, 2018-2027 (USD MILLION)
TABLE 194 SINGAPORE FLAVORS & SWEETENERS IN ANIMAL FEED MARKET, BY FLAVORS & SWEETENERS TYPE, 2018-2027 (USD MILLION)
TABLE 195 SINGAPORE ANTIBIOTICS IN ANIMAL FEED MARKET, BY ANTIBIOTICS TYPE, 2018-2027 (USD MILLION)
TABLE 196 SINGAPORE MINERALS IN ANIMAL FEED MARKET, BY MINERALS TYPE, 2018-2027 (USD MILLION)
TABLE 197 SINGAPORE ANTIOXIDENTS IN ANIMAL FEED MARKET, BY ANTIOXIDENTS TYPE, 2018-2027 (USD MILLION)
TABLE 198 SINGAPORE NON-PROTEIN NITROGEN IN ANIMAL FEED MARKET, BY NON-PROTEIN NITROGEN TYPE, 2018-2027 (USD MILLION)
TABLE 199 SINGAPORE ANIMAL FEED MARKET, BY LIVESTOCK, 2018-2027 (USD MILLION)
TABLE 200 SINGAPORE RUMINANTS IN ANIMAL FEED MARKET, BY RUMINANTS LIVESTOCK, 2018-2027 (USD MILLION)
TABLE 201 SINGAPORE POULTRY IN ANIMAL FEED MARKET, BY POULTRY LIVESTOCK, 2018-2027 (USD MILLION)
TABLE 202 SINGAPORE SWINE IN ANIMAL FEED MARKET, BY SWINE LIVESTOCK, 2018-2027 (USD MILLION)
TABLE 203 SINGAPORE ANIMAL FEED MARKET, BY FORM, 2018-2027 (USD MILLION)
TABLE 204 SINGAPORE DRY IN ANIMAL FEED MARKET, BY DRY FORM, 2018-2027 (USD MILLION)
TABLE 205 SINGAPORE OTHERS IN DRY FORM IN ANIMAL FEED MARKET, BY OTHERS DRY FORM, 2018-2027 (USD MILLION)
TABLE 206 INDONESIA ANIMAL FEED MARKET, BY TYPE, 2018-2027 (THOUSAND TONS)
TABLE 207 INDONESIA ANIMAL FEED MARKET, BY TYPE, 2018-2027 (USD MILLION)
TABLE 208 INDONESIA AMINO ACID IN ANIMAL FEED MARKET, BY AMINO ACID TYPE, 2018-2027 (USD MILLION)
TABLE 209 INDONESIA PHOSPHATE IN ANIMAL FEED MARKET, BY PHOSPHATE TYPE, 2018-2027 (USD MILLION)
TABLE 210 INDONESIA VITAMINS IN ANIMAL FEED MARKET, BY VITAMINS TYPE, 2018-2027 (USD MILLION)
TABLE 211 INDONESIA ACIDIFIERS IN ANIMAL FEED MARKET, BY ACIDIFIERS TYPE, 2018-2027 (USD MILLION)
TABLE 212 INDONESIA CAROTENOIDS IN ANIMAL FEED MARKET, BY CAROTENOIDS TYPE, 2018-2027 (USD MILLION)
TABLE 213 INDONESIA ENZYMES IN ANIMAL FEED MARKET, BY ENZYMES TYPE, 2018-2027 (USD MILLION)
TABLE 214 INDONESIA MYCOTOXIN DETOXIFIERS IN ANIMAL FEED MARKET, BY MYCOTOXIN DETOXIFIERS TYPE, 2018-2027 (USD MILLION)
TABLE 215 INDONESIA FLAVORS & SWEETENERS IN ANIMAL FEED MARKET, BY FLAVORS & SWEETENERS TYPE, 2018-2027 (USD MILLION)
TABLE 216 INDONESIA ANTIBIOTICS IN ANIMAL FEED MARKET, BY ANTIBIOTICS TYPE, 2018-2027 (USD MILLION)
TABLE 217 INDONESIA MINERALS IN ANIMAL FEED MARKET, BY MINERALS TYPE, 2018-2027 (USD MILLION)
TABLE 218 INDONESIA ANTIOXIDENTS IN ANIMAL FEED MARKET, BY ANTIOXIDENTS TYPE, 2018-2027 (USD MILLION)
TABLE 219 INDONESIA NON-PROTEIN NITROGEN IN ANIMAL FEED MARKET, BY NON-PROTEIN NITROGEN TYPE, 2018-2027 (USD MILLION)
TABLE 220 INDONESIA ANIMAL FEED MARKET, BY LIVESTOCK, 2018-2027 (USD MILLION)
TABLE 221 INDONESIA RUMINANTS IN ANIMAL FEED MARKET, BY RUMINANTS LIVESTOCK, 2018-2027 (USD MILLION)
TABLE 222 INDONESIA POULTRY IN ANIMAL FEED MARKET, BY POULTRY LIVESTOCK, 2018-2027 (USD MILLION)
TABLE 223 INDONESIA SWINE IN ANIMAL FEED MARKET, BY SWINE LIVESTOCK, 2018-2027 (USD MILLION)
TABLE 224 INDONESIA ANIMAL FEED MARKET, BY FORM, 2018-2027 (USD MILLION)
TABLE 225 INDONESIA DRY IN ANIMAL FEED MARKET, BY DRY FORM, 2018-2027 (USD MILLION)
TABLE 226 INDONESIA OTHERS IN DRY FORM IN ANIMAL FEED MARKET, BY OTHERS DRY FORM, 2018-2027 (USD MILLION)
TABLE 227 THAILAND ANIMAL FEED MARKET, BY TYPE, 2018-2027 (THOUSAND TONS)
TABLE 228 THAILAND ANIMAL FEED MARKET, BY TYPE, 2018-2027 (USD MILLION)
TABLE 229 THAILAND AMINO ACID IN ANIMAL FEED MARKET, BY AMINO ACID TYPE, 2018-2027 (USD MILLION)
TABLE 230 THAILAND PHOSPHATE IN ANIMAL FEED MARKET, BY PHOSPHATE TYPE, 2018-2027 (USD MILLION)
TABLE 231 THAILAND VITAMINS IN ANIMAL FEED MARKET, BY VITAMINS TYPE, 2018-2027 (USD MILLION)
TABLE 232 THAILAND ACIDIFIERS IN ANIMAL FEED MARKET, BY ACIDIFIERS TYPE, 2018-2027 (USD MILLION)
TABLE 233 THAILAND CAROTENOIDS IN ANIMAL FEED MARKET, BY CAROTENOIDS TYPE, 2018-2027 (USD MILLION)
TABLE 234 THAILAND ENZYMES IN ANIMAL FEED MARKET, BY ENZYMES TYPE, 2018-2027 (USD MILLION)
TABLE 235 THAILAND MYCOTOXIN DETOXIFIERS IN ANIMAL FEED MARKET, BY MYCOTOXIN DETOXIFIERS TYPE, 2018-2027 (USD MILLION)
TABLE 236 THAILAND FLAVORS & SWEETENERS IN ANIMAL FEED MARKET, BY FLAVORS & SWEETENERS TYPE, 2018-2027 (USD MILLION)
TABLE 237 THAILAND ANTIBIOTICS IN ANIMAL FEED MARKET, BY ANTIBIOTICS TYPE, 2018-2027 (USD MILLION)
TABLE 238 THAILAND MINERALS IN ANIMAL FEED MARKET, BY MINERALS TYPE, 2018-2027 (USD MILLION)
TABLE 239 THAILAND ANTIOXIDENTS IN ANIMAL FEED MARKET, BY ANTIOXIDENTS TYPE, 2018-2027 (USD MILLION)
TABLE 240 THAILAND NON-PROTEIN NITROGEN IN ANIMAL FEED MARKET, BY NON-PROTEIN NITROGEN TYPE, 2018-2027 (USD MILLION)
TABLE 241 THAILAND ANIMAL FEED MARKET, BY LIVESTOCK, 2018-2027 (USD MILLION)
TABLE 242 THAILAND RUMINANTS IN ANIMAL FEED MARKET, BY RUMINANTS LIVESTOCK, 2018-2027 (USD MILLION)
TABLE 243 THAILAND POULTRY IN ANIMAL FEED MARKET, BY POULTRY LIVESTOCK, 2018-2027 (USD MILLION)
TABLE 244 THAILAND SWINE IN ANIMAL FEED MARKET, BY SWINE LIVESTOCK, 2018-2027 (USD MILLION)
TABLE 245 THAILAND ANIMAL FEED MARKET, BY FORM, 2018-2027 (USD MILLION)
TABLE 246 THAILAND DRY IN ANIMAL FEED MARKET, BY DRY FORM, 2018-2027 (USD MILLION)
TABLE 247 THAILAND OTHERS IN DRY FORM IN ANIMAL FEED MARKET, BY OTHERS DRY FORM, 2018-2027 (USD MILLION)
TABLE 248 PHILIPPINES ANIMAL FEED MARKET, BY TYPE, 2018-2027 (THOUSAND TONS)
TABLE 249 PHILIPPINES ANIMAL FEED MARKET , BY TYPE, 2018-2027 (USD MILLION)
TABLE 250 PHILIPPINES AMINO ACID IN ANIMAL FEED MARKET, BY AMINO ACID TYPE, 2018-2027 (USD MILLION)
TABLE 251 PHILIPPINES PHOSPHATE IN ANIMAL FEED MARKET, BY PHOSPHATE TYPE, 2018-2027 (USD MILLION)
TABLE 252 PHILIPPINES VITAMINS IN ANIMAL FEED MARKET, BY VITAMINS TYPE, 2018-2027 (USD MILLION)
TABLE 253 PHILIPPINES ACIDIFIERS IN ANIMAL FEED MARKET, BY ACIDIFIERS TYPE, 2018-2027 (USD MILLION)
TABLE 254 PHILIPPINES CAROTENOIDS IN ANIMAL FEED MARKET, BY CAROTENOIDS TYPE, 2018-2027 (USD MILLION)
TABLE 255 PHILIPPINES ENZYMES IN ANIMAL FEED MARKET, BY ENZYMES TYPE, 2018-2027 (USD MILLION)
TABLE 256 PHILIPPINES MYCOTOXIN DETOXIFIERS IN ANIMAL FEED MARKET, BY MYCOTOXIN DETOXIFIERS TYPE, 2018-2027 (USD MILLION)
TABLE 257 PHILIPPINES FLAVORS & SWEETENERS IN ANIMAL FEED MARKET, BY FLAVORS & SWEETENERS TYPE, 2018-2027 (USD MILLION)
TABLE 258 PHILIPPINES ANTIBIOTICS IN ANIMAL FEED MARKET, BY ANTIBIOTICS TYPE, 2018-2027 (USD MILLION)
TABLE 259 PHILIPPINES MINERALS IN ANIMAL FEED MARKET, BY MINERALS TYPE, 2018-2027 (USD MILLION)
TABLE 260 PHILIPPINES ANTIOXIDENTS IN ANIMAL FEED MARKET, BY ANTIOXIDENTS TYPE, 2018-2027 (USD MILLION)
TABLE 261 PHILIPPINES NON-PROTEIN NITROGEN IN ANIMAL FEED MARKET, BY NON-PROTEIN NITROGEN TYPE, 2018-2027 (USD MILLION)
TABLE 262 PHILIPPINES ANIMAL FEED MARKET, BY LIVESTOCK, 2018-2027 (USD MILLION)
TABLE 263 PHILIPPINES RUMINANTS IN ANIMAL FEED MARKET, BY RUMINANTS LIVESTOCK, 2018-2027 (USD MILLION)
TABLE 264 PHILIPPINES POULTRY IN ANIMAL FEED MARKET, BY POULTRY LIVESTOCK, 2018-2027 (USD MILLION)
TABLE 265 PHILIPPINES SWINE IN ANIMAL FEED MARKET, BY SWINE LIVESTOCK, 2018-2027 (USD MILLION)
TABLE 266 PHILIPPINES ANIMAL FEED MARKET, BY FORM, 2018-2027 (USD MILLION)
TABLE 267 PHILIPPINES DRY IN ANIMAL FEED MARKET, BY DRY FORM, 2018-2027 (USD MILLION)
TABLE 268 PHILIPPINES OTHERS IN DRY FORM IN ANIMAL FEED MARKET, BY OTHERS DRY FORM, 2018-2027 (USD MILLION)
TABLE 269 MALAYSIA ANIMAL FEED MARKET, BY TYPE, 2018-2027 (THOUSAND TONS)
TABLE 270 MALAYSIA ANIMAL FEED MARKET, BY TYPE, 2018-2027 (USD MILLION)
TABLE 271 MALAYSIA AMINO ACID IN ANIMAL FEED MARKET, BY AMINO ACID TYPE, 2018-2027 (USD MILLION)
TABLE 272 MALAYSIA PHOSPHATE IN ANIMAL FEED MARKET, BY PHOSPHATE TYPE, 2018-2027 (USD MILLION)
TABLE 273 MALAYSIA VITAMINS IN ANIMAL FEED MARKET, BY VITAMINS TYPE, 2018-2027 (USD MILLION)
TABLE 274 MALAYSIA ACIDIFIERS IN ANIMAL FEED MARKET, BY ACIDIFIERS TYPE, 2018-2027 (USD MILLION)
TABLE 275 MALAYSIA CAROTENOIDS IN ANIMAL FEED MARKET, BY CAROTENOIDS TYPE, 2018-2027 (USD MILLION)
TABLE 276 MALAYSIA ENZYMES IN ANIMAL FEED MARKET, BY ENZYMES TYPE, 2018-2027 (USD MILLION)
TABLE 277 MALAYSIA MYCOTOXIN DETOXIFIERS IN ANIMAL FEED MARKET, BY MYCOTOXIN DETOXIFIERS TYPE, 2018-2027 (USD MILLION)
TABLE 278 MALAYSIA FLAVORS & SWEETENERS IN ANIMAL FEED MARKET, BY FLAVORS & SWEETENERS TYPE, 2018-2027 (USD MILLION)
TABLE 279 MALAYSIA ANTIBIOTICS IN ANIMAL FEED MARKET, BY ANTIBIOTICS TYPE, 2018-2027 (USD MILLION)
TABLE 280 MALAYSIA MINERALS IN ANIMAL FEED MARKET, BY MINERALS TYPE, 2018-2027 (USD MILLION)
TABLE 281 MALAYSIA ANTIOXIDENTS IN ANIMAL FEED MARKET, BY ANTIOXIDENTS TYPE, 2018-2027 (USD MILLION)
TABLE 282 MALAYSIA NON-PROTEIN NITROGEN IN ANIMAL FEED MARKET, BY NON-PROTEIN NITROGEN TYPE, 2018-2027 (USD MILLION)
TABLE 283 MALAYSIA ANIMAL FEED MARKET, BY LIVESTOCK, 2018-2027 (USD MILLION)
TABLE 284 MALAYSIA RUMINANTS IN ANIMAL FEED MARKET, BY RUMINANTS LIVESTOCK, 2018-2027 (USD MILLION)
TABLE 285 MALAYSIA POULTRY IN ANIMAL FEED MARKET, BY POULTRY LIVESTOCK, 2018-2027 (USD MILLION)
TABLE 286 MALAYSIA SWINE IN ANIMAL FEED MARKET, BY SWINE LIVESTOCK, 2018-2027 (USD MILLION)
TABLE 287 MALAYSIA ANIMAL FEED MARKET, BY FORM, 2018-2027 (USD MILLION)
TABLE 288 MALAYSIA DRY IN ANIMAL FEED MARKET, BY DRY FORM, 2018-2027 (USD MILLION)
TABLE 289 MALAYSIA OTHERS IN DRY FORM IN ANIMAL FEED MARKET, BY OTHERS DRY FORM, 2018-2027 (USD MILLION)
TABLE 290 REST OF ASIA-PACIFIC ANIMAL FEED MARKET, BY TYPE, 2018-2027 (THOUSAND TONS)
TABLE 291 REST OF ASIA-PACIFIC ANIMAL FEED MARKET, BY TYPE, 2018-2027 (USD MILLION)
Lista de figuras
FIGURE 1 ASIA-PACIFIC ANIMAL FEED MARKET: SEGMENTATION
FIGURE 2 ASIA-PACIFIC ANIMAL FEED MARKET: DATA TRIANGULATION
FIGURE 3 ASIA-PACIFIC ANIMAL FEED MARKET: DROC ANALYSIS
FIGURE 4 ASIA-PACIFIC ANIMAL FEED MARKET : REGIONAL VS COUNTRY MARKET ANALYSIS
FIGURE 5 ASIA-PACIFIC ANIMAL FEED MARKET : COMPANY RESEARCH ANALYSIS
FIGURE 6 ASIA-PACIFIC ANIMAL FEED MARKET: THE TECHNOLOGY LIFE LINE CURVE
FIGURE 7 ASIA-PACIFIC ANIMAL FEED MARKET: INTERVIEW DEMOGRAPHICS
FIGURE 8 ASIA-PACIFIC ANIMAL FEED MARKET: DBMR MARKET POSITION GRID
FIGURE 9 ASIA-PACIFIC ANIMAL FEED MARKET: MARKET APPLICATION COVERAGE GRID
FIGURE 10 ASIA-PACIFIC ANIMAL FEED MARKET: THE MARKET CHALLENGE MATRIX
FIGURE 11 DRIVERS, RESTRAINTS, OPPORTUNITIES AND CHALLENGES OF ASIA-PACIFIC ANIMAL FEED MARKET
FIGURE 12 PROJECTED DEMAND GROWTH FOR DIFFERENT TYPES OF MEAT AND EGGS BY ASIAN SUBREGIONS FROM 2000 TO 2030
FIGURE 13 FEED CONVERSION RATION (FCR), BY LIVESTOCK TYPE (KILOGRAM PER ANIMAL)
FIGURE 14 INCIDENCE OF LIVESTOCK DISEASES IN INDIA (JAN TO OCT 2016)
FIGURE 15 PERCENTAGE SHARES IN NO. OF DAIRY COWS IN THAILAND, BY DAIRY FARM SIZE
FIGURE 16 PERCENTAGE SHARES IN NO. OF SWINES IN THAILAND, BY SWINE FARM SIZE
FIGURE 17 PERCENTAGE SHARES IN NO. OF CHICKENS IN THAILAND, BY CHICKEN FARM SIZE
FIGURE 18 PERCENTAGE SHARE OF VEGAN DIET FOLLOWERS WORLDWIDE IN 2016
FIGURE 19 PHYSICAL COMPOSITION OF UREA MOLASSES MINERAL SUPPLEMENTS
FIGURE 20 SOUTH KOREA ANNUAL INCIDENCE OUTBREAKS OF VECTOR-BORNE DISEASES, 2002-2006 (IN PERCENTAGE)
FIGURE 21 ASIA-PACIFIC ANIMAL FEED MARKET: SEGMENTATION
FIGURE 22 GROWING CONSUMPTION OF EDIBLE MEAT AND RAPIDLY INCREASING POPULATION OF PETS, AND DOMESTICATED ANIMALS IS DRIVING ASIA-PACIFIC ANIMAL FEED MARKET IN THE FORECAST PERIOD OF 2020 TO 2027
FIGURE 23 AMINO ACID IS EXPECTED TO ACCOUNT FOR THE LARGEST SHARE OF THE ASIA-PACIFIC ANIMAL FEED MARKET IN 2020 & 2027
FIGURE 24 ASIA-PACIFIC ANIMAL FEED MARKET: BY TYPE, 2019
FIGURE 25 ASIA-PACIFIC ANIMAL FEED MARKET: BY LIVESTOCK, 2019
FIGURE 26 ASIA-PACIFIC ANIMAL FEED MARKET: BY FORM, 2019
FIGURE 27 ASIA-PACIFIC ANIMAL FEED MARKET: SNAPSHOT (2019)
FIGURE 28 ASIA- PACIFIC ANIMAL FEED MARKET: BY COUNTRY (2019)
FIGURE 29 ASIA-PACIFIC ANIMAL FEED MARKET: BY COUNTRY (2020 & 2027)
FIGURE 30 ASIA-PACIFIC ANIMAL FEED MARKET : BY COUNTRY (2019 & 2027)
FIGURE 31 ASIA-PACIFIC ANIMAL FEED MARKET : BY TYPE (2020-2027)
FIGURE 32 ASIA-PACIFIC ANIMAL FEED MARKET: COMPANY SHARE 2018 (%)
Metodología de investigación
La recopilación de datos y el análisis del año base se realizan utilizando módulos de recopilación de datos con muestras de gran tamaño. La etapa incluye la obtención de información de mercado o datos relacionados a través de varias fuentes y estrategias. Incluye el examen y la planificación de todos los datos adquiridos del pasado con antelación. Asimismo, abarca el examen de las inconsistencias de información observadas en diferentes fuentes de información. Los datos de mercado se analizan y estiman utilizando modelos estadísticos y coherentes de mercado. Además, el análisis de la participación de mercado y el análisis de tendencias clave son los principales factores de éxito en el informe de mercado. Para obtener más información, solicite una llamada de un analista o envíe su consulta.
La metodología de investigación clave utilizada por el equipo de investigación de DBMR es la triangulación de datos, que implica la extracción de datos, el análisis del impacto de las variables de datos en el mercado y la validación primaria (experto en la industria). Los modelos de datos incluyen cuadrícula de posicionamiento de proveedores, análisis de línea de tiempo de mercado, descripción general y guía del mercado, cuadrícula de posicionamiento de la empresa, análisis de patentes, análisis de precios, análisis de participación de mercado de la empresa, estándares de medición, análisis global versus regional y de participación de proveedores. Para obtener más información sobre la metodología de investigación, envíe una consulta para hablar con nuestros expertos de la industria.
Personalización disponible
Data Bridge Market Research es líder en investigación formativa avanzada. Nos enorgullecemos de brindar servicios a nuestros clientes existentes y nuevos con datos y análisis que coinciden y se adaptan a sus objetivos. El informe se puede personalizar para incluir análisis de tendencias de precios de marcas objetivo, comprensión del mercado de países adicionales (solicite la lista de países), datos de resultados de ensayos clínicos, revisión de literatura, análisis de mercado renovado y base de productos. El análisis de mercado de competidores objetivo se puede analizar desde análisis basados en tecnología hasta estrategias de cartera de mercado. Podemos agregar tantos competidores sobre los que necesite datos en el formato y estilo de datos que esté buscando. Nuestro equipo de analistas también puede proporcionarle datos en archivos de Excel sin procesar, tablas dinámicas (libro de datos) o puede ayudarlo a crear presentaciones a partir de los conjuntos de datos disponibles en el informe.

