
Us Dental Bone Graft Market
Market Size in USD Million
 USD
408.60 Million
USD
1,092.07 Million
2025
2033
USD
408.60 Million
USD
1,092.07 Million
2025
2033
| 2026 - 2033 | |
| USD 408.60 Million | |
| USD 1,092.07 Million | |
| % | |
|
U.S. Dental Bone Graft Market Size
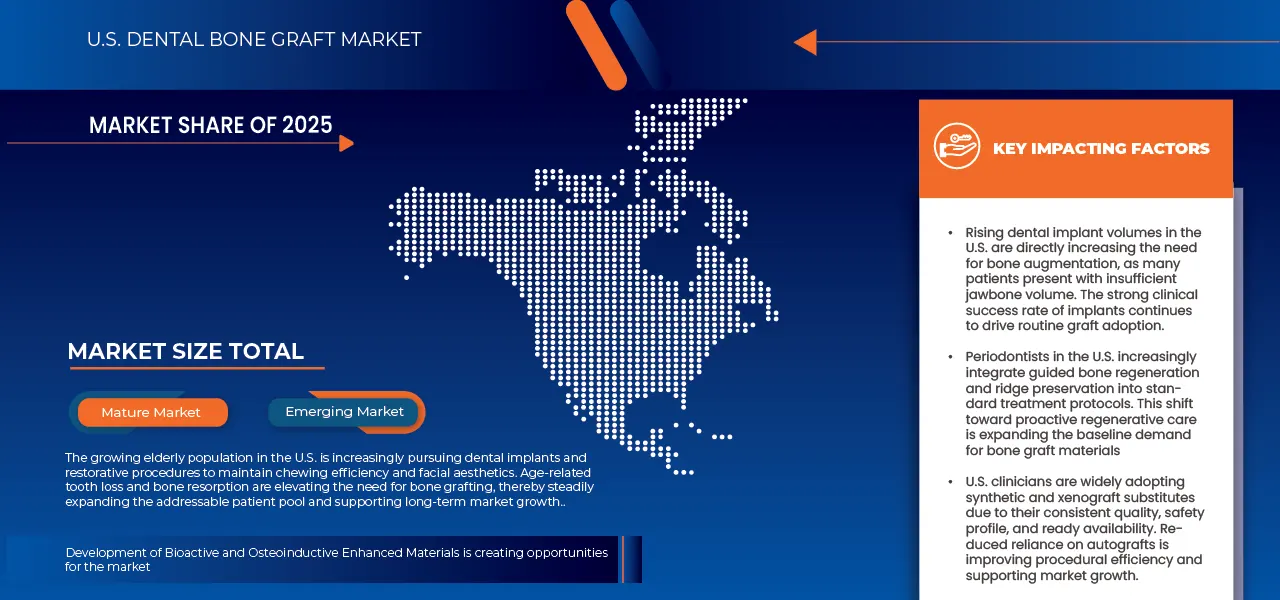
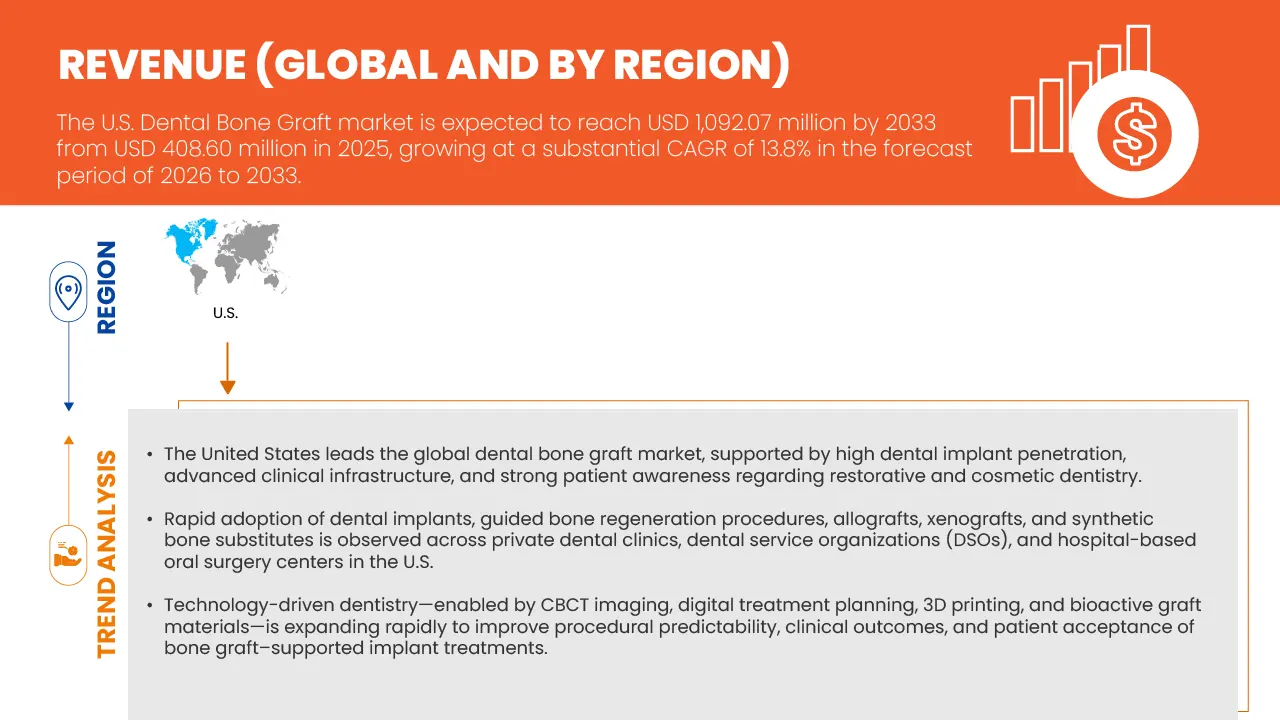
- The U.S. Dental Bone Graft Market size was valued at USD 408.60 million in 2025 and is expected to reach USD 1,092.07 million by 2033, at a CAGR of 13.8% during the forecast period
- The U.S. dental bone graft market is witnessing steady growth as patient preference increasingly shifts toward advanced, minimally invasive, and outcome-driven dental treatments. Rising adoption of dental implants, greater awareness of oral health, and emphasis on both functional and aesthetic outcomes are driving broader use of bone grafting procedures across urban and suburban dental practices. Technological improvements in graft materials and techniques are further supporting sustained expansion nationwide.
- Modern bone graft solutions, including synthetic, allograft, and xenograft materials, are positioned to provide improved healing, higher implant success rates, and enhanced patient satisfaction. Market growth is being supported by demographic trends such as an aging population, rising prevalence of periodontal disease and tooth loss, increasing patient willingness to invest in premium dental care, and evolving clinical practices that prioritize regenerative and long-term outcomes.
U.S. Dental Bone Graft Market Analysis
- A dental bone graft refers to a clinical procedure primarily focused on restoring and regenerating bone in the oral cavity to support dental implants and other restorative treatments. These procedures typically emphasize the use of advanced biomaterials, precise surgical techniques, and customized grafting approaches.
- Dental bone graft solutions are specifically positioned to deliver improved healing outcomes, enhanced implant stability, patient-specific treatment plans, and biocompatible materials, along with a clinical environment that supports patient comfort and long-term oral health.
- Technological advancements in biomaterials, 3D imaging and surgical planning, guided implant placement, regenerative matrices, and sterilization protocols have improved procedural consistency, graft integration, operational efficiency, and overall patient outcomes, enabling dental practices to offer personalized treatment plans, reduce complications, and enhance long-term success rate.
- Natural Bone Graft currently dominate the largest share of clinical preference at 54.51% in 2026, driven by increasing patient demand for natural, biocompatible grafts, predictable healing, minimized rejection risk, and high-quality surgical standards that elevate the overall success of dental implant and regenerative treatments.
Report Scope and U.S. Dental Bone Graft Market Segmentation
|
Attributes |
U.S. Dental Bone Graft Key Market Insights |
|
Segments Covered |
|
|
Countries Covered |
|
|
Key Market Players |
|
|
Market Opportunities |
|
|
Value Added Data Infosets |
In addition to the insights on market scenarios such as market value, growth rate, segmentation, geographical coverage, and major players, the market reports curated by the Data Bridge Market Research also include in-depth expert analysis, patient epidemiology, pipeline analysis, pricing analysis, and regulatory framework. |
U.S. Dental Bone Graft Market Trends
“Rising Adoption of Advanced and Premium Dental Bone Graft Procedures in the U.S. Market”
- The rapid growth of advanced and minimally invasive dental procedures is creating significant opportunities in the U.S. Dental Bone Graft Market. Increasing patient preference for high-quality, outcome-driven regenerative treatments, supported by rising awareness of oral health, improved dental care infrastructure, and lifestyle-driven demand for functional and aesthetic dental solutions, is accelerating the adoption of bone graft procedures across clinics and hospitals nationwide. Demand for regenerative solutions has surged in recent years, reflecting a shift toward premium, patient-centric treatment approaches.
- Dental practices play a critical role in delivering superior bone graft experiences through customized treatment plans, biocompatible graft materials, and advanced surgical techniques. High-quality graft solutions, including autografts, allografts, xenografts, and synthetic substitutes, enable faster healing, improved implant stability, and enhanced long-term outcomes, making them increasingly preferred by dental professionals and patients alike.
- Additionally, dental practices focus on quality infrastructure, such as 3D imaging, guided surgical planning, precision instrumentation, and optimized sterilization protocols, where procedural consistency, patient comfort, and clinical success are essential.
- Beyond standard procedures, the broader adoption of regenerative treatments in combination with implants, sinus lifts, ridge augmentations, and periodontal defect management supports convenience, clinical efficiency, and patient satisfaction.
- Therefore, as dental practices continue to expand service offerings, integrate advanced technologies, and enhance patient care experiences, the demand for premium and advanced dental bone graft procedures is expected to grow steadily, positioning the segment as a key trend area for the U.S. Dental Bone Graft Market.
U.S. Dental Bone Graft Market Dynamics
Driver
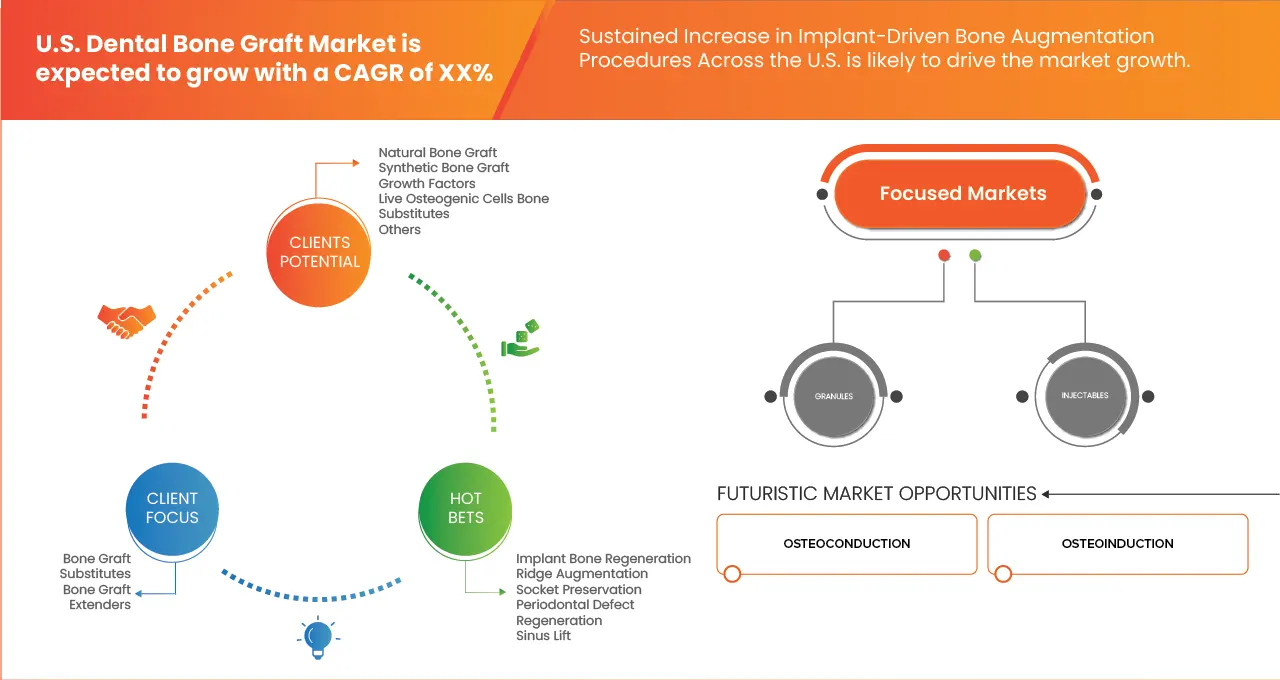
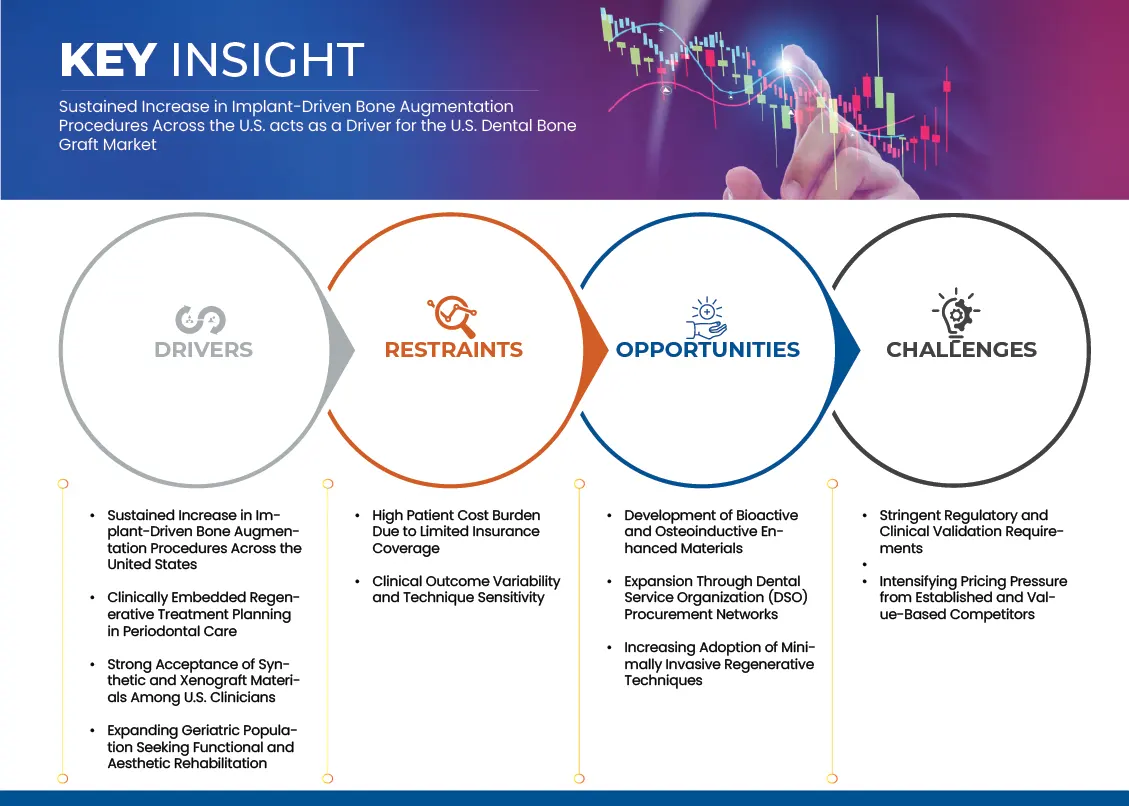
“Sustained Increase in Implant-Driven Bone Augmentation Procedures Across the United States”
- Rising patient demand for high-quality, predictable, and clinically effective bone graft procedures is a key driver of the U.S. Dental Bone Graft Market, particularly among urban and aging demographics. Patients and dental professionals are increasingly prioritizing advanced regenerative techniques and biocompatible graft materials while seeking long-term functional and aesthetic outcomes.
- Advanced bone graft solutions provide an optimal combination of predictable healing, enhanced implant stability, and clinical reliability, making them well-suited for patients and practitioners seeking premium treatment outcomes with minimal complications.
- These procedures are widely performed in autograft, allograft, xenograft, and synthetic graft formats, where material quality, surgical precision, and integration success directly influence clinical results and patient satisfaction.
- In addition, the emphasis on procedural consistency, customized treatment planning, and high-quality surgical techniques enhances patient confidence, treatment adoption, and long-term oral health outcomes. As awareness of advanced regenerative options grows and patients focus on functional and aesthetic results, dental practices are expanding their implant-driven graft offerings to meet evolving needs.
- This continued shift toward advanced, patient-specific, and clinically reliable bone graft procedures is expected to sustain strong demand for implant-based regenerative treatments, supporting long-term market growth.
Restraint/Challenge
“Stringent Regulatory and Clinical Validation Requirements”
- Increasing competition from established dental implant and graft solution providers is emerging as a key challenge for the U.S. Dental Bone Graft Market. These companies leverage brand recognition, extensive distribution networks, and clinical credibility to attract dental practices seeking reliable, high-quality graft materials and procedures.
- Competitive pressure from large suppliers has intensified scrutiny on smaller or emerging bone graft manufacturers, requiring them to differentiate through material innovation, clinical outcomes, and procedural support.
- Additionally, large providers benefit from economies of scale, robust supply chain management, and consistent product quality, making it difficult for smaller suppliers to compete on cost, availability, and clinical reliability.
- As dental professionals’ awareness of advanced, high-quality graft solutions grows, smaller manufacturers face rising expectations to match or exceed the offerings of major players, including innovative biomaterials, comprehensive training, and procedural guidance.
- Rising market penetration and aggressive expansion by established suppliers also create challenges for market access, customer adoption, and long-term partnership development for smaller manufacturers.
- Furthermore, maintaining high standards of clinical validation, regulatory compliance, and graft performance in the face of competitive pricing pressures increases operational costs, potentially limiting profitability and slowing growth. Collectively, these regulatory, operational, and competitive pressures may influence growth trajectories for emerging bone graft suppliers.
U.S. Dental Bone Graft Market Scope
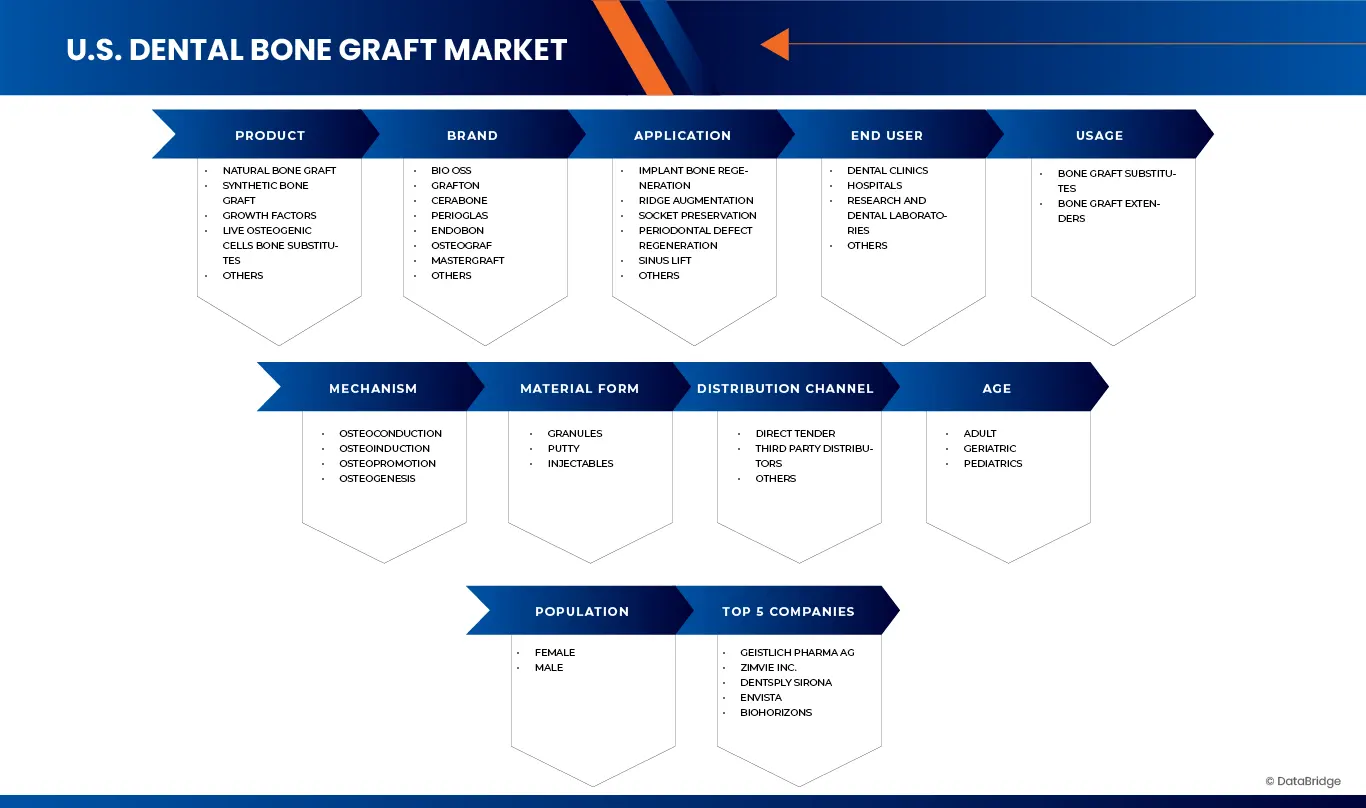
U.S. Dental Bone Graft market is categorized into ten notable segments which are based on product, brand, application, usage, mechanism, material form, age, population type, end user, and distribution channel.
- By Product
On the basis of product, the Global Dental Bone Graft market is segmented into Synthetic Bone Graft, Natural Bone Graft, Live Osteogenic Cells Bone Substitutes, Growth Factors, and Others.
The Natural Bone Graft segment dominated the largest market revenue share of 54.34% in 2025, driven by its exceptional biocompatibility, predictable healing outcomes, and wide clinical adoption, making it indispensable for dental practices focusing on high-quality, patient-centric regenerative treatments.
The Growth Factors segment is anticipated to witness the fastest CAGR of 13.6% from 2026 to 2033, fueled by escalating demand for enhanced bone regeneration, faster healing, and improved implant stability, particularly among patients with complex defects or compromised bone quality, where bioactive factors excel in delivering superior clinical outcomes.
- By brand
On the basis of brand, the Global Dental Bone Graft market is segmented into Bio-Oss, Grafton, Cerabone, Perioglas, Endobon, Osteograf, Mastergraft, and Others.
The Bio OSS segment dominated the largest market revenue share of 14.05% in 2025, driven by its exceptional biocompatibility, ease of handling, and consistent clinical performance, making it indispensable for dental practices focusing on high-quality, patient-centric bone regeneration procedures.
The Bio OSS segment is anticipated to witness the fastest CAGR of 19.8% from 2026 to 2033, fueled by escalating adoption for implant support, periodontal defect management, and ridge augmentation, particularly among practices seeking reliable, ready-to-use graft materials that enhance procedural efficiency and clinical outcomes.
- By Application
On the basis of application, the Global Dental Bone Graft market is segmented into Socket Preservation, Ridge Augmentation, Periodontal Defect Regeneration, Implant Bone Regeneration, Sinus Lift, and Others.
The Implant Bone Regeneration segment dominated the largest market revenue share of 28.77% in 2025, driven by its critical role in ensuring implant stability, predictable bone integration, and high clinical success rates, making it indispensable for dental practices focusing on advanced implant-supported restorative procedures.
The Periodontal Defect Regeneration segment is anticipated to witness the fastest CAGR of 15.2% from 2026 to 2033, fueled by escalating adoption for treatment of periodontal disease, alveolar bone loss, and complex oral defects, particularly among practices seeking targeted regenerative solutions that enhance patient outcomes and long-term oral health.
- By Usage
On the basis of usage, the Global Dental Bone Graft market is segmented into Bone Graft Substitutes and Bone Graft Extenders.
The Bone Graft Substitutes segment dominated the largest market revenue share of 76.85% in 2025, driven by its versatility, biocompatibility, and predictable regenerative performance, making it indispensable for dental practices focusing on reliable and efficient bone augmentation procedures.
The Bone Graft Substitutes segment is anticipated to witness the fastest CAGR of 13.9% from 2026 to 2033, fueled by escalating adoption for implant support, ridge augmentation, and periodontal defect management, particularly among practices seeking ready-to-use solutions that enhance clinical outcomes and procedural efficiency.
- By Mechanism
On the basis of mechanism, the Global Dental Bone Graft market is segmented into Osteoconduction, Osteoinduction, Osteopromotion, and Osteogenesis.
The Osteoconduction segment dominated the largest market revenue share of 76.51% in 2025, driven by its ability to provide a scaffold for new bone growth, predictable integration, and consistent clinical outcomes, making it indispensable for dental practices focusing on structured and reliable bone regeneration.
The Osteogenesis segment is anticipated to witness the fastest CAGR of 16.5% from 2026 to 2033, fueled by increasing adoption for complex bone defects, implant support, and alveolar reconstruction, particularly among practices seeking graft solutions that actively stimulate new bone formation and enhance long-term implant success.
- By Material Form
On the basis of material form, the Global Dental Bone Graft market is segmented into Injectables, Granules, and Putty.
The Granules segment dominated the largest market revenue share of 44.37% in 2025, driven by its ease of handling, adaptability to diverse defect sites, and consistent bone integration, making it indispensable for dental practices focusing on effective and predictable regenerative procedures.
The Injectables segment is anticipated to witness the fastest CAGR of 14.1% from 2026 to 2033, fueled by increasing adoption for minimally invasive applications, precise defect filling, and enhanced patient comfort, particularly among practices seeking convenient, ready-to-use graft solutions that optimize clinical outcomes and procedural efficiency.
- By Age
On the basis of age, the Global Dental Bone Graft market is segmented into Pediatrics, Adult, and Geriatric.
The Adult segment dominated the largest market revenue share of 59.87% in 2025, driven by higher prevalence of dental implant procedures, periodontal disease, and tooth loss in the adult population, making it indispensable for dental practices focusing on regenerative treatments for mature patients..
The Pediatrics segment is anticipated to witness the fastest CAGR of 13.7% from 2026 to 2033, fueled by increasing adoption of early intervention for congenital defects, trauma management, and alveolar bone preservation, particularly among pediatric dental practices seeking safe, effective, and minimally invasive graft solutions.
- By Population
On the basis of population type, the Global Dental Bone Graft market is segmented into Male and Female.
The Female segment dominated the largest market revenue share of 53.69% in 2025, driven by higher awareness of oral health, cosmetic dentistry adoption, and preference for preventive and regenerative dental procedures, making it indispensable for dental practices focusing on patient-centric treatments.
The Male segment is anticipated to witness the fastest CAGR of 13.5% from 2026 to 2033, fueled by increasing adoption of implant-supported restorations, periodontal defect management, and bone graft procedures, particularly among patients seeking functional and long-term dental solutions.
- By End User
On the basis of end user, the Global Dental Bone Graft market is segmented into Hospitals, Dental Clinics, Research and Dental Laboratories, and Others.
The Dental Clinics segment dominated the largest market revenue share of 72.15% in 2025, driven by widespread adoption of implant-supported restorations, periodontal treatments, and bone graft procedures, making it indispensable for practices focusing on high-quality, patient-centric dental care.
The Research and Dental Laboratories segment is anticipated to witness the fastest CAGR of 15.2% from 2026 to 2033, fueled by increasing investment in biomaterials development, regenerative solutions, and clinical trials, particularly among institutions and labs seeking innovative graft technologies and advanced procedural outcomes.
- By Distribution Channel
On the basis of distribution channel, the Global Dental Bone Graft market is segmented into Direct Tender, Third Party Distributors, and Others.
The Direct Tender segment dominated the largest market revenue share of 59.02% in 2025, driven by streamlined procurement processes, bulk ordering efficiency, and strong institutional partnerships, making it indispensable for dental practices and hospitals seeking reliable and cost-effective bone graft supplies.
The Others segment is anticipated to witness the fastest CAGR of 14.3% from 2026 to 2033, fueled by increasing adoption of alternative distribution methods, emerging e-commerce platforms, and specialized regional suppliers, particularly among smaller clinics and laboratories seeking flexible and innovative supply solutions.
U.S. Dental Bone Graft Market Players
The U.S. Dental Bone Graft Market is primarily led by well-established companies, including:
- Geistlich Pharma AG (Switzerland)
- botiss biomaterials GmbH (Germany)
- ZimVie Inc. (U.S.)
- Dentsply Sirona (Symbios) (U.S.)
- Nobel Biocare (Envista) (Switzerland)
- BioHorizons Camlog (U.S. & Switzerland)
- Osstem Implant Co., Ltd. (South Korea)
- Dentium (South Korea)
- Mega’Gen Implant Co., Ltd. (South Korea)
- Purgo Biologics Inc. (South Korea)
- Regenity Biosciences (U.S.)
- NovaBone (U.S.)
- Impladent Ltd. (U.S.)
- Curasan AG (Switzerland)
- LifeNet Health (U.S.)
- MTF Biologics (U.S.)
- Evergen (formerly RTI Surgical) (U.S.)
- SigmaGraft Biomaterials (U.S.)
- Augma Biomaterials Ltd. (U.S.)
- Keystone Dental Group (U.S.)
- Orthogen, LLC (U.S.)
Latest Developments in the Middle East and Africa Nickel Alloy Market
- In November 2025, Geistlich Pharma AG expanded its portfolio and entered new markets by launching 20 innovative regenerative biomaterial products across over 40 countries. This development strengthens Geistlich’s position in dental and orthopedic regeneration by providing specialists, dental service organizations, and general dentists with advanced solutions such as Geistlich Bio-Oss, Geistlich Bio-Oss Collagen, Geistlich Bio-Gide Forte, Geistlich Vallomix, and Geistlich Combi-Kit. These products are designed to improve clinical outcomes, simplify handling, and increase patient access to quality regenerative therapies worldwide.
- In July 2025, ZimVie Inc. entered into an exclusive distribution agreement with Osstem Implant Co., Ltd. to expand its premium dental implant portfolio in China. Under the agreement, Osstem assumes exclusive commercial responsibility for ZimVie’s implant systems in the Chinese market, leveraging its extensive distribution network and strong presence across more than 90 cities. This development is intended to strengthen ZimVie’s global footprint, improve customer access to its precision-engineered implant solutions, and capitalize on the rapidly growing Chinese dental implant market.
- In July 2024, Dentsply Sirona announced the renewal and enhancement of its Symbios allograft product line, emphasizing improved sterility standards and clinical versatility. The updated portfolio introduces advanced granule and putty bone graft formats designed to support predictable bone regeneration across a wide range of dental and implant procedures. The refreshed products are manufactured under stringent safety protocols and offered in multiple granule sizes and configurations to enhance handling and clinical performance. This development reinforces the company’s commitment to delivering high-quality regenerative solutions that improve surgical outcomes and procedural flexibility
- In May 2022, Envista Holdings Corporation announced a definitive agreement to acquire the Osteogenics Biomedical business, including Osteogenics Biomedical, Allotech, and OBI Biologics, to strengthen its regenerative solutions portfolio in implant dentistry. Osteogenics is recognized for its Cytoplast-branded bone grafting and membrane technologies used by periodontists and oral surgeons to support implant-based tooth replacement procedures. The acquisition aligns with Envista’s strategy to expand capabilities in regenerative therapies and advance its broader vision of digitizing, personalizing, and democratizing oral care.
- In July 2022, Envista Holdings Corporation announced an extension and expansion of its commercial partnership with dentalcorp Holdings Ltd. to broaden access to implant treatments across dentalcorp’s network of more than 500 dental practices in Canada. This strategic collaboration strengthens Envista’s implant solutions footprint—supported by its Nobel Biocare portfolio—while enabling dentalcorp clinicians to deliver advanced implant care at scale, thereby accelerating adoption of premium implant workflows and improving patient access to comprehensive restorative solutions nationwide
- In November 2021, botiss biomaterials GmbH announced the development of cerabone +HyA, an innovative bone substitute material that combines its established bovine bone graft (cerabone) with hyaluronic acid to create a cohesive “sticky bone” formulation. Upon hydration, the hyaluronate component enables strong liquid binding and improved handling, allowing easy uptake and precise placement at the defect site while supporting tissue regeneration. This advancement expands botiss’ regenerative portfolio by enhancing clinical convenience and performance in bone augmentation procedures.
- In December 2022, Novaxomx GmbH; a subsidiary of CURASAN AG; secured an exclusive license agreement with Lysatpharma to use its patented exosome technology for the development of biologically enhanced bone graft materials. This technology integrates bioactive exosomes with osteoconductive carriers to improve intercellular communication critical for tissue regeneration. The partnership is expected to accelerate innovation in regenerative therapies, helping Novaxomx and CURASAN AG expand their product pipeline and clinical impact.
SKU-

- Interactive Data Analysis Dashboard
- Company Analysis Dashboard for high growth potential opportunities
- Research Analyst Access for customization & queries
- Competitor Analysis with Interactive dashboard
- Latest News, Updates & Trend analysis
- Harness the Power of Benchmark Analysis for Comprehensive Competitor Tracking
Table of Content
1 INTRODUCTION
1.1 OBJECTIVES OF THE STUDY
1.2 MARKET DEFINITION
1.3 OVERVIEW OF U.S. DENTAL BONE GRAFT MARKET
1.4 LIMITATIONS
1.5 MARKETS COVERED
2 MARKET SEGMENTATION
2.1 MARKETS COVERED
2.2 GEOGRAPHICAL SCOPE
2.3 YEARS CONSIDERED FOR THE STUDY
2.4 CURRENCY AND PRICING
2.5 DBMR TRIPOD DATA VALIDATION MODEL
2.6 MULTIVARIATE MODELLING
2.7 PRIMARY INTERVIEWS WITH KEY OPINION LEADERS
2.8 DBMR MARKET POSITION GRID
2.9 MARKET APPLICATION COVERAGE GRID
2.1 SECONDARY SOURCES
2.11 ASSUMPTIONS
3 EXECUTIVE SUMMARY
4 PREMIUM INSIGHTS
4.1 PESTEL ANALYSIS
4.2 CLIMATE CHANGE SCENARIO–
4.2.1 INTRODUCTION
4.2.2 ENVIRONMENTAL CONCERNS
4.2.3 INDUSTRY RESPONSE
4.2.4 GOVERNMENT’S ROLE
4.2.5 ANALYST RECOMMENDATIONS
4.2.6 CONCLUSION
4.3 COST ANALYSIS BREAKDOWN–
4.3.1 INTRODUCTION
4.3.2 PRODUCTION COST ANALYSIS
4.3.2.1 RAW MATERIAL PROCUREMENT
4.3.2.2 MANUFACTURING & PROCESSING
4.3.2.3 REGULATORY COMPLIANCE & QUALITY ASSURANCE
4.3.3 DISTRIBUTION COST ANALYSIS
4.3.3.1 LOGISTICS & STORAGE
4.3.3.2 SUPPLY CHAIN INTERMEDIARIES
4.3.3.3 INVENTORY MANAGEMENT
4.3.4 COMMERCIAL PRICING DYNAMICS
4.3.4.1 PRICING STRATEGY & LIST PRICE DETERMINATION
4.3.4.2 INSURANCE & REIMBURSEMENT INFLUENCE
4.3.4.3 MARKET COMPETITION & CONTRACT PRICING
4.3.5 CONCLUSION
4.4 INDUSTRY ECOSYSTEM ANALYSIS
4.4.1 INTRODUCTION
4.4.2 PROMINENT COMPANIES
4.4.3 SMALL & MEDIUM SIZE COMPANIES
4.4.4 END USERS
4.4.5 CONCLUSION
4.5 INNOVATION TRACKER AND STRATEGIC ANALYSIS
4.5.1 INTRODUCTION
4.5.2 MAJOR DEALS AND STRATEGIC ALLIANCES ANALYSIS
4.5.2.1 JOINT VENTURES
4.5.2.2 MERGERS AND ACQUISITIONS
4.5.2.3 LICENSING AND PARTNERSHIP’
4.5.2.4 TECHNOLOGY COLLABORATIONS
4.5.2.5 STRATEGIC DIVESTMENTS
4.5.3 NUMBER OF PRODUCTS IN DEVELOPMENT
4.5.4 STAGE OF DEVELOPMENT
4.5.5 TIMELINES AND MILESTONES
4.5.6 INNOVATION STRATEGIES AND METHODOLOGIES
4.5.7 RISK ASSESSMENT AND MITIGATION
4.5.8 FUTURE OUTLOOK
4.5.9 CONCLUSION
4.6 NUMBER OF PROCEDURES-
4.6.1 TOTAL NUMBER OF DENTAL BONE GRAFT PROCEDURES FOR DENTAL IMPLANT PLACEMENT
4.6.2 NUMBER OF EXTRACTION SOCKET GRAFTING PROCEDURES
4.6.3 NUMBER OF SINUS LIFT PROCEDURES
4.6.4 NUMBER OF VERTICAL AND/OR LATERAL RIDGE AUGMENTATION PROCEDURES
4.6.5 OTHER RELEVANT DENTAL BONE GRAFTING PROCEDURE DATA
4.7 PATENT ANALYSIS–
4.7.1 INTRODUCTION
4.7.2 PATENT QUALITY AND STRENGTH
4.7.3 PATENT FAMILIES
4.7.4 LICENSING AND COLLABORATIONS
4.7.5 REGIONAL PATENT LANDSCAPE
4.7.6 IP STRATEGY AND MANAGEMENT
4.7.7 CONCLUSION
4.8 RAW MATERIAL COVERAGE
4.8.1 SYNTHETIC BONE GRAFTS
4.8.2 NATURAL BONE GRAFTS
4.8.3 CELL-BASED AND GROWTH FACTOR ENHANCEMENTS
4.9 BRAND OUTLOOK
4.1 VENDOR SELECTION CRITERIA
4.10.1 REGULATORY & COMPLIANCE CREDENTIALS
4.10.2 CLINICAL PERFORMANCE & EVIDENCE
4.10.3 MATERIAL QUALITY & TRACEABILITY
4.10.4 RANGE & CUSTOMIZATION OF PRODUCT PORTFOLIO
4.10.5 QUALITY ASSURANCE & MANUFACTURING STANDARDS
4.10.6 SUPPLY CHAIN RELIABILITY & LOGISTICS
4.10.7 COMMERCIAL VALUE & PRICING STRUCTURE
4.10.8 SUPPORT SERVICES & TRAINING
4.10.9 REPUTATION & MARKET PRESENCE
4.10.10 POST‑PURCHASE SUPPORT & WARRANTY
4.10.11 SUMMARY OF KEY CATEGORIES FOR U.S. VENDOR SELECTION CRITERIA:
4.11 TECHNOLOGICAL ADVANCEMENTS
4.11.1 OVERVIEW
4.11.2 3D IMAGING AND TREATMENT PLANNING
4.11.3 GROWTH FACTORS AND STEM CELL THERAPY
4.11.4 BONE GRAFTING WITH PLATELET-RICH PLASMA (PRP)
4.11.5 INNOVATIVE BONE GRAFTING TECHNIQUES
4.11.6 CUTTING-EDGE GRAFTING MATERIALS
4.11.7 IMPLICATIONS FOR PATIENTS:
4.11.8 SUMMARY:
4.12 PRICING ANALYSIS
4.12.1 INTRODUCTION
4.12.2 NATURAL BONE GRAFT (ALLOGRAFTS & XENOGRAFTS)
4.12.3 SYNTHETIC BONE GRAFT
4.12.4 GROWTH FACTORS (E.G., RHBMP-2 BASED PRODUCTS)
4.12.5 LIVE OSTEOGENIC CELLS BONE SUBSTITUTES (CELLULAR BONE MATRICES)
4.12.6 OTHERS (COLLAGEN MEMBRANES, COMBINATION KITS, PUTTY CARRIERS)
4.12.7 CONCLUSION
4.13 PROFIT MARGINS SCENARIO
4.13.1 INTRODUCTION
4.13.2 GROSS MARGIN STRUCTURE AND COST ARCHITECTURE
4.13.3 PRICING STRATEGY AND VALUE-BASED MARGIN PRESERVATION
4.13.4 REGULATORY COMPLIANCE AND ITS INFLUENCE ON OPERATING MARGINS
4.13.5 DISTRIBUTION ECONOMICS AND NET PROFIT REALIZATION
4.13.6 COMPETITIVE LANDSCAPE AND LONG-TERM MARGIN SUSTAINABILITY
4.13.7 CONCLUSION
4.14 SUPPLY CHAIN ANALYSIS –
4.14.1 INTRODUCTION
4.14.2 RAW INPUT SOURCING & PROCUREMENT
4.14.3 PROCESSING & PRODUCT MANUFACTURING (PRODUCTION)
4.14.4 SUPPLY CHAIN & DISTRIBUTION LOGISTICS (TRANSPORTATION)
4.14.5 RETAIL & COMMERCIAL BUYER CHANNELS (DISTRIBUTION & SALES)
4.14.6 CONCLUSION
4.15 VALUE CHAIN ANALYSIS
4.15.1 INBOUND LOGISTICS
4.15.2 OPERATIONS
4.15.3 OUTBOUND LOGISTICS
4.15.4 MARKETING AND SALES
4.15.5 AFTER-SALES SERVICE
5 TARIFFS & IMPACT–
5.1 INTRODUCTION
5.2 OUTLOOK: LOCAL PRODUCTION V/S IMPORT RELIANCE
5.3 VENDOR SELECTION CRITERIA DYNAMICS
5.4 IMPACT ON SUPPLY CHAIN
5.4.1 RAW MATERIAL PROCUREMENT
5.4.2 MANUFACTURING AND PRODUCTION
5.4.3 LOGISTICS AND DISTRIBUTION
5.4.4 PRICE PITCHING AND POSITION OF MARKET
5.5 INDUSTRY PARTICIPANTS: PROACTIVE MOVES
5.5.1 SUPPLY CHAIN OPTIMIZATION
5.5.2 JOINT VENTURE ESTABLISHMENTS
5.6 IMPACT ON PRICES
5.7 REGULATORY INCLINATION
5.7.1 GEOPOLITICAL SITUATION
5.7.2 TRADE PARTNERSHIPS BETWEEN THE COUNTRIES
5.7.2.1 FREE TRADE AGREEMENTS
5.7.2.2 ALLIANCE ESTABLISHMENTS
5.7.2.3 STATUS ACCREDITATION (INCLUDING MFN)
5.7.3 DOMESTIC COURSE OF CORRECTION
5.7.3.1 INCENTIVE SCHEMES TO BOOST PRODUCTION OUTPUTS
5.7.3.2 ESTABLISHMENT OF SPECIAL ECONOMIC ZONES / INDUSTRIAL PARKS
5.8 CONCLUSION
6 REGULATION COVERAGE–
6.1 INTRODUCTION
6.2 PRODUCT CODES
6.2.1 CERTIFIED STANDARDS
6.3 SAFETY STANDARDS
6.3.1 MATERIAL HANDLING & STORAGE
6.3.2 TRANSPORT & PRECAUTIONS
6.3.3 HAZARD IDENTIFICATION
6.4 CONCLUSION
7 MARKET OVERVIEW
7.1 DRIVERS
7.1.1 SUSTAINED INCREASE IN IMPLANT-DRIVEN BONE AUGMENTATION PROCEDURES ACROSS THE U.S.
7.1.2 CLINICALLY EMBEDDED REGENERATIVE TREATMENT PLANNING IN PERIODONTAL CARE.
7.1.3 STRONG ACCEPTANCE OF SYNTHETIC AND XENOGRAFT MATERIALS AMONG U.S. CLINICIANS
7.1.4 EXPANDING GERIATRIC POPULATION SEEKING FUNCTIONAL AND AESTHETIC REHABILITATION
7.2 RESTRAINTS
7.2.1 HIGH PATIENT COST BURDEN DUE TO LIMITED INSURANCE COVERAGE.
7.2.2 CLINICAL OUTCOME VARIABILITY AND TECHNIQUE SENSITIVITY
7.3 OPPORTUNITIES
7.3.1 DEVELOPMENT OF BIOACTIVE AND OSTEOINDUCTIVE ENHANCED MATERIALS
7.3.2 EXPANSION THROUGH DENTAL SERVICE ORGANIZATION (DSO) PROCUREMENT NETWORKS
7.3.3 INCREASING ADOPTION OF MINIMALLY INVASIVE REGENERATIVE TECHNIQUES
7.4 CHALLENGES
7.4.1 STRINGENT REGULATORY AND CLINICAL VALIDATION REQUIREMENTS
7.4.2 INTENSIFYING PRICING PRESSURE FROM ESTABLISHED AND VALUE-BASED COMPETITORS
8 U.S. DENTAL BONE GRAFT MARKET, BY PRODUCT
8.1 OVERVIEW
8.2 NATURAL BONE GRAFT
8.2.1 U.S. NATURAL BONE GRAFT IN DENTAL BONE GRAFT MARKET, BY TYPE, 2018-2033 (USD THOUSAND)
8.2.1.1 XENOGRAFT
8.2.1.1.1 U.S. XENOGRAFT IN DENTAL BONE GRAFT MARKET, BY TYPE, 2018-2033 (USD THOUSAND)
8.2.1.1.1.1 BOVINE-DERIVED
8.2.1.1.1.2 PORCINE-DERIVED
8.2.1.1.1.3 CHITOSAN DERIVED
8.2.1.1.1.4 OTHERS
8.2.1.2 ALLOGRAFT
8.2.1.2.1 U.S. ALLOGRAFT IN DENTAL BONE GRAFT MARKET, BY TYPE, 2018-2033 (USD THOUSAND)
8.2.1.2.1.1 FRESH OR FRESH-FROZEN BONE
8.2.1.2.1.2 U.S. FRESH OR FRESH-FROZEN BONE IN DENTAL BONE GRAFT MARKET, BY TYPE, 2018-2033 (USD THOUSAND)
8.2.1.2.1.3 DEMINERALISED BONE ALLOGRAFT
8.2.1.2.1.4 OCELLULAR BONE ALLOGRAFTS
8.2.1.2.1.5 MACHINED ALLOGRAFTS
8.2.1.2.1.6 U.S. FRESH OR FRESH-FROZEN BONE IN DENTAL BONE GRAFT MARKET, BY USABILITY, 2018-2033 (USD THOUSAND)
8.2.1.2.1.7 BIO-REABSORBABLE
8.2.1.2.1.8 NON BIO-REABSORBABLE
8.2.1.2.1.9 FREEZE DRIED BONE ALLOGRAFT (FDBA)
8.2.1.2.1.10 U.S. FREEZE DRIED BONE ALLOGRAFT (FDBA) IN DENTAL BONE GRAFT MARKET, BY TYPE, 2018-2033 (USD THOUSAND)
8.2.1.2.1.11 DEMINERALISED BONE ALLOGRAFT
8.2.1.2.1.12 OCELLULAR BONE ALLOGRAFTS
8.2.1.2.1.13 MACHINED ALLOGRAFTS
8.2.1.2.1.14 U.S. FREEZE DRIED BONE ALLOGRAFT (FDBA) IN DENTAL BONE GRAFT MARKET, BY USABILITY, 2018-2033 (USD THOUSAND)
8.2.1.2.1.15 BIO-REABSORBABLE
8.2.1.2.1.16 NON BIO-REABSORBABLE
8.2.1.3 AUTOGRAFTS
8.2.1.3.1 U.S. AUTOGRAFTS IN DENTAL BONE GRAFT MARKET, BY TYPE, 2018-2033 (USD THOUSAND)
8.2.1.3.1.1 MANDIBULAR SYMPHYSIS
8.2.1.3.1.2 MANDIBULAR RAMUS
8.2.1.3.1.3 ILIAC CREST
8.2.1.3.1.4 EXTERNAL OBLIQUE RIDGE
8.2.1.3.1.5 PROXIMAL ULNA
8.2.1.3.1.6 DISTAL RADIUS
8.2.1.4 PHYTOGENIC MATERIALS
8.2.1.4.1 U.S. PHYTOGENIC MATERIALS IN DENTAL BONE GRAFT MARKET, BY TYPE, 2018-2033 (USD THOUSAND)
8.2.1.4.1.1 CORAL-BASED BONE SUBSTITUTES
8.2.1.4.1.2 MARINE ALGAE
8.2.1.4.1.3 GUSUBU
8.3 SYNTHETIC BONE GRAFT
8.3.1 U.S. SYNTHETIC BONE GRAFT IN DENTAL BONE GRAFT MARKET, BY TYPE, 2018-2033 (USD THOUSAND)
8.3.2 TRICALCIUM PHOSPHATE CERAMICS
8.3.3 HYDROXYAPATITE
8.3.4 BIPHASIC CALCIUM PHOSPHATE CERAMICS
8.3.5 BIOACTIVE GLASS
8.3.6 POLYMERS
8.3.6.1 U.S. POLYMERS IN DENTAL BONE GRAFT MARKET, BY USABILITY, 2018-2033 (USD THOUSAND)
8.3.6.1.1 DEGRADABLE
8.3.6.1.2 NON-DEGRADABLE
8.3.6.2 U.S. POLYMERS IN DENTAL BONE GRAFT MARKET, BY TYPE, 2018-2033 (USD THOUSAND)
8.3.6.2.1 POLYLACTIC ACID
8.3.6.2.2 POLY-Ε-CAPROLACTONE
8.3.6.2.3 POLYGLYCOLIC ACID
8.3.6.2.4 OTHERS
8.3.7 CALCIUM PHOSPHATE CEMENT
8.3.8 CALCIUM-PHOSPHOSILICATE
8.3.9 COMPOSITES
8.3.9.1 U.S. COMPOSITES IN DENTAL BONE GRAFT MARKET, BY TYPE, 2018-2033 (USD THOUSAND)
8.3.9.1.1 NANOCRYSTALLINE HA/SILICON DIOXIDE
8.3.9.1.2 Β-TCP/CALCIUM SULPHATE
8.3.10 METALS
8.3.10.1 U.S. METALS IN DENTAL BONE GRAFT MARKET, BY TYPE, 2018-2033 (USD THOUSAND)
8.3.10.1.1 MAGNESIUM (MG)
8.3.10.1.2 STRONTIUM (SR)
8.3.10.1.3 ZINC (ZN)
8.3.10.1.4 SILICON (SI)
8.4 GROWTH FACTORS
8.4.1 U.S. GROWTH FACTORS IN DENTAL BONE GRAFT MARKET, BY TYPE, 2018-2033 (USD THOUSAND)
8.4.1.1 BONE MORPHOGENETIC PROTEIN (BMP)
8.4.1.2 PLATELET-DERIVED GROWTH FACTOR (PDGF)
8.4.1.3 TRANSFORMING GROWTH FACTOR-BETA (TGF-BETA)
8.4.1.4 FIBROBLAST GROWTH FACTORS (FGF)
8.5 LIVE OSTEOGENIC CELLS BONE SUBSTITUTES
8.5.1 U.S. LIVE OSTEOGENIC CELLS BONE SUBSTITUTES IN DENTAL BONE GRAFT MARKET, BY TYPE, 2018-2033 (USD THOUSAND)
8.5.1.1 OSTEOTRANSPLANT DENT
8.5.1.2 BIOSEED-ORAL BONE
8.6 OTHERS
9 U.S. DENTAL BONE GRAFT MARKET, BY BRAND
9.1 OVERVIEW
9.2 BIO OSS
9.3 GRAFTON
9.4 CERABONE
9.5 PERIOGLAS
9.6 ENDOBON
9.7 OSTEOGRAF
9.8 MASTERGRAFT
9.9 OTHERS
10 U.S. DENTAL BONE GRAFT MARKET, BY APPLICATION
10.1 OVERVIEW
10.2 IMPLANT BONE REGENERATION
10.2.1 U.S. IMPLANT BONE REGENERATION IN DENTAL BONE GRAFT MARKET, BY TYPE, 2018-2033 (USD THOUSAND)
10.2.1.1 NATURAL BONE GRAFT
10.2.1.1.1 U.S. NATURAL BONE GRAFT IN DENTAL BONE GRAFT MARKET, BY TYPE, 2018-2033 (USD THOUSAND)
10.2.1.1.1.1 XENOGRAFT
10.2.1.1.1.2 ALLOGRAFT
10.2.1.1.1.3 AUTOGRAFTS
10.2.1.1.1.4 PHYTOGENIC MATERIALS
10.2.1.2 SYNTHETIC BONE GRAFT
10.2.1.2.1 U.S. SYNTHETIC BONE GRAFT IN DENTAL BONE GRAFT MARKET, BY TYPE, 2018-2033 (USD THOUSAND)
10.2.1.2.1.1 TRICALCIUM PHOSPHATE CERAMICS
10.2.1.2.1.2 HYDROXYAPATITE
10.2.1.2.1.3 BIPHASIC CALCIUM PHOSPHATE CERAMICS
10.2.1.2.1.4 BIOACTIVE GLASS
10.2.1.2.1.5 POLYMERS
10.2.1.2.1.6 CALCIUM PHOSPHATE CEMENT
10.2.1.2.1.7 CALCIUM-PHOSPHOSILICATE
10.2.1.2.1.8 COMPOSITES
10.2.1.2.1.9 METALS
10.2.1.3 GROWTH FACTORS
10.2.1.4 LIVE OSTEOGENIC CELLS BONE SUBSTITUTES
10.2.1.5 OTHERS
10.3 RIDGE AUGMENTATION
10.3.1 U.S. RIDGE AUGMENTATION IN DENTAL BONE GRAFT MARKET, BY TYPE, 2018-2033 (USD THOUSAND)
10.3.1.1 NATURAL BONE GRAFT
10.3.1.1.1 U.S. NATURAL BONE GRAFT IN DENTAL BONE GRAFT MARKET, BY TYPE, 2018-2033 (USD THOUSAND)
10.3.1.1.1.1 XENOGRAFT
10.3.1.1.1.2 ALLOGRAFT
10.3.1.1.1.3 AUTOGRAFTS
10.3.1.1.1.4 PHYTOGENIC MATERIALS
10.3.1.2 SYNTHETIC BONE GRAFT
10.3.1.2.1 U.S. SYNTHETIC BONE GRAFT IN DENTAL BONE GRAFT MARKET, BY TYPE, 2018-2033 (USD THOUSAND)
10.3.1.2.1.1 TRICALCIUM PHOSPHATE CERAMICS
10.3.1.2.1.2 HYDROXYAPATITE
10.3.1.2.1.3 BIPHASIC CALCIUM PHOSPHATE CERAMICS
10.3.1.2.1.4 BIOACTIVE GLASS
10.3.1.2.1.5 POLYMERS
10.3.1.2.1.6 CALCIUM PHOSPHATE CEMENT
10.3.1.2.1.7 CALCIUM-PHOSPHOSILICATE
10.3.1.2.1.8 COMPOSITES
10.3.1.2.1.9 METALS
10.3.1.3 GROWTH FACTORS
10.3.1.4 LIVE OSTEOGENIC CELLS BONE SUBSTITUTES
10.3.1.5 OTHERS
10.4 SOCKET PRESERVATION
10.4.1 U.S. SOCKET PRESERVATION IN DENTAL BONE GRAFT MARKET, BY TYPE, 2018-2033 (USD THOUSAND)
10.4.1.1 NATURAL BONE GRAFT
10.4.1.1.1 U.S. NATURAL BONE GRAFT IN DENTAL BONE GRAFT MARKET, BY TYPE, 2018-2033 (USD THOUSAND)
10.4.1.1.1.1 XENOGRAFT
10.4.1.1.1.2 ALLOGRAFT
10.4.1.1.1.3 AUTOGRAFTS
10.4.1.1.1.4 PHYTOGENIC MATERIALS
10.4.1.2 SYNTHETIC BONE GRAFT
10.4.1.2.1 U.S. SYNTHETIC BONE GRAFT IN DENTAL BONE GRAFT MARKET, BY TYPE, 2018-2033 (USD THOUSAND)
10.4.1.2.1.1 TRICALCIUM PHOSPHATE CERAMICS
10.4.1.2.1.2 HYDROXYAPATITE
10.4.1.2.1.3 BIPHASIC CALCIUM PHOSPHATE CERAMICS
10.4.1.2.1.4 BIOACTIVE GLASS
10.4.1.2.1.5 POLYMERS
10.4.1.2.1.6 CALCIUM PHOSPHATE CEMENT
10.4.1.2.1.7 CALCIUM-PHOSPHOSILICATE
10.4.1.2.1.8 COMPOSITES
10.4.1.2.1.9 METALS
10.4.1.3 GROWTH FACTORS
10.4.1.4 LIVE OSTEOGENIC CELLS BONE SUBSTITUTES
10.4.1.5 OTHERS
10.5 PERIODONTAL DEFECT REGENERATION
10.5.1 U.S. PERIODONTAL DEFECT REGENERATION IN DENTAL BONE GRAFT MARKET, BY TYPE, 2018-2033 (USD THOUSAND)
10.5.1.1 NATURAL BONE GRAFT
10.5.1.1.1 U.S. NATURAL BONE GRAFT IN DENTAL BONE GRAFT MARKET, BY TYPE, 2018-2033 (USD THOUSAND)
10.5.1.1.1.1 XENOGRAFT
10.5.1.1.1.2 ALLOGRAFT
10.5.1.1.1.3 AUTOGRAFTS
10.5.1.1.1.4 PHYTOGENIC MATERIALS
10.5.1.2 SYNTHETIC BONE GRAFT
10.5.1.2.1 U.S. SYNTHETIC BONE GRAFT IN DENTAL BONE GRAFT MARKET, BY TYPE, 2018-2033 (USD THOUSAND)
10.5.1.2.1.1 TRICALCIUM PHOSPHATE CERAMICS
10.5.1.2.1.2 HYDROXYAPATITE
10.5.1.2.1.3 BIPHASIC CALCIUM PHOSPHATE CERAMICS
10.5.1.2.1.4 BIOACTIVE GLASS
10.5.1.2.1.5 POLYMERS
10.5.1.2.1.6 CALCIUM PHOSPHATE CEMENT
10.5.1.2.1.7 CALCIUM-PHOSPHOSILICATE
10.5.1.2.1.8 COMPOSITES
10.5.1.2.1.9 METALS
10.5.1.3 GROWTH FACTORS
10.5.1.4 LIVE OSTEOGENIC CELLS BONE SUBSTITUTES
10.5.1.5 OTHERS
10.6 SINUS LIFT
10.6.1 U.S. SINUS LIFT IN DENTAL BONE GRAFT MARKET, BY TYPE, 2018-2033 (USD THOUSAND)
10.6.1.1 NATURAL BONE GRAFT
10.6.1.1.1 U.S. NATURAL BONE GRAFT IN DENTAL BONE GRAFT MARKET, BY TYPE, 2018-2033 (USD THOUSAND)
10.6.1.1.1.1 XENOGRAFT
10.6.1.1.1.2 ALLOGRAFT
10.6.1.1.1.3 AUTOGRAFTS
10.6.1.1.1.4 PHYTOGENIC MATERIALS
10.6.1.2 SYNTHETIC BONE GRAFT
10.6.1.2.1 U.S. SYNTHETIC BONE GRAFT IN DENTAL BONE GRAFT MARKET, BY TYPE, 2018-2033 (USD THOUSAND)
10.6.1.2.1.1 TRICALCIUM PHOSPHATE CERAMICS
10.6.1.2.1.2 HYDROXYAPATITE
10.6.1.2.1.3 BIPHASIC CALCIUM PHOSPHATE CERAMICS
10.6.1.2.1.4 BIOACTIVE GLASS
10.6.1.2.1.5 POLYMERS
10.6.1.2.1.6 CALCIUM PHOSPHATE CEMENT
10.6.1.2.1.7 CALCIUM-PHOSPHOSILICATE
10.6.1.2.1.8 COMPOSITES
10.6.1.2.1.9 METALS
10.6.1.3 GROWTH FACTORS
10.6.1.4 LIVE OSTEOGENIC CELLS BONE SUBSTITUTES
10.6.1.5 OTHERS
10.7 OTHERS
10.7.1 U.S. OTHERS IN DENTAL BONE GRAFT MARKET, BY TYPE, 2018-2033 (USD THOUSAND)
10.7.1.1 NATURAL BONE GRAFT
10.7.1.1.1 U.S. NATURAL BONE GRAFT IN DENTAL BONE GRAFT MARKET, BY TYPE, 2018-2033 (USD THOUSAND)
10.7.1.1.1.1 XENOGRAFT
10.7.1.1.1.2 ALLOGRAFT
10.7.1.1.1.3 AUTOGRAFTS
10.7.1.1.1.4 PHYTOGENIC MATERIALS
10.7.1.2 SYNTHETIC BONE GRAFT
10.7.1.2.1 U.S. SYNTHETIC BONE GRAFT IN DENTAL BONE GRAFT MARKET, BY TYPE, 2018-2033 (USD THOUSAND)
10.7.1.2.1.1 TRICALCIUM PHOSPHATE CERAMICS
10.7.1.2.1.2 HYDROXYAPATITE
10.7.1.2.1.3 BIPHASIC CALCIUM PHOSPHATE CERAMICS
10.7.1.2.1.4 BIOACTIVE GLASS
10.7.1.2.1.5 POLYMERS
10.7.1.2.1.6 CALCIUM PHOSPHATE CEMENT
10.7.1.2.1.7 CALCIUM-PHOSPHOSILICATE
10.7.1.2.1.8 COMPOSITES
10.7.1.2.1.9 METALS
10.7.1.3 GROWTH FACTORS
10.7.1.4 LIVE OSTEOGENIC CELLS BONE SUBSTITUTES
10.7.1.5 OTHERS
11 U.S. DENTAL BONE GRAFT MARKET, BY USAGE
11.1 OVERVIEW
11.2 BONE GRAFT SUBSTITUTES
11.2.1 U.S. BONE GRAFT SUBSTITUTES IN DENTAL BONE GRAFT MARKET, BY TYPE , 2018-2033 (USD THOUSAND)
11.2.1.1 NATURAL
11.2.1.1.1 U.S. NATURAL IN DENTAL BONE GRAFT MARKET, BY TYPE, 2018-2033 (USD THOUSAND)
11.2.1.1.1.1 XENOGRAFT
11.2.1.1.1.2 ALLOGRAFT
11.2.1.1.1.3 AUTOGRAFTS
11.2.1.1.1.4 PHYTOGENIC MATERIALS
11.2.1.2 SYNTHETIC
11.2.1.3 OTHERS
11.3 BONE GRAFT EXTENDERS
11.3.1 U.S. BONE GRAFT EXTENDERS IN DENTAL BONE GRAFT MARKET, BY TYPE, 2018-2033 (USD THOUSAND)
11.3.1.1 TRICALCIUM PHOSPHATE CERAMICS
11.3.1.2 HYDROXYAPATITE
11.3.1.3 BIOACTIVE GLASS
11.3.1.4 BIPHASIC CALCIUM PHOSPHATE CERAMICS
11.3.1.5 CALCIUM PHOSPHATE CEMENT
11.3.1.6 CALCIUM-PHOSPHOSILICATE
11.3.1.7 POLYMERS
11.3.1.8 OTHERS
12 U.S. DENTAL BONE GRAFT MARKET, BY MECHANISM
12.1 OVERVIEW
12.2 OSTEOCONDUCTION
12.3 OSTEOINDUCTION
12.4 OSTEOPROMOTION
12.5 OSTEOGENESIS
13 U.S. DENTAL BONE GRAFT MARKET, BY MATERIAL FORM
13.1 OVERVIEW
13.2 GRANULES
13.3 PUTTY
13.4 INJECTABLES
14 U.S. DENTAL BONE GRAFT MARKET, BY AGE
14.1 OVERVIEW
14.2 ADULT
14.3 GERIATRIC
14.4 PEDIATRICS
15 U.S. DENTAL BONE GRAFT MARKET, BY POPULATION
15.1 OVERVIEW
15.2 FEMALE
15.3 MALE
16 U.S. DENTAL BONE GRAFT MARKET, BY END USER
16.1 OVERVIEW
16.2 DENTAL CLINICS
16.3 HOSPITALS
16.4 RESEARCH AND DENTAL LABORATORIES
16.5 OTHERS
17 U.S. DENTAL BONE GRAFT MARKET, BY DISTRIBUTION CHANNEL
17.1 OVERVIEW
17.2 DIRECT TENDER
17.3 THIRD PARTY DISTRIBUTORS
17.4 OTHERS
18 U.S. DENTAL BONE GRAFT MARKET: COMPANY LANDSCAPE
18.1 MANUFACTURER COMPANY SHARE ANALYSIS: U.S.
19 SWOT ANALYSIS
20 COMPANY PROFILE
20.1 GEISTLICH PHARMA AG
20.1.1 COMPANY SNAPSHOT
20.1.2 PRODUCT PORTFOLIO
20.1.3 RECENT DEVELOPMENT
20.2 ZIMVIE INC.
20.2.1 COMPANY SNAPSHOT
20.2.2 PRODUCT PORTFOLIO
20.2.3 RECENT DEVELOPMENT
20.3 DENTSPLY SIRONA
20.3.1 COMPANY SNAPSHOT
20.3.2 REVENUE ANALYSIS
20.3.3 PRODUCT PORTFOLIO
20.3.4 RECENT DEVELOPMENT
20.4 ENVISTA
20.4.1 COMPANY SNAPSHOT
20.4.2 REVENUE ANALYSIS
20.4.3 PRODUCT PORTFOLIO
20.4.4 RECENT DEVELOPMENT
20.5 BIOHORIZONS (BRAND OF BIOHORIZONS CAMLOG GROUP)
20.5.1 COMPANY SNAPSHOT
20.5.2 PRODUCT PORTFOLIO
20.5.3 RECENT DEVELOPMENT
20.6 AUGMA BIOMATERIALS
20.6.1 COMPANY SNAPSHOT
20.6.2 PRODUCT PORTFOLIO
20.6.3 RECENT DEVELOPMENT
20.7 BOTISS BIOMATERIALS GMBH
20.7.1 COMPANY SNAPSHOT
20.7.2 PRODUCT PORTFOLIO
20.7.3 RECENT DEVELOPMENT
20.8 CURASAN AG
20.8.1 COMPANY SNAPSHOT
20.8.2 REVENUE ANALYSIS
20.8.3 PRODUCT PORTFOLIO
20.8.4 RECENT DEVELOPMENT
20.9 DENTIUM
20.9.1 COMPANY SNAPSHOT
20.9.2 PRODUCT PORTFOLIO
20.9.3 RECENT DEVELOPMENT
20.1 EVERGEN
20.10.1 COMPANY SNAPSHOT
20.10.2 PRODUCT PORTFOLIO
20.10.3 RECENT DEVELOPMENT
20.11 IMPLADENT LTD.
20.11.1 COMPANY SNAPSHOT
20.11.2 PRODUCT PORTFOLIO
20.11.3 RECENT DEVELOPMENT
20.12 KEYSTONE DENTAL GROUP
20.12.1 COMPANY SNAPSHOT
20.12.2 PRODUCT PORTFOLIO
20.12.3 RECENT DEVELOPMENT
20.13 LIFENET HEALTH
20.13.1 COMPANY SNAPSHOT
20.13.2 PRODUCT PORTFOLIO
20.13.3 RECENT DEVELOPMENT
20.14 MEGA’GEN IMPLANT CO., LTD.
20.14.1 COMPANY SNAPSHOT
20.14.2 PRODUCT PORTFOLIO
20.14.3 RECENT DEVELOPMENT
20.15 MTF BIOLOGICS
20.15.1 COMPANY SNAPSHOT
20.15.2 PRODUCT PORTFOLIO
20.15.3 RECENT DEVELOPMENT
20.16 NOVABONE
20.16.1 COMPANY SNAPSHOT
20.16.2 PRODUCT PORTFOLIO
20.16.3 RECENT DEVELOPMENT
20.17 ORTHOGEN LLC
20.17.1 COMPANY SNAPSHOT
20.17.2 PRODUCT PORTFOLIO
20.17.3 RECENT DEVELOPMENT
20.18 OSSTEM IMPLANT CO., LTD.
20.18.1 COMPANY SNAPSHOT
20.18.2 PRODUCT PORTFOLIO
20.18.3 RECENT DEVELOPMENT
20.19 PURGO BIOLOGICS INC
20.19.1 COMPANY SNAPSHOT
20.19.2 PRODUCT PORTFOLIO
20.19.3 RECENT DEVELOPMENT
20.2 REGENITY BIOSCIENCES
20.20.1 COMPANY SNAPSHOT
20.20.2 PRODUCT PORTFOLIO
20.20.3 RECENT DEVELOPMENT
20.21 SIGMAGRAFT BIOMATERIALS
20.21.1 COMPANY SNAPSHOT
20.21.2 PRODUCT PORTFOLIO
20.21.3 RECENT DEVELOPMENT
21 QUESTIONNAIRE
22 RELATED REPORTS
List of Table
TABLE 1 INDUSTRY ECOSYSTEM STRUCTURE OVERVIEW
TABLE 2 PATENT ANALYSIS – US DENTAL BONE GRAFT TECHNOLOGIES
TABLE 3 BRAND OUTLOOK
TABLE 4 SUMMARY: VENDOR SELECTION CRITERIA
TABLE 5 IMPLICATIONS FOR PATIENTS
TABLE 6 STRATEGIC PROFITABILITY POSITIONING MATRIX
TABLE 7 KEY RISK & BOTTLENECK ANALYSIS
TABLE 8 U.S. DENTAL BONE GRAFT MARKET, BY PRODUCT, 2018-2033 (USD THOUSAND)
TABLE 9 U.S. DENTAL BONE GRAFT MARKET, BY PRODUCT, 2018-2033 (VOLUME IN KILOGRAMS)
TABLE 10 U.S. NATURAL BONE GRAFT IN DENTAL BONE GRAFT MARKET, BY TYPE, 2018-2033 (USD THOUSAND)
TABLE 11 U.S. NATURAL BONE GRAFT IN DENTAL BONE GRAFT MARKET, BY TYPE, 2018-2033 (VOLUME IN KILOGRAMS)
TABLE 12 U.S. XENOGRAFT IN DENTAL BONE GRAFT MARKET, BY TYPE, 2018-2033 (USD THOUSAND)
TABLE 13 U.S. XENOGRAFT IN DENTAL BONE GRAFT MARKET, BY TYPE, 2018-2033 (VOLUME IN KILOGRAMS)
TABLE 14 U.S. ALLOGRAFT IN DENTAL BONE GRAFT MARKET, BY TYPE, 2018-2033 (USD THOUSAND)
TABLE 15 U.S. ALLOGRAFT IN DENTAL BONE GRAFT MARKET, BY TYPE, 2018-2033 (VOLUME IN KILOGRAMS)
TABLE 16 U.S. FRESH OR FRESH-FROZEN BONE IN DENTAL BONE GRAFT MARKET, BY TYPE, 2018-2033 (USD THOUSAND)
TABLE 17 U.S. FRESH OR FRESH-FROZEN BONE IN DENTAL BONE GRAFT MARKET, BY TYPE, 2018-2033 (VOLUME IN KILOGRAMS)
TABLE 18 U.S. FRESH OR FRESH-FROZEN BONE IN DENTAL BONE GRAFT MARKET, BY USABILITY, 2018-2033 (USD THOUSAND)
TABLE 19 U.S. FRESH OR FRESH-FROZEN BONE IN DENTAL BONE GRAFT MARKET, BY USABILITY, 2018-2033 (VOLUME IN KILOGRAMS)
TABLE 20 U.S. FREEZE DRIED BONE ALLOGRAFT (FDBA) IN DENTAL BONE GRAFT MARKET, BY TYPE, 2018-2033 (USD THOUSAND)
TABLE 21 U.S. FREEZE DRIED BONE ALLOGRAFT (FDBA) IN DENTAL BONE GRAFT MARKET, BY TYPE, 2018-2033 (VOLUME IN KILOGRAMS)
TABLE 22 U.S. FREEZE DRIED BONE ALLOGRAFT (FDBA) IN DENTAL BONE GRAFT MARKET, BY USABILITY, 2018-2033 (USD THOUSAND)
TABLE 23 U.S. FREEZE DRIED BONE ALLOGRAFT (FDBA) IN DENTAL BONE GRAFT MARKET, BY USABILITY, 2018-2033 (VOLUME IN KILOGRAMS)
TABLE 24 U.S. AUTOGRAFTS IN DENTAL BONE GRAFT MARKET, BY TYPE, 2018-2033 (USD THOUSAND)
TABLE 25 U.S. AUTOGRAFTS IN DENTAL BONE GRAFT MARKET, BY TYPE, 2018-2033 (VOLUME IN KILOGRAMS)
TABLE 26 U.S. PHYTOGENIC MATERIALS IN DENTAL BONE GRAFT MARKET, BY TYPE, 2018-2033 (USD THOUSAND)
TABLE 27 U.S. PHYTOGENIC MATERIALS IN DENTAL BONE GRAFT MARKET, BY TYPE, 2018-2033 (VOLUME IN KILOGRAMS)
TABLE 28 U.S. SYNTHETIC BONE GRAFT IN DENTAL BONE GRAFT MARKET, BY TYPE, 2018-2033 (USD THOUSAND)
TABLE 29 U.S. SYNTHETIC BONE GRAFT IN DENTAL BONE GRAFT MARKET, BY TYPE, 2018-2033 (VOLUME IN KILOGRAMS)
TABLE 30 U.S. POLYMERS IN DENTAL BONE GRAFT MARKET, BY USABILITY, 2018-2033 (USD THOUSAND)
TABLE 31 U.S. POLYMERS IN DENTAL BONE GRAFT MARKET, BY USABILITY, 2018-2033 (VOLUME IN KILOGRAMS)
TABLE 32 U.S. POLYMERS IN DENTAL BONE GRAFT MARKET, BY TYPE, 2018-2033 (USD THOUSAND)
TABLE 33 U.S. POLYMERS IN DENTAL BONE GRAFT MARKET, BY TYPE, 2018-2033 (VOLUME IN KILOGRAMS)
TABLE 34 U.S. COMPOSITES IN DENTAL BONE GRAFT MARKET, BY TYPE, 2018-2033 (USD THOUSAND)
TABLE 35 U.S. COMPOSITES IN DENTAL BONE GRAFT MARKET, BY TYPE, 2018-2033 (VOLUME IN KILOGRAMS)
TABLE 36 U.S. METALS IN DENTAL BONE GRAFT MARKET, BY TYPE, 2018-2033 (USD THOUSAND)
TABLE 37 U.S. METALS IN DENTAL BONE GRAFT MARKET, BY TYPE, 2018-2033 (VOLUME IN KILOGRAMS)
TABLE 38 U.S. GROWTH FACTORS IN DENTAL BONE GRAFT MARKET, BY TYPE, 2018-2033 (USD THOUSAND)
TABLE 39 U.S. GROWTH FACTORS IN DENTAL BONE GRAFT MARKET, BY TYPE, 2018-2033 (VOLUME IN KILOGRAMS)
TABLE 40 U.S. LIVE OSTEOGENIC CELLS BONE SUBSTITUTES IN DENTAL BONE GRAFT MARKET, BY TYPE, 2018-2033 (USD THOUSAND)
TABLE 41 U.S. LIVE OSTEOGENIC CELLS BONE SUBSTITUTES IN DENTAL BONE GRAFT MARKET, BY TYPE, 2018-2033 (VOLUME IN KILOGRAMS)
TABLE 42 U.S. DENTAL BONE GRAFT MARKET, BY BRAND, 2018-2033 (USD THOUSAND)
TABLE 43 U.S. DENTAL BONE GRAFT MARKET, BY APPLICATION, 2018-2033 (USD THOUSAND)
TABLE 44 U.S. IMPLANT BONE REGENERATION IN DENTAL BONE GRAFT MARKET, BY TYPE, 2018-2033 (USD THOUSAND)
TABLE 45 U.S. NATURAL BONE GRAFT IN DENTAL BONE GRAFT MARKET, BY TYPE, 2018-2033 (USD THOUSAND)
TABLE 46 U.S. SYNTHETIC BONE GRAFT IN DENTAL BONE GRAFT MARKET, BY TYPE, 2018-2033 (USD THOUSAND)
TABLE 47 U.S. RIDGE AUGMENTATION IN DENTAL BONE GRAFT MARKET, BY TYPE, 2018-2033 (USD THOUSAND)
TABLE 48 U.S. NATURAL BONE GRAFT IN DENTAL BONE GRAFT MARKET, BY TYPE, 2018-2033 (USD THOUSAND)
TABLE 49 U.S. SYNTHETIC BONE GRAFT IN DENTAL BONE GRAFT MARKET, BY TYPE, 2018-2033 (USD THOUSAND)
TABLE 50 U.S. SOCKET PRESERVATION IN DENTAL BONE GRAFT MARKET, BY TYPE, 2018-2033 (USD THOUSAND)
TABLE 51 U.S. NATURAL BONE GRAFT IN DENTAL BONE GRAFT MARKET, BY TYPE, 2018-2033 (USD THOUSAND)
TABLE 52 U.S. SYNTHETIC BONE GRAFT IN DENTAL BONE GRAFT MARKET, BY TYPE, 2018-2033 (USD THOUSAND)
TABLE 53 U.S. PERIODONTAL DEFECT REGENERATION IN DENTAL BONE GRAFT MARKET, BY TYPE, 2018-2033 (USD THOUSAND)
TABLE 54 U.S. NATURAL BONE GRAFT IN DENTAL BONE GRAFT MARKET, BY TYPE, 2018-2033 (USD THOUSAND)
TABLE 55 U.S. SYNTHETIC BONE GRAFT IN DENTAL BONE GRAFT MARKET, BY TYPE, 2018-2033 (USD THOUSAND)
TABLE 56 U.S. SINUS LIFT IN DENTAL BONE GRAFT MARKET, BY TYPE, 2018-2033 (USD THOUSAND)
TABLE 57 U.S. NATURAL BONE GRAFT IN DENTAL BONE GRAFT MARKET, BY TYPE, 2018-2033 (USD THOUSAND)
TABLE 58 U.S. SYNTHETIC BONE GRAFT IN DENTAL BONE GRAFT MARKET, BY TYPE, 2018-2033 (USD THOUSAND)
TABLE 59 U.S. OTHERS IN DENTAL BONE GRAFT MARKET, BY TYPE, 2018-2033 (USD THOUSAND)
TABLE 60 U.S. NATURAL BONE GRAFT IN DENTAL BONE GRAFT MARKET, BY TYPE, 2018-2033 (USD THOUSAND)
TABLE 61 U.S. SYNTHETIC BONE GRAFT IN DENTAL BONE GRAFT MARKET, BY TYPE, 2018-2033 (USD THOUSAND)
TABLE 62 U.S. DENTAL BONE GRAFT MARKET, BY USAGE, 2018-2033 (USD THOUSAND)
TABLE 63 U.S. BONE GRAFT SUBSTITUTES IN DENTAL BONE GRAFT MARKET, BY TYPE , 2018-2033 (USD THOUSAND)
TABLE 64 U.S. NATURAL IN DENTAL BONE GRAFT MARKET, BY TYPE, 2018-2033 (USD THOUSAND)
TABLE 65 U.S. BONE GRAFT EXTENDERS IN DENTAL BONE GRAFT MARKET, BY TYPE, 2018-2033 (USD THOUSAND)
TABLE 66 U.S. DENTAL BONE GRAFT MARKET, BY MECHANISM, 2018-2033 (USD THOUSAND)
TABLE 67 U.S. DENTAL BONE GRAFT MARKET, BY MATERIAL FORM, 2018-2033 (USD THOUSAND)
TABLE 68 U.S. DENTAL BONE GRAFT MARKET, BY AGE, 2018-2033 (USD THOUSAND)
TABLE 69 U.S. DENTAL BONE GRAFT MARKET, BY POPULATION, 2018-2033 (USD THOUSAND)
TABLE 70 U.S. DENTAL BONE GRAFT MARKET, BY END USER, 2018-2033 (USD THOUSAND)
TABLE 71 U.S. DENTAL BONE GRAFT MARKET, BY DISTRIBUTION CHANNEL, 2018-2033 (USD THOUSAND)
List of Figure
FIGURE 1 U.S. DENTAL BONE GRAFT MARKET: SEGMENTATION
FIGURE 2 U.S. DENTAL BONE GRAFT MARKET: DATA TRIANGULATION
FIGURE 3 U.S. DENTAL BONE GRAFT MARKET: DROC ANALYSIS
FIGURE 4 U.S. DENTAL BONE GRAFT MARKET: GLOBAL VS REGIONAL ANALYSIS
FIGURE 5 U.S. DENTAL BONE GRAFT MARKET: COMPANY RESEARCH ANALYSIS
FIGURE 6 U.S. DENTAL BONE GRAFT MARKET: INTERVIEW DEMOGRAPHICS
FIGURE 7 U.S. DENTAL BONE GRAFT MARKET: DBMR MARKET POSITION GRID
FIGURE 8 U.S. DENTAL BONE GRAFT MARKET: MARKET END USER COVERAGE GRID
FIGURE 9 EXECUTIVE SUMMARY
FIGURE 10 STRATEGIC DECISIONS
FIGURE 11 FIVE SEGMENTS COMPRISE THE U.S. DENTAL BONE GRAFT MARKET, BY PRODUCT (2025)
FIGURE 12 U.S. DENTAL BONE GRAFT MARKET: SEGMENTATION
FIGURE 13 SUSTAINED INCREASE IN IMPLANT-DRIVEN BONE AUGMENTATION PROCEDURES ACROSS THE UNITED STATES EXPECTED TO DRIVE THE U.S. DENTAL BONE GRAFT MARKET IN THE FORECAST PERIOD OF 2025 TO 2033
FIGURE 14 NATURAL BONE GRAFT SEGMENT IS EXPECTED TO ACCOUNT FOR THE LARGEST SHARE OF THE U.S. DENTAL BONE GRAFT MARKET IN 2025 & 2032
FIGURE 15 PORTER’S FIVE FROCES
FIGURE 16 COST DISTRIBUTION OF US DENTAL BONE GRAFT MARKET FROM MANUFACTURER AND SUPPLIER PERSPECTIVE
FIGURE 17 U.S. DENTAL BONE GRAFT MARKET: PATENT ACTIVITY OVERVIEW
FIGURE 18 PRODUCT-WISE PRICING TREND ANALYSIS (USD/GRAM), 2018–2033
FIGURE 19 SUPPLY CHAIN ANALYSIS
FIGURE 20 DRIVER, RESTRAINTS, OPPORTUNITIES & CHALLENGES ANALYSIS OF U.S. DENTAL BONE GRAFT MARKET
FIGURE 21 U.S. DENTAL BONE GRAFT MARKET: BY PRODUCT, 2025
FIGURE 22 U.S. DENTAL BONE GRAFT MARKET: BY PRODUCT, 2026-2033 (USD THOUSAND)
FIGURE 23 U.S. DENTAL BONE GRAFT MARKET: BY PRODUCT, CAGR (2026-2033)
FIGURE 24 U.S. DENTAL BONE GRAFT MARKET: BY PRODUCT, LIFELINE CURVE
FIGURE 25 U.S. DENTAL BONE GRAFT MARKET: BY BRAND, 2025
FIGURE 26 U.S. DENTAL BONE GRAFT MARKET: BY BRAND, 2026-2033 (USD THOUSAND)
FIGURE 27 U.S. DENTAL BONE GRAFT MARKET: BY BRAND, CAGR (2026-2033)
FIGURE 28 U.S. DENTAL BONE GRAFT MARKET: BY BRAND, LIFELINE CURVE
FIGURE 29 U.S. DENTAL BONE GRAFT MARKET: BY APPLICATION, 2025
FIGURE 30 U.S. DENTAL BONE GRAFT MARKET: BY APPLICATION, 2026-2033 (USD THOUSAND)
FIGURE 31 U.S. DENTAL BONE GRAFT MARKET: BY APPLICATION, CAGR (2026-2033)
FIGURE 32 U.S. DENTAL BONE GRAFT MARKET: BY APPLICATION, LIFELINE CURVE
FIGURE 33 U.S. DENTAL BONE GRAFT MARKET: BY USAGE, 2025
FIGURE 34 U.S. DENTAL BONE GRAFT MARKET: BY USAGE, 2026-2033 (USD THOUSAND)
FIGURE 35 U.S. DENTAL BONE GRAFT MARKET: BY USAGE, CAGR (2026-2033)
FIGURE 36 U.S. DENTAL BONE GRAFT MARKET: BY USAGE, LIFELINE CURVE
FIGURE 37 U.S. DENTAL BONE GRAFT MARKET: BY MECHANISM, 2025
FIGURE 38 U.S. DENTAL BONE GRAFT MARKET: BY MECHANISM, 2026-2033 (USD THOUSAND)
FIGURE 39 U.S. DENTAL BONE GRAFT MARKET: BY MECHANISM, CAGR (2026-2033)
FIGURE 40 U.S. DENTAL BONE GRAFT MARKET: BY MECHANISM, LIFELINE CURVE
FIGURE 41 U.S. DENTAL BONE GRAFT MARKET: BY MATERIAL FORM, 2025
FIGURE 42 U.S. DENTAL BONE GRAFT MARKET: BY MATERIAL FORM, 2026-2033 (USD THOUSAND)
FIGURE 43 U.S. DENTAL BONE GRAFT MARKET: BY MATERIAL FORM, CAGR (2026-2033)
FIGURE 44 U.S. DENTAL BONE GRAFT MARKET: BY MATERIAL FORM, LIFELINE CURVE
FIGURE 45 U.S. DENTAL BONE GRAFT MARKET: BY AGE, 2025
FIGURE 46 U.S. DENTAL BONE GRAFT MARKET: BY AGE, 2026-2033 (USD THOUSAND)
FIGURE 47 U.S. DENTAL BONE GRAFT MARKET: BY AGE, CAGR (2026-2033)
FIGURE 48 U.S. DENTAL BONE GRAFT MARKET: BY AGE, LIFELINE CURVE
FIGURE 49 U.S. DENTAL BONE GRAFT MARKET: BY POPULATION, 2025
FIGURE 50 U.S. DENTAL BONE GRAFT MARKET: BY POPULATION, 2026-2033 (USD THOUSAND)
FIGURE 51 U.S. DENTAL BONE GRAFT MARKET: BY POPULATION, CAGR (2026-2033)
FIGURE 52 U.S. DENTAL BONE GRAFT MARKET: BY POPULATION, LIFELINE CURVE
FIGURE 53 U.S. DENTAL BONE GRAFT MARKET: BY END USER, 2025
FIGURE 54 U.S. DENTAL BONE GRAFT MARKET: BY END USER, 2026-2033 (USD THOUSAND)
FIGURE 55 U.S. DENTAL BONE GRAFT MARKET: BY END USER, CAGR (2026-2033)
FIGURE 56 U.S. DENTAL BONE GRAFT MARKET: BY END USER, LIFELINE CURVE
FIGURE 57 U.S. DENTAL BONE GRAFT MARKET: BY DISTRIBUTION CHANNEL, 2025
FIGURE 58 U.S. DENTAL BONE GRAFT MARKET: BY DISTRIBUTION CHANNEL, 2026-2033 (USD THOUSAND)
FIGURE 59 U.S. DENTAL BONE GRAFT MARKET: BY DISTRIBUTION CHANNEL, CAGR (2026-2033)
FIGURE 60 U.S. DENTAL BONE GRAFT MARKET: BY DISTRIBUTION CHANNEL, LIFELINE CURVE
FIGURE 61 U.S. DENTAL BONE GRAFT MARKET: COMPANY SHARE 2025 (%)
Data collection and base year analysis are done using data collection modules with large sample sizes. The stage includes obtaining market information or related data through various sources and strategies. It includes examining and planning all the data acquired from the past in advance. It likewise envelops the examination of information inconsistencies seen across different information sources. The market data is analysed and estimated using market statistical and coherent models. Also, market share analysis and key trend analysis are the major success factors in the market report. To know more, please request an analyst call or drop down your inquiry.
The key research methodology used by DBMR research team is data triangulation which involves data mining, analysis of the impact of data variables on the market and primary (industry expert) validation. Data models include Vendor Positioning Grid, Market Time Line Analysis, Market Overview and Guide, Company Positioning Grid, Patent Analysis, Pricing Analysis, Company Market Share Analysis, Standards of Measurement, Global versus Regional and Vendor Share Analysis. To know more about the research methodology, drop in an inquiry to speak to our industry experts.
Data Bridge Market Research is a leader in advanced formative research. We take pride in servicing our existing and new customers with data and analysis that match and suits their goal. The report can be customized to include price trend analysis of target brands understanding the market for additional countries (ask for the list of countries), clinical trial results data, literature review, refurbished market and product base analysis. Market analysis of target competitors can be analyzed from technology-based analysis to market portfolio strategies. We can add as many competitors that you require data about in the format and data style you are looking for. Our team of analysts can also provide you data in crude raw excel files pivot tables (Fact book) or can assist you in creating presentations from the data sets available in the report.


