Global Flavours Fragrances Market
Market Size in USD Billion
CAGR :
% 
 USD
35.90 Billion
USD
51.10 Billion
2024
2032
USD
35.90 Billion
USD
51.10 Billion
2024
2032
| 2025 –2032 | |
| USD 35.90 Billion | |
| USD 51.10 Billion | |
| % | |
|
Flavours - Fragrances Market Size
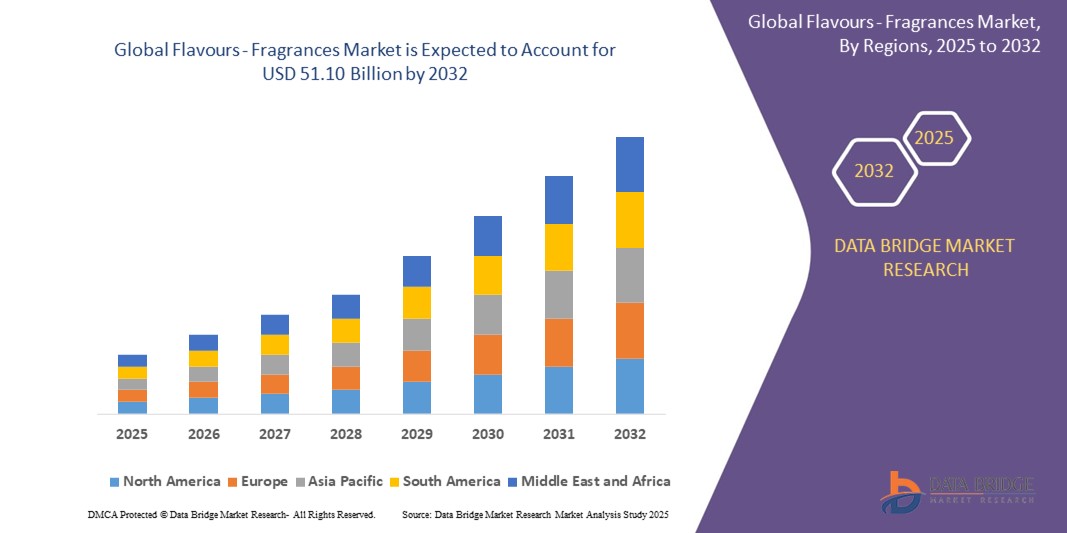
- The global flavours - fragrances market size was valued at USD 35.90 billion in 2024 and is expected to reach USD 51.10 billion by 2032, at a CAGR of 4.51% during the forecast period
- This growth is driven by factors such as the increasing consumer demand for natural and clean-label products, the expansion of the food and beverage industry, and the rising popularity of personalized and sustainable fragrances
Flavours - Fragrances Market Analysis
- Flavour and fragrance are two senses flavour is felt with the tongue whereas fragrance is felt with the nose. Fragrance is a sweet and pleasant smell and flavour is a distinctive taste
- However, flavour and fragrance cannot be considered as distinct things since the flavour is often a result of both smell and taste. Thus, fragrance has a main effect on flavour
- Europe is expected to dominate the flavours - fragrances market with 31.81% due significant consumption in the production of fine fragrances and cosmetics
- Asia-Pacific is expected to be the fastest growing region in the flavours - fragrances market during the forecast period due to increasing consumer demand and industry expansion
- Natural segment is expected to dominate the market with a market share of 74% due to its increasing product usage in various application industries such as pharmaceuticals, aromatherapy, and natural cosmetics
Report Scope and Flavours - Fragrances Market Segmentation
|
Attributes |
Flavours - Fragrances Key Market Insights |
|
Segments Covered |
|
|
Countries Covered |
North America
Europe
Asia-Pacific
Middle East and Africa
South America
|
|
Key Market Players |
|
|
Market Opportunities |
|
|
Value Added Data Infosets |
In addition to the insights on market scenarios such as market value, growth rate, segmentation, geographical coverage, and major players, the market reports curated by the Data Bridge Market Research also include in-depth expert analysis, pricing analysis, brand share analysis, consumer survey, demography analysis, supply chain analysis, value chain analysis, raw material/consumables overview, vendor selection criteria, PESTLE Analysis, Porter Analysis, and regulatory framework. |
Flavours - Fragrances Market Trends
“Rise of Natural and Clean-Label Products”
- There's a significant consumer shift towards natural and clean-label products, especially in food, beverages, and personal care sectors. Consumers are increasingly seeking products with transparent labeling and natural ingredients, driving the demand for natural flavors and fragrances
- The growing health and wellness trend is influencing consumer choices, with many opting for products that align with their lifestyle preferences. This shift is prompting manufacturers to develop and offer natural and organic flavors and fragrances
- Regulatory support for natural ingredients is encouraging manufacturers to invest in natural alternatives to comply with standards and meet consumer demand. This support is fostering innovation in sourcing methods and extraction techniques
- Companies are focusing on manufacturing innovative natural flavors and fragrances with multifunctional properties to meet end-customer demands and strengthen their market position
Flavours - Fragrances Market Dynamics
Driver
“Expansion in Emerging Markets”
- Rapid urbanization and rising disposable incomes in emerging economies are driving the demand for flavored and fragranced products in food & beverages, personal care, and home care sectors
- Shifting consumer lifestyles and preferences are influencing the demand for diverse and innovative flavors and fragrances, prompting companies to adapt their offerings
- The increasing penetration of e-commerce in these regions is facilitating market growth by making products more accessible to consumers
- Countries such as India, with rich biodiversity, offer opportunities for sourcing organic fragrant raw materials, catering to the global demand for natural ingredients
- Companies are exploring these markets to tap into the growing consumer base and expand their global footprint, employing strategies such as local partnerships and tailored product offerings
Opportunity
“Emphasis on Sustainability and Eco-Friendly Practices”
- Increasing awareness about environmental issues has led to a rise in demand for sustainable and eco-friendly products, prompting companies to adopt environmentally friendly practices
- Major players in the food and beverage, personal care, and household product sectors are investing in the development and marketing of natural and organic product lines to cater to evolving consumer preferences
- Companies are focusing on sustainably and ethically sourcing raw materials such as spices, flowers, and essential oils, ensuring traceability and compliance with environmental standards
- Investments in sustainable production processes, such as reducing water usage, using renewable energy, and minimizing waste, are becoming integral to business strategies
- Educating consumers about the environmental impact of products and providing transparent information about sourcing and production processes are key strategies for building trust and loyalty
Restraint/Challenge
“Regulatory Compliance and Sustainability Challenges”
- Navigating the complex and varying regulatory frameworks across regions can be challenging for companies, requiring extensive testing and certification processes
- The cost associated with ensuring compliance with stringent regulations, including ingredient labeling and safety standards, can be significant, impacting profitability
- Achieving sustainability and traceability in sourcing raw materials, especially natural flavors and fragrances, can be difficult due to limited availability and strict regulations
- The global supply chains involved in the flavors and fragrances market add complexity, making it challenging to ensure consistent quality and sustainability across all stages
Flavours - Fragrances Market Scope
The market is segmented on the basis of products, form, and end-user.
|
Segmentation |
Sub-Segmentation |
|
By Products |
|
|
By Form |
|
|
By End User |
|
In 2025, the natural is projected to dominate the market with a largest share in products segment
The natural segment is expected to dominate the flavours - fragrances market with the largest share of 74% in 2025 due to its increasing product usage in various application industries such as pharmaceuticals, aromatherapy, and natural cosmetics. Furthermore, increasing research spending for development of natural fragrance compounds is expected to have a positive impact on overall industry.
The cosmetics and toiletries is expected to account for the largest share during the forecast period in end user segment
The cosmetics and toiletries segment is expected to dominate the flavours and fragrances market due to the increasing demand for personal care products such as perfumes, deodorants, creams, and shampoos. The rising consumer preference for scented and premium cosmetic items, along with continuous innovation in product formulations, is anticipated to drive the growth of this segment across the industry.
Flavours - Fragrances Market Regional Analysis
“Europe Holds the Largest Share in the Flavours - Fragrances Market”
- Europe held the largest market share in the global flavours and fragrances market, accounting for 31.81%
- The dominance is attributed to the high demand from food and beverage manufacturers, as well as significant consumption in the production of fine fragrances and cosmetics.
- Europe hosts several multinational manufacturers, facilitating ease of trade and innovation in the industry
- There has been a notable increase in the demand for flavors used in liquor-based drinks, further boosting the market in the region
- The region is expected to maintain its leading position due to continuous innovation and strong industry presence
“Asia-Pacific is Projected to Register the Highest CAGR in the Flavours - Fragrances Market”
- The Asia-Pacific region is projected to experience the highest growth rate in the flavours and fragrances market, driven by increasing consumer demand and industry expansion
- Countries such as China, India, and Southeast Asia are witnessing a surge in demand for flavored products, particularly in the food and beverage sector
- There is a growing preference for natural and clean-label products among consumers, influencing market dynamics
- Global companies are investing in the region, establishing R&D facilities and expanding their market presence to capitalize on the growth opportunities
- The region's rapid urbanization and rising disposable incomes contribute to the burgeoning demand for flavours and fragrances
Flavours - Fragrances Market Share
The market competitive landscape provides details by competitor. Details included are company overview, company financials, revenue generated, market potential, investment in research and development, new market initiatives, global presence, production sites and facilities, production capacities, company strengths and weaknesses, product launch, product width and breadth, application dominance. The above data points provided are only related to the companies' focus related to market.
The Major Market Leaders Operating in the Market Are:
- Givaudan (Switzerland)
- Firmenich SA (Switzerland)
- International Flavors & Fragrances Inc, (U.S.)
- Takasago International Corporation (Japan)
- ADM (U.S.)
- Sensient Technologies Corporation (U.S.)
- Mane (EN) (France)
- Robertet SA (France)
- T.Hasegawa USA Inc. (Japan)
- Bell Flavors & Fragrances (U.S.)
- Agilex Fragrances (U.S.)
- Comax MFG Corp (U.S.)
- Biolandes (France)
- doTERRA (U.S.)
- Falcon (U.S.)
- Ungerer & Company (U.S.)
- Akay (India)
- BASF SE (Germany)
- Young Living Essential Oils (U.S.)
- Alpha Aromatics (U.S.)
Latest Developments in Global Flavours - Fragrances Market
- In March 2024, DSM-Firmenich AG opened two modern production facilities for the manufacture of ingredients for perfumes in Castets, Southwest of France
- In March 2023, International Flavors & Fragrances Inc. announced the addition of two new flavor labs at its Europe Innovation Hub in Braband, Denmark. The laboratories will focus on creating gourmet and sweet flavors
- In January 2023 Symrise AG invested in Ignite Venture Studio. It is B2C startup ventures in the personal care sector. Symrise has invested in Ignite Venture Studio to drive product innovations in fragrance and cosmetic ingredients
- In December 2022, -Symrise had partnered with Norwest Ingredients for comprehensive sustainability assessment of peppermint and spearmint raw materials
- In December 2022, Mane Group has opened two new facilities in India. The first site is located at MANE KANCOR Angamaly, Kerala; the second is at MANE KANCOR Byadgi, Karnataka
SKU-
Get online access to the report on the World's First Market Intelligence Cloud

- Interactive Data Analysis Dashboard
- Company Analysis Dashboard for high growth potential opportunities
- Research Analyst Access for customization & queries
- Competitor Analysis with Interactive dashboard
- Latest News, Updates & Trend analysis
- Harness the Power of Benchmark Analysis for Comprehensive Competitor Tracking
Table of Content
1 INTRODUCTION
1.1 OBJECTIVES OF THE STUDY
1.2 MARKET DEFINITION
1.3 OVERVIEW OF GLOBAL FLAVOURS AND FRAGRANCES MARKET
1.4 CURRENCY AND PRICING
1.5 LIMITATION
1.6 MARKETS COVERED
2 MARKET SEGMENTATION
2.1 KEY TAKEAWAYS
2.2 ARRIVING AT THE GLOBAL FLAVOURS AND FRAGRANCES MARKET SIZE
2.3 VENDOR POSITIONING GRID
2.4 MARKETS COVERED
2.5 GEOGRAPHIC SCOPE
2.6 YEARS CONSIDERED FOR THE STUDY
2.7 RESEARCH METHODOLOGY
2.8 TECHNOLOGY LIFE LINE CURVE
2.9 MULTIVARIATE MODELLING
2.1 PRIMARY INTERVIEWS WITH KEY OPINION LEADERS
2.11 DBMR MARKET POSITION GRID
2.12 MARKET APPLICATION COVERAGE GRID
2.13 DBMR MARKET CHALLENGE MATRIX
2.14 SECONDARY SOURCES
2.15 GLOBAL FLAVOURS AND FRAGRANCES MARKET: RESEARCH SNAPSHOT
2.16 ASSUMPTIONS
3 MARKET OVERVIEW
3.1 DRIVERS
3.2 RESTRAINTS
3.3 OPPORTUNITIES
3.4 CHALLENGES
4 EXECUTIVE SUMMARY
5 PREMIUM INSIGHTS
5.1 VALUE CHAIN ANALYSIS
5.2 SUPPLY CHAIN ANALYSIS
5.3 IMPORT-EXPORT ANALYSIS
5.4 PORTER’S FIVE FORCES ANALYSIS
5.4.1 BARGAINING POWER OF SUPPLIERS
5.4.2 BARGAINING POWER OF BUYERS/CONSUMERS
5.4.3 THREAT OF NEW ENTRANTS
5.4.4 THREAT OF SUBSTITUTE PRODUCTS
5.4.5 INTENSITY OF COMPETITIVE RIVALRY
5.5 RAW MATERIAL SOURCING ANALYSIS
5.6 OVERVIEW OF TECHNOLOGICAL INNOVATIONS
5.7 INDUSTRY TRENDS AND FUTURE PERSPECTIVE
5.8 GROWTH STRATEGIES ADOPTED BY KEY MARKET PLAYERS
5.9 FACTORS INFLUENCING PURCHASING DECISION OF END-USERS
6 IMPACT OF ECONOMIC SLOW DOWN ON MARKET
6.1 IMPACT ON PRICE
6.2 IMPACT ON SUPPLY CHAIN
6.3 IMPACT ON SHIPMENT
6.4 IMPACT ON COMPANY’S STRATEGIC DECISIONS
7 REGULATORY FRAMEWORK AND GUIDELINES
8 PRICING ANALYSIS
9 PRODUCTION CAPACITY OF KEY MANUFACTURERES
10 BRAND OUTLOOK
10.1 COMPARATIVE BRAND ANALYSIS
10.2 PRODUCT VS BRAND OVERVIEW
11 SUPPLY CHAIN ANALYSIS
11.1 OVERVIEW
11.2 LOGISTIC COST SCENARIO
11.3 IMPORTANCE OF LOGISTICS SERVICE PROVIDERS
12 CLIMATE CHANGE SCENARIO
12.1 ENVIRONMENTAL CONCERNS
12.2 INDUSTRY RESPONSE
12.3 GOVERNMENT’S ROLE
12.4 ANALYST RECOMMENDATIONS
13 GLOBAL FLAVOURS AND FRAGRANCES MARKET, BY PRODUCT TYPE, 2018-2032 (USD MILLION) (KILO TONS)
13.1 OVERVIEW
13.2 FLAVOURS
13.2.1 FRUITY
13.2.1.1. FRUITY, BY TYPE
13.2.1.1.1. APPLE
13.2.1.1.2. APRICOT
13.2.1.1.3. BANANA
13.2.1.1.4. CANTALOUPE
13.2.1.1.5. HONEYDEW
13.2.1.1.6. MANGO
13.2.1.1.7. PAPAYA
13.2.1.1.8. PASSIONFRUIT
13.2.1.1.9. PLUM
13.2.1.1.10. BLOOD ORANGE
13.2.1.1.11. GRAPEFRUIT
13.2.1.1.12. KEY LIMEKUMQUAT
13.2.1.1.13. LEMON
13.2.1.1.14. LIMEMANDARIN ORANGE
13.2.1.1.15. ORANGE
13.2.1.1.16. TANGERINE
13.2.1.1.17. BERRIES
13.2.1.1.17.1 BERRIES, BY TYPE
13.2.1.1.17.1.1. RED RASPBERRY
13.2.1.1.17.1.2. STRAWBERRY
13.2.1.1.17.1.3. BLUEBERRY
13.2.1.1.17.1.4. RASPBERRY
13.2.1.1.17.1.5. GRAPES
13.2.1.1.17.1.6. ACAI BERRY
13.2.1.1.17.1.7. GOJI BERRY
13.2.1.1.17.1.8. MARIONBERRY
13.2.1.1.17.1.9. GOOSEBERRY
13.2.1.1.17.1.10. CRANBERRY
13.2.1.1.17.1.11. MULBERRY
13.2.1.1.17.1.12. ARONIA BERRY
13.2.1.1.17.1.13. CITRUS BERRY
13.2.1.1.17.1.14. BLACK RASPBERRY
13.2.1.1.17.1.15. BLACKCURRANT
13.2.2 SPICY
13.2.2.1. SPICY, BY TYPE
13.2.2.1.1. PEPPER
13.2.2.1.2. GINGER
13.2.2.1.3. CINNAMON
13.2.2.1.4. CUMIN
13.2.2.1.5. TURMERIC
13.2.2.1.6. CARDAMOM
13.2.2.1.7. MUSTARD
13.2.2.1.8. CORIANDER
13.2.2.1.9. CLOVES
13.2.2.1.10. MINT
13.2.2.1.11. SAGE
13.2.2.1.12. SAFFRON
13.2.2.1.13. FENUGREEK
13.2.2.1.14. FENNEL
13.2.2.1.15. ONION
13.2.2.1.16. NUTMEG
13.2.2.1.17. OTHERS
13.2.3 HERBAL
13.2.3.1. HERBAL, BY TYPE
13.2.3.1.1. BASIL
13.2.3.1.2. BERGAMOT
13.2.3.1.3. BLACK TEA
13.2.3.1.4. CHAMOMILE
13.2.3.1.5. EUCALYPTUS
13.2.3.1.6. GREEN TEA
13.2.3.1.7. HIBISCUSJASMINE
13.2.3.1.8. LAVENDER
13.2.3.1.9. MENTHOL
13.2.3.1.10. MINT
13.2.3.1.11. ORANGE BLOSSOM
13.2.3.1.12. PEPPERMINT
13.2.3.1.13. ROSEROSEMARY
13.2.3.1.14. SAGE
13.2.3.1.15. SARSAPARILLA
13.2.3.1.16. SASSAFRAS
13.2.3.1.17. SPEARMINT
13.2.3.1.18. TEA
13.2.3.1.19. WINTERGREEN
13.2.3.1.20. OTHERS
13.2.4 NUTTY
13.2.4.1. NUTTY, BY TYPE
13.2.4.1.1. ALMOND
13.2.4.1.2. CASHEW
13.2.4.1.3. HAZELNUTMACADAMIA NUT
13.2.4.1.4. PEANUT
13.2.4.1.5. PECANPINE NUT
13.2.4.1.6. PISTACHIO
13.2.4.1.7. WALNUT
13.2.4.1.8. OTHERS
13.2.5 DAIRY
13.2.5.1. DAIRY, BY TYPE
13.2.5.1.1. BAVARIAN CREAM
13.2.5.1.2. BUTTER FLAVOR
13.2.5.1.2.1 MEDIUM BUTTERY FLAVOR NOTES
13.2.5.1.2.2 MEDIUM STRONG BUTTERY FLAVOR NOTES
13.2.5.1.2.3 STRONG BUTTERY FLAVOR NOTES
13.2.5.1.2.4 OTHERS
13.2.5.1.3. CREAM
13.2.5.1.4. CREAM CHEESEICE CREAM
13.2.5.1.5. IRISH CREAM
13.2.5.1.6. MOCHA
13.2.5.1.7. NUTELLA TYPESWEET CREAM
13.2.5.1.8. WHIPPED CREAM
13.2.5.1.9. WHITE CHOCOLATE
13.2.5.1.10. YOGURT TYPE
13.2.5.1.11. OTHERS
13.2.6 VEGETABLE EXTRACTS
13.2.6.1. VEGETABLE EXTRACTS, BY TYPE
13.2.6.1.1. CUCUMBER
13.2.6.1.2. WATERMELON
13.2.6.1.3. GARLIC
13.2.6.1.4. MUSHROOM
13.2.6.1.5. ONION
13.2.6.1.6. TOMATO
13.2.6.1.7. TOMATO BASIL
13.2.6.1.8. OTHERS
13.2.7 CITRUS
13.2.7.1. CITRUS, BY TYPE
13.2.7.1.1. BLOOD ORANGE
13.2.7.1.2. GRAPEFRUIT
13.2.7.1.3. KEY LIMEKUMQUAT
13.2.7.1.4. LEMON
13.2.7.1.5. LIMEMANDARIN ORANGE
13.2.7.1.6. ORANGE
13.2.7.1.7. TANGERINE
13.2.7.1.8. OTHERS
13.2.8 COFFEE
13.2.9 CHOCOLATE
13.2.10 TOFFEE
13.2.11 CARAMEL
13.2.12 DATE DERIVATIVES
13.2.13 VEGETABLE OILS
13.2.14 OTHERS
13.3 FRAGRANCES
13.3.1 ESSENTIAL OILS
13.3.1.1. CITRUS OILS
13.3.1.1.1. LEMON OIL
13.3.1.1.2. ORANGE OIL
13.3.1.1.3. GRAPEFRUIT OIL
13.3.1.1.4. BERGAMOT OIL
13.3.1.1.5. LIME OIL
13.3.1.1.6. TANGERINE OIL
13.3.1.1.7. CITROELLA OIL
13.3.1.1.8. LEMONGRASS OIL
13.3.1.1.9. MANDARIN OIL
13.3.1.1.10. LITSEA CUBEBA OIL
13.3.1.1.11. TAGETES OIL
13.3.1.1.12. OTHERS
13.3.1.2. FLORAL OILS
13.3.1.2.1. CHAMOMILE OIL
13.3.1.2.2. GERANIUM OIL
13.3.1.2.3. JASMINE OIL
13.3.1.2.4. LAVENDER OIL
13.3.1.2.5. NEROLI OIL
13.3.1.2.6. ROSE OIL
13.3.1.2.7. ROSEWOOD OIL
13.3.1.2.8. YLANG-YLANG OIL
13.3.1.2.9. PETITGRAIN OIL
13.3.1.2.10. OTHERS
13.3.1.3. HERBACEOUS OILS
13.3.1.3.1. ANGELICA ROOT OIL
13.3.1.3.2. CLARY SAGE OIL
13.3.1.3.3. EUCALYTUS OIL
13.3.1.3.4. FENNEL OIL
13.3.1.3.5. HYSSOP OIL
13.3.1.3.6. MARJORAM OIL
13.3.1.3.7. MELISSA OIL
13.3.1.3.8. ROSEMARY OIL
13.3.1.3.9. HYME OIL
13.3.1.3.10. OREGANO OIL
13.3.1.3.11. BAY LAUREL OIL
13.3.1.3.12. CATNIP OIL
13.3.1.3.13. SAGE DAMATIAN OIL
13.3.1.3.14. PARSLEY OIL
13.3.1.3.15. TEA TREE OIL
13.3.1.3.16. YARROW OIL
13.3.1.3.17. OTHERS
13.3.1.4. CAMPHORACEOUS OILS
13.3.1.4.1. CAMPHOR OIL
13.3.1.4.2. CAJEPUT OIL
13.3.1.4.3. EUCALYPTUS OIL
13.3.1.4.4. PANNYROYAL OIL
13.3.1.4.5. LAUREL LEAF OIL
13.3.1.4.6. LAVANDIN OIL
13.3.1.4.7. OTHERS
13.3.1.5. MINTY OILS
13.3.1.5.1. SPEARMINT OIL
13.3.1.5.2. WINTERGREEN OIL
13.3.1.5.3. PEPPERMINT OIL
13.3.1.5.4. OTHERS
13.3.1.6. SPICY OILS
13.3.1.6.1. ANISEED OIL
13.3.1.6.2. BASIL OIL
13.3.1.6.3. BLACK PEPPER OIL
13.3.1.6.4. CARDAMON
13.3.1.6.5. CINNAMON OIL
13.3.1.6.6. CORIANDER OIL
13.3.1.6.7. CUMIN OIL
13.3.1.6.8. DINGER OIL
13.3.1.6.9. NUTMEG OIL
13.3.1.6.10. ALLSPICE OIL
13.3.1.6.11. CASSIA OIL
13.3.1.6.12. CLOVE OIL
13.3.1.6.13. OTHERS
13.3.1.7. RESINOUS / MUSKY OILS
13.3.1.7.1. BENZOIN OIL
13.3.1.7.2. ELEMI OIL
13.3.1.7.3. FRANKINCENSE OIL
13.3.1.7.4. MYRRH OIL
13.3.1.7.5. PERU BALSAM OIL
13.3.1.7.6. OTHERS
13.3.1.8. WOODY / EARTHY OILS
13.3.1.8.1. CYPRESS OIL
13.3.1.8.2. JUNIPER BERRY OIL
13.3.1.8.3. PINE OIL
13.3.1.8.4. SANDALWOOD OIL
13.3.1.8.5. FIR OIL
13.3.1.8.6. CADARWOOD OIL
13.3.1.8.7. PALO SANTO OIL
13.3.1.8.8. ROSEWOOD OIL
13.3.1.8.9. VETIVER OIL
13.3.1.8.10. VALERIAN OIL
13.3.1.8.11. CARROT SEED OIL
13.3.1.8.12. OTHERS
13.3.1.9. OTHERS
13.3.2 AROMA CJHEMICALS
13.3.2.1. YLANG-YLANG
13.3.2.2. OPERANIDE
13.3.2.3. VERASPICE
13.3.2.4. TERPENES
13.3.2.5. BENZENOIDS
13.3.2.6. MUSK CHEMICALS
13.3.2.7. 2 ETHYL PYRAZINE
13.3.2.8. ABBAVERT
13.3.2.9. ACETANISOLE
13.3.2.10. ACETOPHENONE
13.3.2.11. ACETYL ISO EUGENOL
13.3.2.12. ADOXAL
13.3.2.13. LINALOOL
13.3.2.14. CITRAL
13.3.2.15. MENTHOL
13.3.2.16. CIS-3 HEXENOL
13.3.2.17. ISONALINE
13.3.2.18. ALCOHOL
13.3.2.19. ALDEHYDE
13.3.2.20. BENZYL ACETATE
13.3.2.21. BENZYL ALCOHOL
13.3.2.22. BENZYL BENZOATE
13.3.2.23. BENZYL BUTYRATE
13.3.2.24. BENZYL PROPIONATE
13.3.2.25. BENZYL SALICYLATE
13.3.2.26. OTHERS
14 GLOBAL FLAVOURS AND FRAGRANCES MARKET, BY FORM, 2018-2032 (USD MILLION)
14.1 OVERVIEW
14.2 FLAVOURS
14.2.1 DRY
14.2.1.1. POWDER
14.2.1.2. FLAKES
14.2.1.3. GRANULES
14.2.1.4. RESINS
14.2.1.5. OTHERS
14.2.2 LIQUID
14.2.2.1. PASTES
14.2.2.2. OILS
14.2.2.3. OTHERS
14.3 FRAGRANCES
14.3.1 LIQUID
14.3.2 GAS
15 GLOBAL FLAVOURS AND FRAGRANCES MARKET, BY NATURE, 2018-2032 (USD MILLION)
15.1 OVERVIEW
15.2 ORGANIC
15.3 CONVENTIONAL
16 GLOBAL FLAVOURS AND FRAGRANCES MARKET, BY INGREDIENT TYPE, 2018-2032 (USD MILLION)
16.1 OVERVIEW
16.2 NATURAL
16.3 SYNTHETIC
17 GLOBAL FLAVOURS AND FRAGRANCES MARKET, BY SOLUBILITY, 2018-2032 (USD MILLION)
17.1 OVERVIEW
17.2 WATER-SOLUBLE
17.3 OIL-SOLUBLE
17.4 FAT DISPERSIBLE
17.5 OTHERS
18 GLOBAL FLAVOURS AND FRAGRANCES MARKET, BY EXTRACTION PROCESS, 2018-2032 (USD MILLION)
18.1 OVERVIEW
18.2 STEAM DISTILLATION
18.3 COLD PRESSING (EXPRESSION)
18.4 SOLVENT EXTRACTION
18.5 CO₂ SUPERCRITICAL FLUID EXTRACTION (SFE)
18.6 HYDRO DISTILLATION
18.7 MACERATION AND ENFLEURAGE
18.8 FERMENTATION
18.9 CHEMICAL SYNTHESIS
18.1 ENZYME-CATALYZED EXTRACTION
18.11 MOLECULAR DISTILLATION
18.12 SOLID-PHASE EXTRACTION
18.13 OTHERS
19 GLOBAL FLAVOURS AND FRAGRANCES MARKET, BY APPLICATION, 2018-2032 (USD MILLION)
19.1 OVERVIEW
19.2 FLAVOURS
19.2.1 FOOD AND BEVERAGES
19.2.1.1. FOOD
19.2.1.1.1. DAIRY PRODUCTS
19.2.1.1.1.1 YOGHURT
19.2.1.1.1.2 CHEESE
19.2.1.1.1.3 ICE CREAM
19.2.1.1.1.4 BUTTER & MARGARINE
19.2.1.1.1.5 MILK, CREAMS, SOUR CREAMS, & CREAMERS
19.2.1.1.1.6 DAIRY ALTERNATIVES
19.2.1.1.1.7 OTHERS
19.2.1.1.2. BAKERY
19.2.1.1.2.1 COOKIES & BISCUITS
19.2.1.1.2.2 BREADS & ROLLS
19.2.1.1.2.3 CAKES & PASTRIES
19.2.1.1.2.4 DONUTS
19.2.1.1.2.5 MUFFINS
19.2.1.1.2.6 SNACK, NUTRITION AND PERFORMANCE BARS
19.2.1.1.2.7 DOUGHS & MIXES
19.2.1.1.2.8 CEREAL, GRANOLA, & ENERGY BARS
19.2.1.1.2.9 OTHERS
19.2.1.1.3. CONFECTIONERY
19.2.1.1.3.1 CHOCOLATES
19.2.1.1.3.2 GUMMIES
19.2.1.1.3.3 HARD CANDIES
19.2.1.1.3.4 SUGAR CONFECTIONERY
19.2.1.1.3.5 MIXES & COATINGS
19.2.1.1.3.6 MINTS & GUMS
19.2.1.1.3.7 OTHERS
19.2.1.1.4. PROCESSED FOOD
19.2.1.1.4.1 PASTA
19.2.1.1.4.2 NOODLES
19.2.1.1.4.3 EXTRUDED SNACKS
19.2.1.1.4.4 SOUPS AND SAUCES
19.2.1.1.4.5 PLANT BASED PROTEIN
19.2.1.1.4.6 MEAT
19.2.1.1.4.7 FERMENTED
19.2.1.1.4.8 PREPARED FOODS & MEAL KITS
19.2.1.1.4.9 SNACKS
19.2.1.1.4.10 BATTER & BREADING
19.2.1.1.4.11 MEAT SUBSTITUTES & ALTERNATIVES
19.2.1.1.4.12 PIZZA
19.2.1.1.4.13 SOUPS, STEWS, STOCKS & BROTHS
19.2.1.1.4.14 OTHERS
19.2.1.1.5. BREAKFAST CEREALS
19.2.1.1.6. INFANT FORMULA
19.2.1.1.6.1 GROWING UP MILK
19.2.1.1.6.2 STANDARD INFANT FORMULA
19.2.1.1.6.3 FOLLOW-ON FORMULA
19.2.1.1.6.4 SPECIALITY FORMULA
19.2.1.1.6.5 OTHERS
19.2.1.1.7. SPORTS NUTRITION
19.2.1.1.7.1 SPORTS NUTRITION BAR
19.2.1.1.7.2 SPORTS PROTEIN POWDER
19.2.1.1.7.3 OTHERS
19.2.1.1.8. DRESSINGS AND SEASONINGS
19.2.1.1.8.1 DIPS
19.2.1.1.8.2 DRESSING
19.2.1.1.8.3 FERMENTED
19.2.1.1.8.4 COOKING & PASTA SAUCES
19.2.1.1.8.5 MARINADE
19.2.1.1.8.6 CONDIMENTS & TABLE SAUCES
19.2.1.1.8.7 OTHERS
19.2.1.1.9. DAIRY ALTERNATIVE FOOD
19.2.1.1.10. MEAT & POULTRY PRODUCTS
19.2.1.1.11. OTHERS
19.2.1.2. BEVERAGES
19.2.1.2.1. ALCOHOLIC BEVERAGES
19.2.1.2.1.1 COCKTAILS
19.2.1.2.1.2 BEER & MALT
19.2.1.2.1.3 TTB
19.2.1.2.1.4 SPIRITS
19.2.1.2.1.5 HARD SELTZERS
19.2.1.2.1.6 RTD BEVERAGES
19.2.1.2.1.7 WINE
19.2.1.2.1.8 OTHERS
19.2.1.2.2. NON-ALCOHOLIC BEVERAGES
19.2.1.2.2.1 YOGURT DRINKS
19.2.1.2.2.1.1. PLANT-BASED
19.2.1.2.2.1.2. SOY
19.2.1.2.2.1.3. ALMOND
19.2.1.2.2.1.4. CASHEW
19.2.1.2.2.1.5. RICE
19.2.1.2.2.1.6. COCONUT
19.2.1.2.2.1.7. OTHERS
19.2.1.2.2.1.8. DAIRY-BASED
19.2.1.2.2.1.9. COW
19.2.1.2.2.1.10. BUFFALO
19.2.1.2.2.1.11. GOAT
19.2.1.2.2.1.12. SHEEP
19.2.1.2.2.1.13. OTHERS
19.2.1.2.2.2 JUICES
19.2.1.2.2.3 SODA DRINKS
19.2.1.2.2.4 KOMBUCHA DRINKS
19.2.1.2.2.5 PROBIOTIC WATER
19.2.1.2.2.6 DAIRY BASED DRINKS
19.2.1.2.2.7 CARBONATED SOFT DRINKS
19.2.1.2.2.8 FLAVORED & SPARKLING WATER
19.2.1.2.2.9 RTD BEVERAGES
19.2.1.2.2.10 NUTRITIONAL & MEAL REPLACEMENTS
19.2.1.2.2.11 DRINK MIXES, ELECTROLYTES, ENERGY & SPORTS DRINKS
19.2.1.2.2.12 COFFEE
19.2.1.2.2.13 TEA
19.2.1.2.2.14 OTHERS
19.2.2 PHARMACEUTICALS
19.2.2.1. PHARMACEUTICALS, BY APPLICATION
19.2.2.1.1. GASTROINTESTINAL HEALTH
19.2.2.1.2. IMMUNE SYSTEM MODULATION
19.2.2.1.3. ALLERGY MANAGEMENT
19.2.2.1.4. METABOLIC DISORDERS
19.2.2.1.5. MENTAL HEALTH (PSYCHOBIOTICS)
19.2.2.1.6. CARDIOVASCULAR HEALTH
19.2.2.1.7. INTESTINAL DISORDERS
19.2.2.1.8. LACTOSE INTOLERANCE
19.2.2.1.9. INFLAMMATORY BOWEL DISORDERS
19.2.2.1.10. RESPIRATORY INFECTIONS
19.2.2.1.11. OBESITY
19.2.2.1.12. UROGENITAL INFECTIONS
19.2.2.1.12.1 TYPE-2 DIABETES
19.2.2.1.12.2 CANCER
19.2.2.1.13. ORAL AND DENTAL HEALTH
19.2.2.1.14. OTHERS
19.2.2.2. PHARMACEUTICALS, BY PRODUCT FORM
19.2.2.2.1. TABLETS
19.2.2.2.2. PROBIOTIC DRINKS
19.2.2.2.3. POWDERS
19.2.2.2.4. CAPSULES
19.2.2.2.5. OTHERS
19.2.3 DIETARY SUPPLEMENTS
19.2.3.1. DIETARY SUPPLEMENTS, BY FUNCTION
19.2.3.1.1. IMMUNE HEALTH
19.2.3.1.2. GUT & DIGESTIVE HEALTH
19.2.3.1.3. WOMEN’S HEALTH
19.2.3.1.4. SPORTS FITNESS
19.2.3.1.5. ENERGY & WEIGHT MANAGEMENT
19.2.3.1.6. GENERAL HEALTH
19.2.3.1.7. BONE & JOINT HEALTH
19.2.3.1.8. GASTROINTESTINAL HEALTH
19.2.3.1.9. IMMUNITY
19.2.3.1.10. CARDIAC HEALTH
19.2.3.1.11. DIABETES
19.2.3.1.12. ANTI-CANCER
19.2.3.1.13. SKIN/HAIR/NAILS
19.2.3.1.14. BRAIN/MENTAL HEALTH
19.2.3.1.15. OTHERS
19.2.3.2. DIETARY SUPPLEMENTS, BY PRODUCT FORM
19.2.3.2.1. CHEWABLES & GUMMIES
19.2.3.2.2. SOFT GELS
19.2.3.2.3. CAPSULES
19.2.3.2.4. POWDERS
19.2.3.2.5. OTHERS
19.2.4 ANIMAL NUTRITION
19.2.4.1. ANIMAL NUTRITION, BY CATEGORY
19.2.4.1.1. POULTRY
19.2.4.1.1.1 BROILERS
19.2.4.1.1.2 LAYERS
19.2.4.1.1.3 BREEDERS
19.2.4.1.1.4 CHICKS & POULTS
19.2.4.1.1.5 OTHERS
19.2.4.1.2. RUMINANTS
19.2.4.1.2.1 CALVES
19.2.4.1.2.2 DAIRY CATTLE
19.2.4.1.2.3 BEEF CATTLE
19.2.4.1.2.4 OTHERS
19.2.4.1.3. SWINE
19.2.4.1.3.1 STARTER
19.2.4.1.3.2 GROWER
19.2.4.1.3.3 SOW
19.2.4.1.3.4 OTHERS
19.2.4.1.4. PET
19.2.4.1.4.1 CAT
19.2.4.1.4.2 DOG
19.2.4.1.4.3 RABBIT
19.2.4.1.4.4 HORSE
19.2.4.1.4.5 MICE
19.2.4.1.4.6 OTHERS
19.2.4.1.5. AQUATIC ANIMAL
19.2.4.1.5.1 FISH
19.2.4.1.5.1.1. TILAPIA
19.2.4.1.5.1.2. SALMON
19.2.4.1.5.1.3. CARP
19.2.4.1.5.1.4. TROUT
19.2.4.1.5.1.5. OTHERS
19.2.4.1.5.2 CRUSTACEANS
19.2.4.1.5.2.1. SHRIMP
19.2.4.1.5.2.2. CRABS
19.2.4.1.5.2.3. KRILL
19.2.4.1.5.2.4. OTHERS
19.2.4.1.5.3 MOLLUSKS
19.2.4.1.5.3.1. OYSTERS
19.2.4.1.5.3.2. MUSSELS
19.2.4.1.5.3.3. OTHERS
19.2.4.1.5.4 OTHERS
19.2.4.1.6. OTHERS
19.2.4.2. ANIMAL NUTRITION, BY HEALTH FUNCTION
19.2.4.2.1. FEED INTAKE AND EFFICIENCY
19.2.4.2.2. GUT HEALTH
19.2.4.2.3. NUTRITION
19.2.4.2.4. EGG PRODUCTION & QUALITY
19.2.4.2.5. IMMUNITY
19.2.4.2.6. OTHERS
19.2.5 OTHERS
19.3 FRAGRANCES
19.3.1 COSMETICS AND PERSONAL CARE
19.3.1.1. COSMETICS AND PERSONAL CARE, BY CATEGORY
19.3.1.1.1. FACIAL CARE PRODUCTS
19.3.1.1.1.1 CREAMS & LOTIONS
19.3.1.1.1.2 SERUMS
19.3.1.1.1.3 SCRUBS & MASKS
19.3.1.1.1.4 OTHERS
19.3.1.1.2. HAIR CARE PRODUCTS
19.3.1.1.2.1 SHAMPOO
19.3.1.1.2.2 CONDITIONERS
19.3.1.1.2.3 OTHERS
19.3.1.1.3. MAKE-UP PRODUCTS
19.3.1.1.4. SPRAY PERFUMES
19.3.1.1.4.1 EXTRAIT DE PARFUM
19.3.1.1.4.2 EAU DE PERFUME
19.3.1.1.4.3 EAU DE TOILETTE
19.3.1.1.4.4 EAU DE COLOGNE
19.3.1.1.4.5 EAU FRAICHE
19.3.1.1.4.6 OTHERS
19.3.1.1.5. BODY CARE PRODUCTS
19.3.1.1.6. FINE FRAGRANCES
19.3.1.1.7. DEODORANTS
19.3.1.1.7.1 SPRAY
19.3.1.1.7.2 CREAMS
19.3.1.1.7.3 ROLL-ON
19.3.1.1.7.4 OTHERS
19.3.1.1.8. OTHERS
19.3.2 HOME CARE PRODUCTS
19.3.2.1. HOME CARE PRODUCTS, BY TYPE
19.3.2.1.1. TOILET CARE
19.3.2.1.2. LAUNDRY CARE
19.3.2.1.3. AIR CARE
19.3.2.1.4. BLEACH
19.3.2.1.5. DISHWASHING
19.3.2.1.6. INSECTICIDES
19.3.2.1.7. POLISHES
19.3.2.1.8. SURFACE CARE
19.3.2.1.9. SOAPS
19.3.2.1.10. POWDER DETERGENTS
19.3.2.1.11. LIQUID DETERGENTS
19.3.2.1.12. FABRIC SOFTENERS
19.3.2.1.13. DETERGENT TABLETS
19.3.2.1.14. AIR FRESHNERS
19.3.2.1.15. DIFFUSERS
19.3.2.1.15.1 ACTIVE DIFFUSERS
19.3.2.1.15.2 PASSIVE DIFFUSERS
19.3.2.1.16. SCENTED CANDLES
19.3.2.1.17. FABRIC CONDITIONERS
19.3.2.1.18. PERFUME INFUSED WAX
19.3.2.1.19. OTHERS
20 GLOBAL FLAVOURS AND FRAGRANCES MARKET, BY REGION, 2018-2032 (USD MILLION) (KILO TONS)
GLOBAL FLAVOURS AND FRAGRANCES MARKET, (ALL SEGMENTATION PROVIDED ABOVE IS REPRESENTED IN THIS CHAPTER BY COUNTRY)
20.1 NORTH AMERICA
20.1.1 U.S.
20.1.2 CANADA
20.1.3 MEXICO
20.2 EUROPE
20.2.1 GERMANY
20.2.2 U.K.
20.2.3 ITALY
20.2.4 FRANCE
20.2.5 SPAIN
20.2.6 SWITZERLAND
20.2.7 NETHERLANDS
20.2.8 BELGIUM
20.2.9 RUSSIA
20.2.10 TURKEY
20.2.11 REST OF EUROPE
20.3 ASIA-PACIFIC
20.3.1 JAPAN
20.3.2 CHINA
20.3.3 SOUTH KOREA
20.3.4 INDIA
20.3.5 AUSTRALIA & NEW ZEALAND
20.3.6 SINGAPORE
20.3.7 THAILAND
20.3.8 INDONESIA
20.3.9 MALAYSIA
20.3.10 PHILIPPINES
20.3.11 REST OF ASIA-PACIFIC
20.4 SOUTH AMERICA
20.4.1 BRAZIL
20.4.2 ARGENTINA
20.4.3 REST OF SOUTH AMERICA
20.5 MIDDLE EAST AND AFRICA
20.5.1 SOUTH AFRICA
20.5.2 EGYPT
20.5.3 ISRAEL
20.5.4 UAE
20.5.5 SAUDI ARABIA
20.5.6 REST OF MIDDLE EAST AND AFRICA
21 GLOBAL FLAVOURS MARKET, COMPANY LANDSCAPE
21.1 COMPANY SHARE ANALYSIS: GLOBAL
21.2 COMPANY SHARE ANALYSIS: NORTH AMERICA
21.3 COMPANY SHARE ANALYSIS: EUROPE
21.4 COMPANY SHARE ANALYSIS: ASIA-PACIFIC
21.5 COMPANY SHARE ANALYSIS: MIDDLE EAST AND AFRICA
21.6 MERGERS & ACQUISITIONS
21.7 NEW PRODUCT DEVELOPMENT & APPROVALS
21.8 EXPANSIONS & PARTNERSHIP
21.9 REGULATORY CHANGES
22 GLOBAL FRAGRANCES MARKET, COMPANY LANDSCAPE
22.1 COMPANY SHARE ANALYSIS: GLOBAL
22.2 COMPANY SHARE ANALYSIS: NORTH AMERICA
22.3 COMPANY SHARE ANALYSIS: EUROPE
22.4 COMPANY SHARE ANALYSIS: ASIA-PACIFIC
22.5 COMPANY SHARE ANALYSIS: MIDDLE EAST AND AFRICA
22.6 MERGERS & ACQUISITIONS
22.7 NEW PRODUCT DEVELOPMENT & APPROVALS
22.8 EXPANSIONS & PARTNERSHIP
22.9 REGULATORY CHANGES
23 GLOBAL FLAVOURS AND FRAGRANCES MARKET, SWOT & DBMR ANALYSIS
24 GLOBAL FLAVOURS AND FRAGRANCES MARKET, COMPANY PROFILES
24.1 DSM
24.1.1 COMPANY SNAPSHOT
24.1.2 REVENUE ANALYSIS
24.1.3 PRODUCT PORTFOLIO
24.1.4 RECENT UPDATES
24.2 ADM
24.2.1 COMPANY SNAPSHOT
24.2.2 REVENUE ANALYSIS
24.2.3 PRODUCT PORTFOLIO
24.2.4 RECENT UPDATES
24.3 GIVAUDAN
24.3.1 COMPANY SNAPSHOT
24.3.2 REVENUE ANALYSIS
24.3.3 PRODUCT PORTFOLIO
24.3.4 RECENT UPDATES
24.4 KERRY GROUP PLC
24.4.1 COMPANY SNAPSHOT
24.4.2 REVENUE ANALYSIS
24.4.3 PRODUCT PORTFOLIO
24.4.4 RECENT UPDATES
24.5 IFF
24.5.1 COMPANY SNAPSHOT
24.5.2 REVENUE ANALYSIS
24.5.3 PRODUCT PORTFOLIO
24.5.4 RECENT UPDATES
24.6 T.HASEGAWA INC.
24.6.1 COMPANY SNAPSHOT
24.6.2 REVENUE ANALYSIS
24.6.3 PRODUCT PORTFOLIO
24.6.4 RECENT UPDATES
24.7 SYMRISE
24.7.1 COMPANY SNAPSHOT
24.7.2 REVENUE ANALYSIS
24.7.3 PRODUCT PORTFOLIO
24.7.4 RECENT UPDATES
24.8 MANE
24.8.1 COMPANY SNAPSHOT
24.8.2 REVENUE ANALYSIS
24.8.3 PRODUCT PORTFOLIO
24.8.4 RECENT UPDATES
24.9 CORBION
24.9.1 COMPANY SNAPSHOT
24.9.2 REVENUE ANALYSIS
24.9.3 PRODUCT PORTFOLIO
24.9.4 RECENT UPDATES
24.1 TAIYO INTERNATIONAL
24.10.1 COMPANY SNAPSHOT
24.10.2 REVENUE ANALYSIS
24.10.3 PRODUCT PORTFOLIO
24.10.4 RECENT UPDATES
24.11 SOLVAY
24.11.1 COMPANY SNAPSHOT
24.11.2 REVENUE ANALYSIS
24.11.3 PRODUCT PORTFOLIO
24.11.4 RECENT UPDATES
24.12 SYNERGY FLAVORS
24.12.1 COMPANY SNAPSHOT
24.12.2 REVENUE ANALYSIS
24.12.3 PRODUCT PORTFOLIO
24.12.4 RECENT UPDATES
24.13 BELL FLAVORS AND FRAGRANCES, INC.
24.13.1 COMPANY SNAPSHOT
24.13.2 REVENUE ANALYSIS
24.13.3 PRODUCT PORTFOLIO
24.13.4 RECENT UPDATES
24.14 TAKASAGO INTERNATIONAL CORPORATION
24.14.1 COMPANY SNAPSHOT
24.14.2 REVENUE ANALYSIS
24.14.3 PRODUCT PORTFOLIO
24.14.4 RECENT UPDATES
24.15 CARGILL, INCORPORATED
24.15.1 COMPANY SNAPSHOT
24.15.2 REVENUE ANALYSIS
24.15.3 PRODUCT PORTFOLIO
24.15.4 RECENT UPDATES
24.16 MCCORMICK & COMPANY, INC
24.16.1 COMPANY SNAPSHOT
24.16.2 REVENUE ANALYSIS
24.16.3 PRODUCT PORTFOLIO
24.16.4 RECENT UPDATES
24.17 SENSIENT TECHNOLOGIES CORPORATION
24.17.1 COMPANY SNAPSHOT
24.17.2 REVENUE ANALYSIS
24.17.3 PRODUCT PORTFOLIO
24.17.4 RECENT UPDATES
24.18 ABELEI INC
24.18.1 COMPANY SNAPSHOT
24.18.2 REVENUE ANALYSIS
24.18.3 PRODUCT PORTFOLIO
24.18.4 RECENT UPDATES
24.19 AROMATICS + FLAVORS INC
24.19.1 COMPANY SNAPSHOT
24.19.2 REVENUE ANALYSIS
24.19.3 PRODUCT PORTFOLIO
24.19.4 RECENT UPDATES
24.2 BLUE PACIFIC FLAVORS
24.20.1 COMPANY SNAPSHOT
24.20.2 REVENUE ANALYSIS
24.20.3 PRODUCT PORTFOLIO
24.20.4 RECENT UPDATES
24.21 PRINOVA GROUP
24.21.1 COMPANY SNAPSHOT
24.21.2 REVENUE ANALYSIS
24.21.3 PRODUCT PORTFOLIO
24.21.4 RECENT UPDATES
24.22 FLAVORCHEM CORPORATION
24.22.1 COMPANY SNAPSHOT
24.22.2 REVENUE ANALYSIS
24.22.3 PRODUCT PORTFOLIO
24.22.4 RECENT UPDATES
24.23 KINDRED GROUP PLC
24.23.1 COMPANY SNAPSHOT
24.23.2 REVENUE ANALYSIS
24.23.3 PRODUCT PORTFOLIO
24.23.4 RECENT UPDATES
24.24 FLUTTER ENTERTAINMENT PLC
24.24.1 COMPANY SNAPSHOT
24.24.2 REVENUE ANALYSIS
24.24.3 PRODUCT PORTFOLIO
24.24.4 RECENT UPDATES
24.25 EMSA
24.25.1 COMPANY SNAPSHOT
24.25.2 REVENUE ANALYSIS
24.25.3 PRODUCT PORTFOLIO
24.25.4 RECENT UPDATES
NOTE: THE COMPANIES PROFILED IS NOT EXHAUSTIVE LIST AND IS AS PER OUR PREVIOUS CLIENT REQUIREMENT. WE PROFILE MORE THAN 100 COMPANIES IN OUR STUDY AND HENCE THE LIST OF COMPANIES CAN BE MODIFIED OR REPLACED ON REQUEST
25 RELATED REPORTS
26 QUESTIONNAIRE
27 ABOUT DATA BRIDGE MARKET RESEARCH
Research Methodology
Data collection and base year analysis are done using data collection modules with large sample sizes. The stage includes obtaining market information or related data through various sources and strategies. It includes examining and planning all the data acquired from the past in advance. It likewise envelops the examination of information inconsistencies seen across different information sources. The market data is analysed and estimated using market statistical and coherent models. Also, market share analysis and key trend analysis are the major success factors in the market report. To know more, please request an analyst call or drop down your inquiry.
The key research methodology used by DBMR research team is data triangulation which involves data mining, analysis of the impact of data variables on the market and primary (industry expert) validation. Data models include Vendor Positioning Grid, Market Time Line Analysis, Market Overview and Guide, Company Positioning Grid, Patent Analysis, Pricing Analysis, Company Market Share Analysis, Standards of Measurement, Global versus Regional and Vendor Share Analysis. To know more about the research methodology, drop in an inquiry to speak to our industry experts.
Customization Available
Data Bridge Market Research is a leader in advanced formative research. We take pride in servicing our existing and new customers with data and analysis that match and suits their goal. The report can be customized to include price trend analysis of target brands understanding the market for additional countries (ask for the list of countries), clinical trial results data, literature review, refurbished market and product base analysis. Market analysis of target competitors can be analyzed from technology-based analysis to market portfolio strategies. We can add as many competitors that you require data about in the format and data style you are looking for. Our team of analysts can also provide you data in crude raw excel files pivot tables (Fact book) or can assist you in creating presentations from the data sets available in the report.

