Biosimilars Market Overview
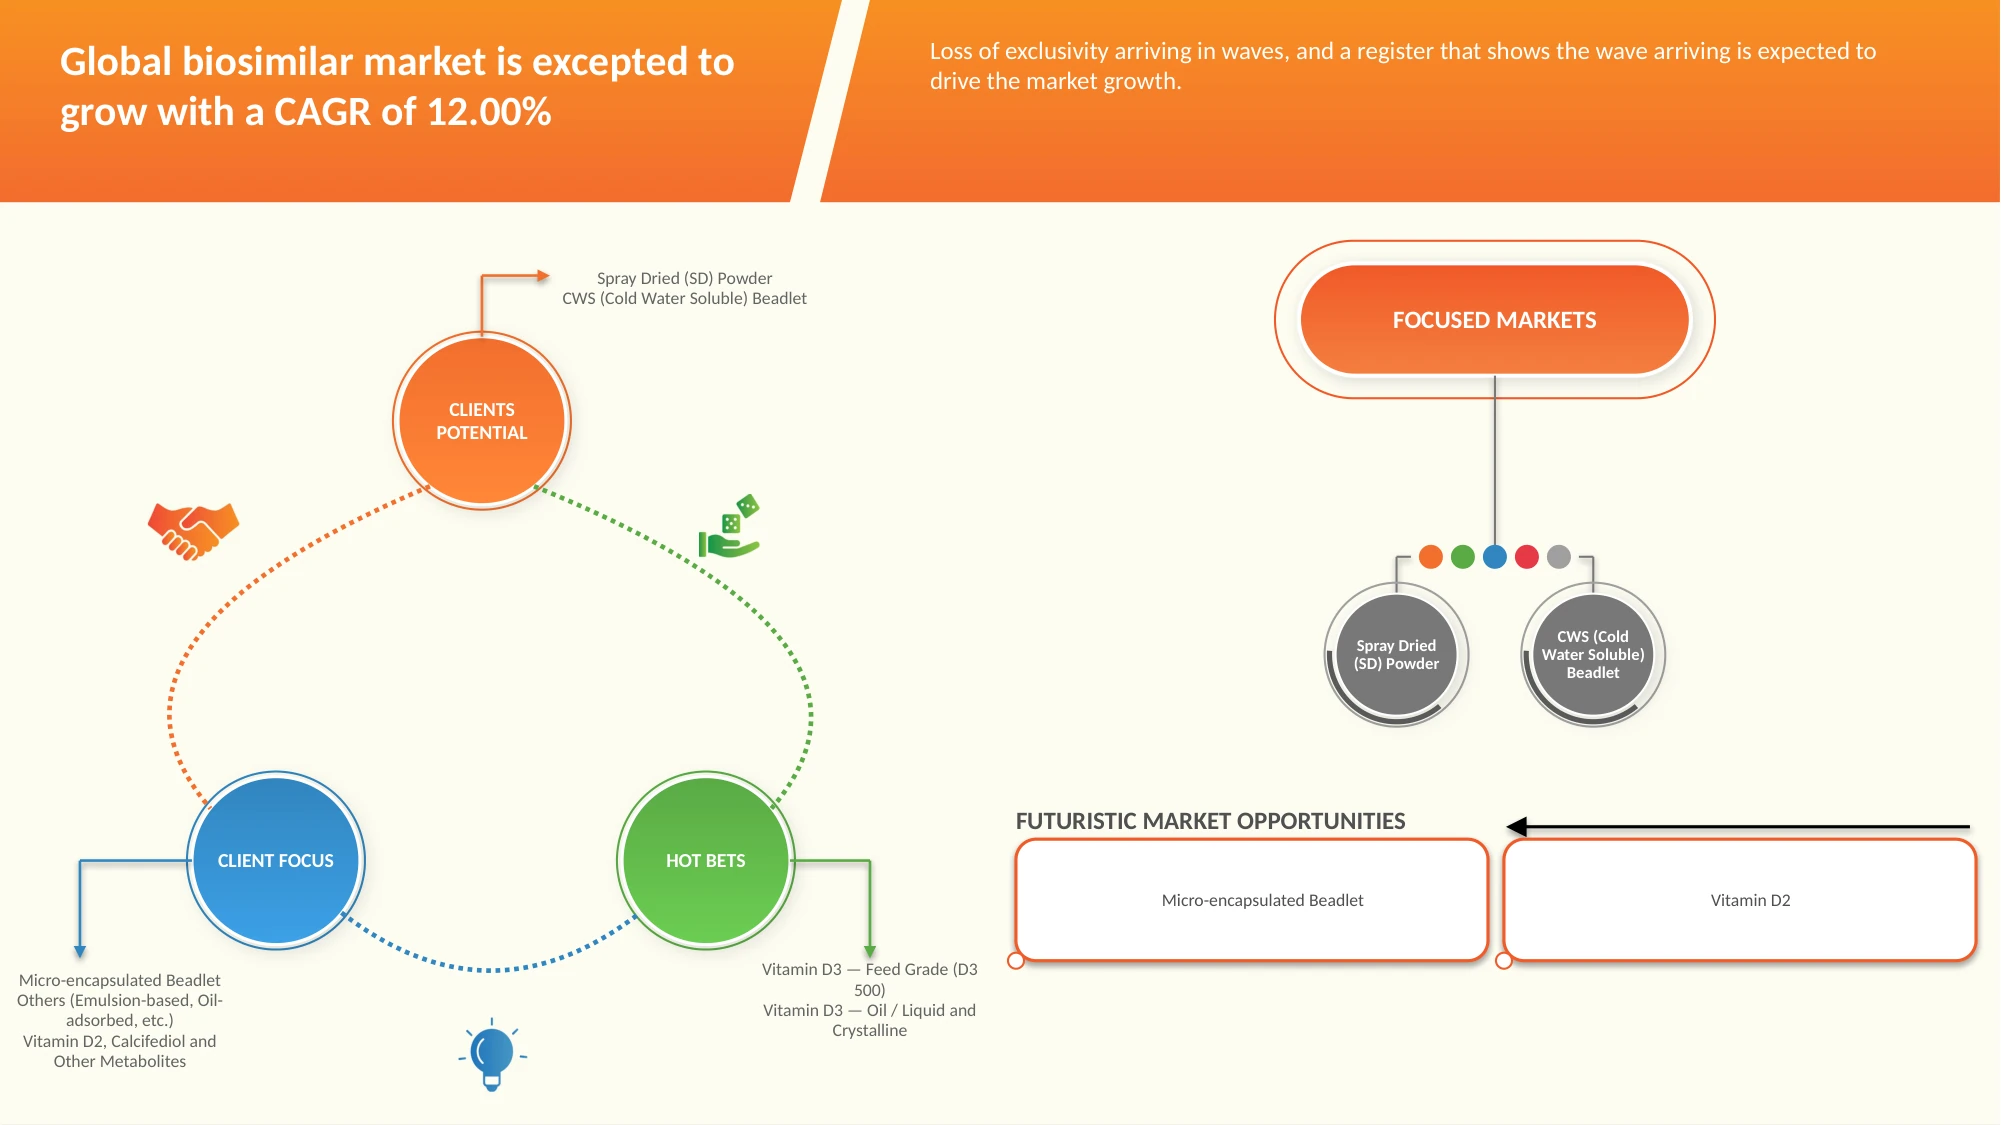
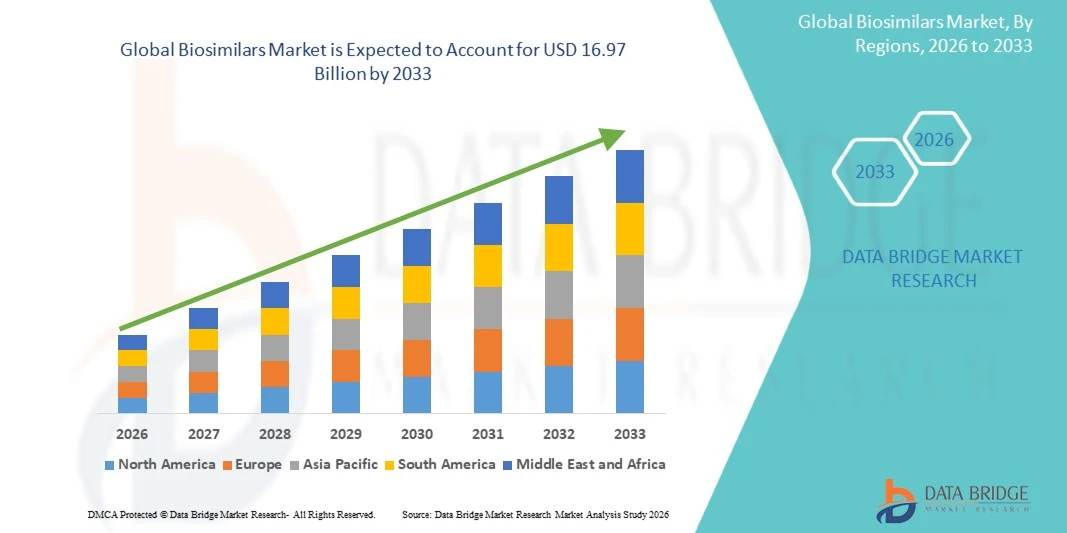
The Global Biosimilars Market was valued at USD 6.85 Billion in 2025 and is projected to reach USD 16.97 Billion by 2033, growing at a CAGR of 12.00% from 2026 to 2033. Market growth is driven by increasing demand for cost-effective alternatives to biologic medicines, rising prevalence of chronic diseases, and expanding applications in oncology, immunology, inflammatory disorders, and diabetes. Growing pressure to reduce healthcare expenditure and improve patient access to advanced therapies is encouraging the adoption of biosimilars. Additionally, the expiration of patents for major biologic drugs, advancements in biopharmaceutical manufacturing, and supportive regulatory frameworks are creating opportunities for biosimilar manufacturers. Asia-Pacific offers significant growth opportunities due to expanding healthcare infrastructure, increasing biotechnology investments, and rising demand for affordable biologic treatments.
Market Size & Forecast
- Global Market Value (2025): USD 6.85 Billion
- Expected Market Value (2033): USD 16.97 Billion
- Forecast CAGR (2026–2033): 12.00%
- Leading Region in 2025: Europe
- Fastest Growing Region: Southeast Asia
Key Market Trends & Insights
- Europe dominated the global biosimilars market, accounting for the largest revenue share of 57.43% in 2025, supported by established regulatory frameworks, widespread adoption of biosimilar medicines, and strong healthcare systems. Patent expirations of biologic drugs, cost-containment initiatives, and procurement policies promoting affordable treatments have supported biosimilar uptake across major European countries.
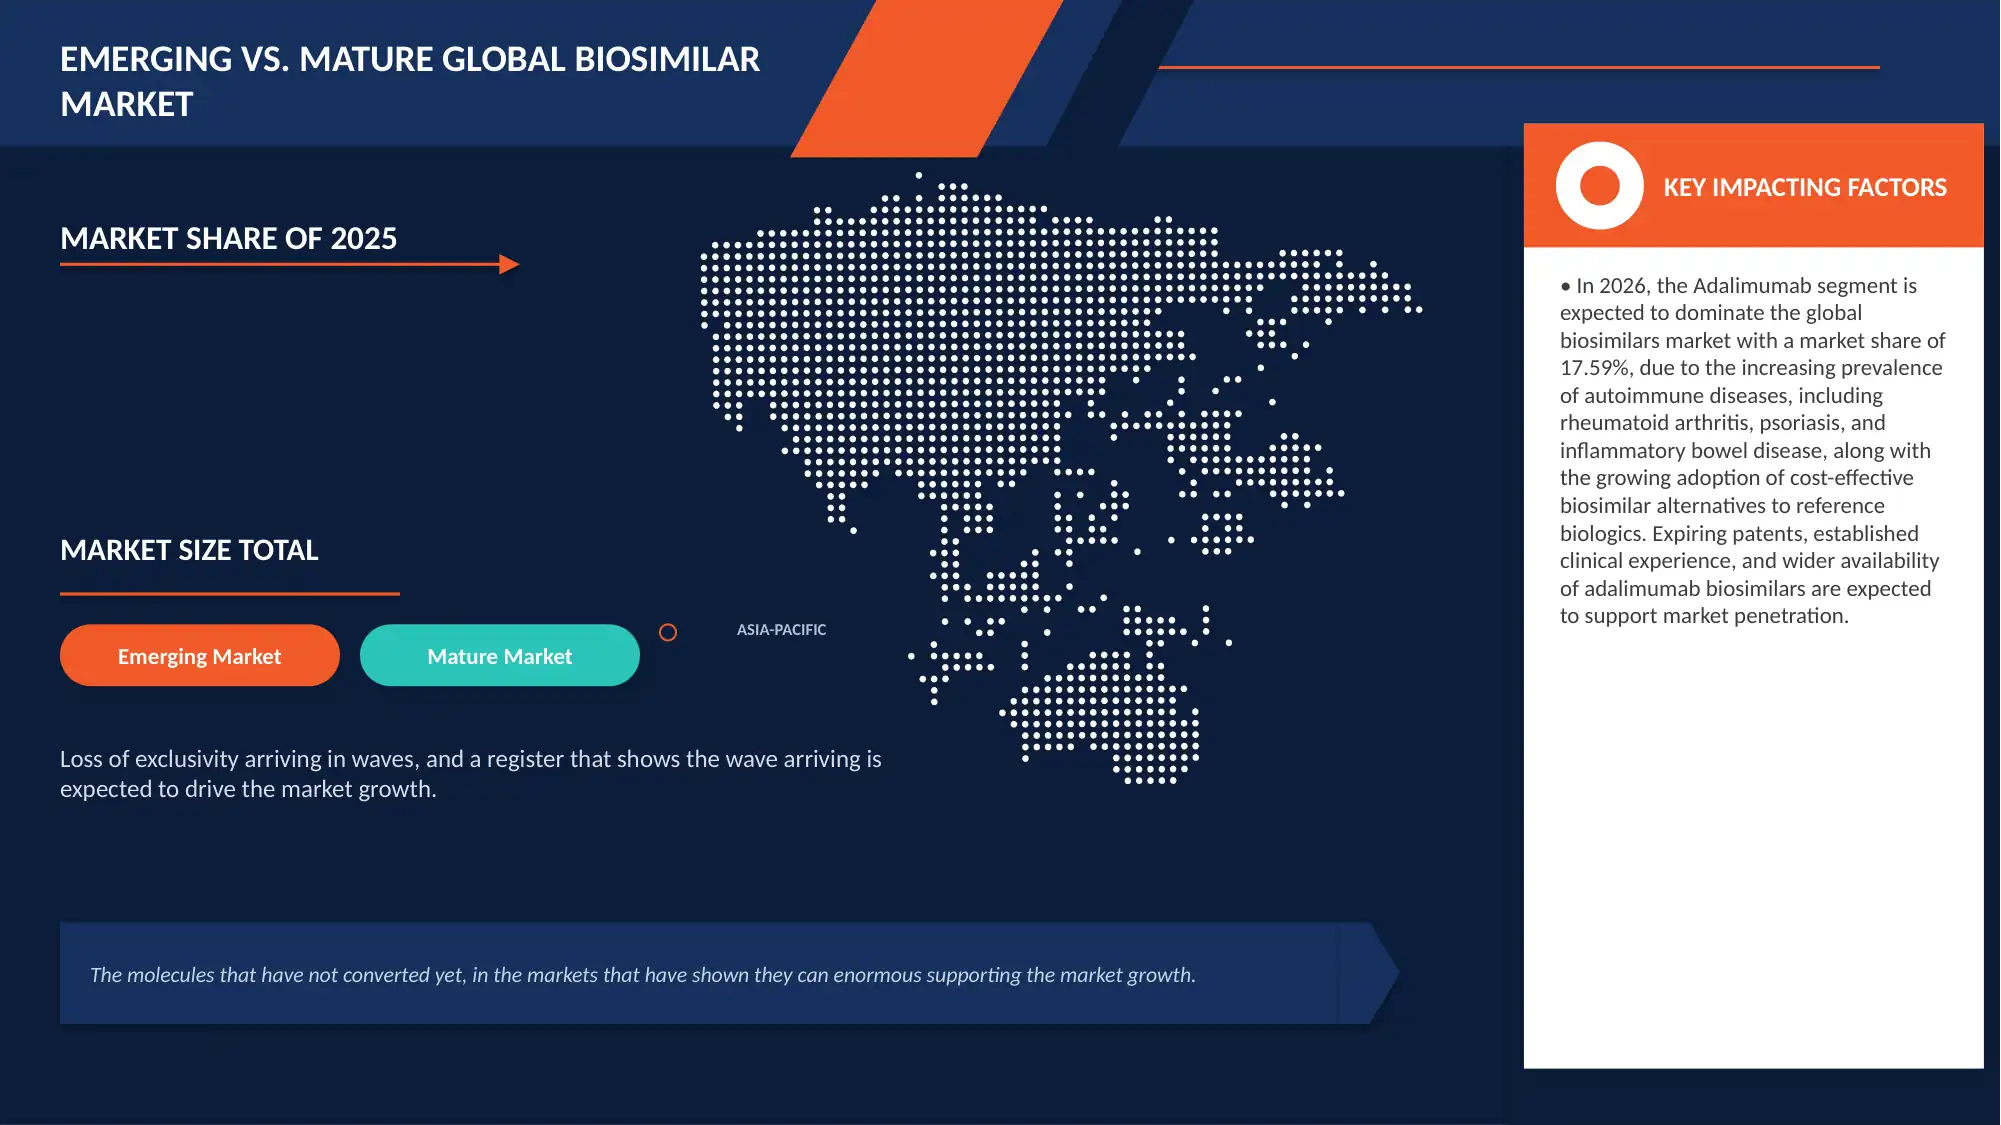
- The adalimumab segment dominated the global biosimilars market, accounting for a revenue share of 17.59% in 2025, driven by its extensive use in treating autoimmune and inflammatory conditions, including rheumatoid arthritis, psoriasis, Crohn’s disease, and ulcerative colitis.
- Southeast Asia is expected to be the fastest-growing region in the global biosimilars market, registering a CAGR of 12.00% during 2026–2033. Growth is supported by increasing demand for affordable biologic therapies, expanding healthcare infrastructure, and rising prevalence of chronic diseases.
- The immunology and inflammation segment dominated the global biosimilars market, accounting for a revenue share of 44.12% in 2025, driven by the widespread use of biologic medicines for autoimmune and chronic inflammatory conditions. Increasing demand for treatments for rheumatoid arthritis, psoriasis, Crohn’s disease, and ulcerative colitis is supporting biosimilar adoption.
- The marketed segment dominated the global biosimilars market, accounting for a revenue share of 99.52% in 2025, reflecting the established commercial availability of approved biosimilar products across multiple therapeutic areas. Increasing adoption by hospitals, specialty clinics, and healthcare providers is supporting demand for marketed products.
- The hospital segment dominated the global biosimilars market, accounting for a revenue share of 52.75% in 2025, driven by the widespread administration of biologic medicines in hospital settings, particularly for oncology, immunology, and inflammatory diseases. Hospitals benefit from specialized healthcare professionals, appropriate drug administration infrastructure, and centralized procurement systems
- The public tender segment is expected to be the fastest-growing distribution channel in the global biosimilars market, registering a CAGR of 14.37% during 2026–2033. Growth is driven by government efforts to improve access to affordable biologic medicines and control public healthcare expenditure. Competitive bidding, centralized procurement, and large-volume purchasing by public hospitals and healthcare institutions are encouraging biosimilar adoption.
Report Scope and Biosimilars Market Segmentation
|
Attributes |
Biosimilars Key Market Insights |
|
Segments Covered |
|
|
Countries Covered |
Europe
Latin America
China Southeast Asia
Middle East & North Africa
|
|
Key Market Players |
|
|
Market Opportunities |
|
|
Value Added Data Infosets |
In addition to the insights on market scenarios such as market value, growth rate, segmentation, geographical coverage, and major players, the market reports curated by the Data Bridge Market Research also include in-depth expert analysis, patient epidemiology, pipeline analysis, pricing analysis, and regulatory framework. |
Biosimilars Market Trends
Trend: Expanding Biosimilar Portfolios and Advancements in Biomanufacturing
The global biosimilars market is increasingly focusing on expanding product portfolios, improving manufacturing efficiency, and developing cost-effective alternatives to reference biologic medicines. Manufacturers are introducing biosimilars across therapeutic areas such as oncology, immunology, inflammatory diseases, and diabetes to improve patient access to biologic treatments. Patent expirations of major biologic medicines are creating opportunities for new market entrants, while advances in cell-line development, process optimization, analytical characterization, and manufacturing technologies are supporting product development. Additionally, growing emphasis on healthcare cost containment, increasing regulatory approvals, and wider acceptance among healthcare professionals are encouraging biosimilar adoption. Strategic collaborations, manufacturing investments, and expanded commercialization capabilities are further shaping competition in the global biosimilars market.
For instance,
- In October 2025, the U.S. Food and Drug Administration (FDA) announced proposed measures to simplify biosimilar development, including reducing unnecessary clinical testing requirements and making interchangeability development more efficient. These regulatory initiatives were intended to lower development costs and support broader patient access to affordable biologic medicines.
- In November 2025, the FDA approved Poherdy (pertuzumab-dpzb), developed by Shanghai Henlius Biologics, as an interchangeable biosimilar to Perjeta. This marked the first biosimilar approval for Perjeta and expanded treatment options for patients with HER2-positive breast cancer.
- In April 2026, Biocon Biologics announced the U.S. commercial launch of Bosaya and Aukelso, denosumab biosimilars referencing Prolia and Xgeva. The launch expanded the availability of biosimilar treatment options in bone health and oncology-related indications, demonstrating the growing commercial opportunities associated with biosimilars for established biologic medicines.
Overall, these developments highlight the growing importance of regulatory innovation, product approvals, and commercial expansion in the global biosimilars market. Increasing patent expirations, efforts to reduce healthcare expenditure, and demand for affordable biologic therapies are encouraging manufacturers to expand their portfolios and strengthen production and distribution capabilities. Continued investment in biomanufacturing, strategic partnerships, and regulatory development is expected to support biosimilar innovation and market growth during the forecast period.
Biosimilars Market Dynamics
Key Market Driver: Rising Demand for Cost-Effective Biologic Therapies and Expanding Biosimilar Adoption
The global biosimilars market is experiencing growth due to increasing demand for affordable alternatives to reference biologic medicines and the need to reduce healthcare expenditure. Biosimilars are increasingly being adopted across therapeutic areas such as oncology, immunology, inflammatory diseases, and diabetes, where biologic treatments are widely used. The expiration of patents and market exclusivity for major biologic drugs is creating opportunities for manufacturers to introduce biosimilar products and increase competition. In addition, growing pressure on healthcare systems to improve patient access to advanced treatments is encouraging hospitals, healthcare providers, and payers to consider biosimilars. Improvements in biomanufacturing technologies, evolving regulatory pathways, and increasing acceptance among physicians are further supporting market development. These factors are creating opportunities for biosimilar manufacturers to expand their product portfolios and strengthen their presence across global pharmaceutical markets.
For instance,
- In October 2025, the U.S. Food and Drug Administration (FDA) proposed changes to simplify biosimilar development studies and reduce unnecessary clinical testing. The initiative aimed to streamline regulatory requirements and facilitate the development of more affordable biosimilar medicines.
- In March 2026, the FDA issued draft guidance recommending that unnecessary pharmacokinetic (PK) testing could be streamlined when scientifically justified. The proposed approach was intended to reduce development costs and support more efficient biosimilar development.
- In May 2026, the FDA approved Immgolis and Immgolis Intri, the first interchangeable biosimilars to Simponi and Simponi Aria, respectively. The products expanded biosimilar treatment options for rheumatoid arthritis and ulcerative colitis, supporting competition in the immunology and inflammation segment.
Overall, these developments highlight the growing importance of cost-effective treatment options, streamlined regulatory pathways, and expanding therapeutic applications in the global biosimilars market. Increasing demand for affordable biologic medicines, patent expirations, and advancements in biosimilar development are encouraging manufacturers to expand their product pipelines and commercial portfolios. Continued regulatory support and growing healthcare system adoption are expected to create further opportunities for biosimilar manufacturers during the forecast period.
Key Restraint/Challenge: Regulatory Complexity, High Development Costs, and Market Access Barriers
The global biosimilars market faces challenges associated with complex regulatory requirements, high development costs, and difficulties in achieving widespread market adoption. Unlike conventional generic medicines, biosimilars require extensive analytical characterization, comparative studies, and evidence demonstrating similarity to reference biologic products in terms of quality, safety, and efficacy. These requirements increase development timelines and financial investment for manufacturers. In addition, differences in regulatory pathways across countries can complicate product approvals and international commercialization. Pricing pressure, reimbursement restrictions, and competition among multiple biosimilar manufacturers can also affect profitability. Limited physician familiarity, patient concerns regarding switching from reference biologics, and differences in prescribing and substitution policies may further slow adoption. Consequently, manufacturers must balance competitive pricing with the investment required to maintain manufacturing quality, meet regulatory standards, and establish confidence among healthcare professionals and patients.
For instance,
- In October 2025, the U.S. Food and Drug Administration (FDA) announced proposed changes to biosimilar development guidance, including measures to reduce unnecessary comparative efficacy studies and streamline development requirements. These changes were intended to reduce development costs and accelerate access to biosimilar medicines.
- In August 2025, the U.S. Department of Health and Human Services published an analysis of biosimilar market entry challenges, highlighting how development costs, uncertain commercial returns, and low adoption can discourage manufacturers from entering the market. The findings underscored the importance of improving market access and creating sustainable incentives for biosimilar development.
- In July 2025, the U.S. Department of Health and Human Services published an analysis of competition in the U.S. therapeutic biologics market, reporting that biosimilar competition remained limited for many biologic medicines despite patent protection ending. The findings highlighted the challenges associated with pricing, market penetration, and the transition from reference biologics to biosimilars.
Overall, these developments highlight the importance of efficient regulatory pathways, sustainable pricing strategies, and stronger market adoption in addressing challenges within the global biosimilars market. High development costs, patent disputes, varying regulatory requirements, and limited physician or patient confidence can delay commercialization and restrict market penetration. Continued regulatory improvements, greater stakeholder education, and more predictable reimbursement and procurement policies will be important for supporting competition and improving access to biosimilar medicines during the forecast period.
Key Market Opportunity: Expanding Patent Expirations and Growing Demand for Cost-Effective Biologic Therapies
The global biosimilars market is presenting significant opportunities as patents and market exclusivity periods for major biologic medicines expire, allowing manufacturers to introduce biosimilar alternatives across multiple therapeutic areas. Increasing demand for affordable treatments for cancer, autoimmune disorders, inflammatory diseases, and diabetes is encouraging pharmaceutical companies to expand their biosimilar portfolios. Manufacturers are investing in advanced bioprocessing technologies, manufacturing capacity, analytical characterization, and regulatory capabilities to support the development and commercialization of biosimilars. In addition, growing pressure on healthcare systems to control treatment costs and improve access to biologic medicines is supporting adoption across hospitals, specialty clinics, and public healthcare programs. Public procurement initiatives, competitive tendering, and collaborations between biotechnology companies are creating further opportunities for biosimilar manufacturers to strengthen market access and expand their geographic presence.
For instance,
- In October 2025, the U.S. Food and Drug Administration (FDA) announced proposed measures to accelerate biosimilar development and reduce development costs, including simplifying certain biosimilarity studies and facilitating the development of interchangeable biosimilars. These measures were intended to support competition and improve patient access to lower-cost biologic treatments.
- In April 2026, Biocon announced the U.S. commercial launch of Bosaya and Aukelso, its denosumab biosimilars referencing Prolia and Xgeva, respectively. The launch expanded the availability of biosimilar treatment options for osteoporosis and the prevention of skeletal-related complications associated with cancer, creating opportunities in bone health and oncology-related therapies.
- In October 2026, Samsung Bioepis and Teva expanded their strategic partnership to develop and commercialize up to six potential biosimilar candidates, including candidates referencing Fasenra (benralizumab) and Ilaris (canakinumab). The collaboration combined Samsung Bioepis' development and manufacturing capabilities with Teva's commercial reach, supporting the advancement of potential treatment options for inflammatory and immune-mediated diseases.
Overall, these developments highlight the growing importance of regulatory advancements, commercial product launches, and strategic collaborations in the global biosimilars market. Increasing demand for affordable biologic therapies, combined with upcoming patent expirations and efforts to streamline development processes, is encouraging manufacturers to expand their product pipelines and commercial capabilities. Continued investment in biotechnology, manufacturing infrastructure, and partnerships is expected to create further opportunities for biosimilar manufacturers during the forecast period.
Biosimilars Market Scope
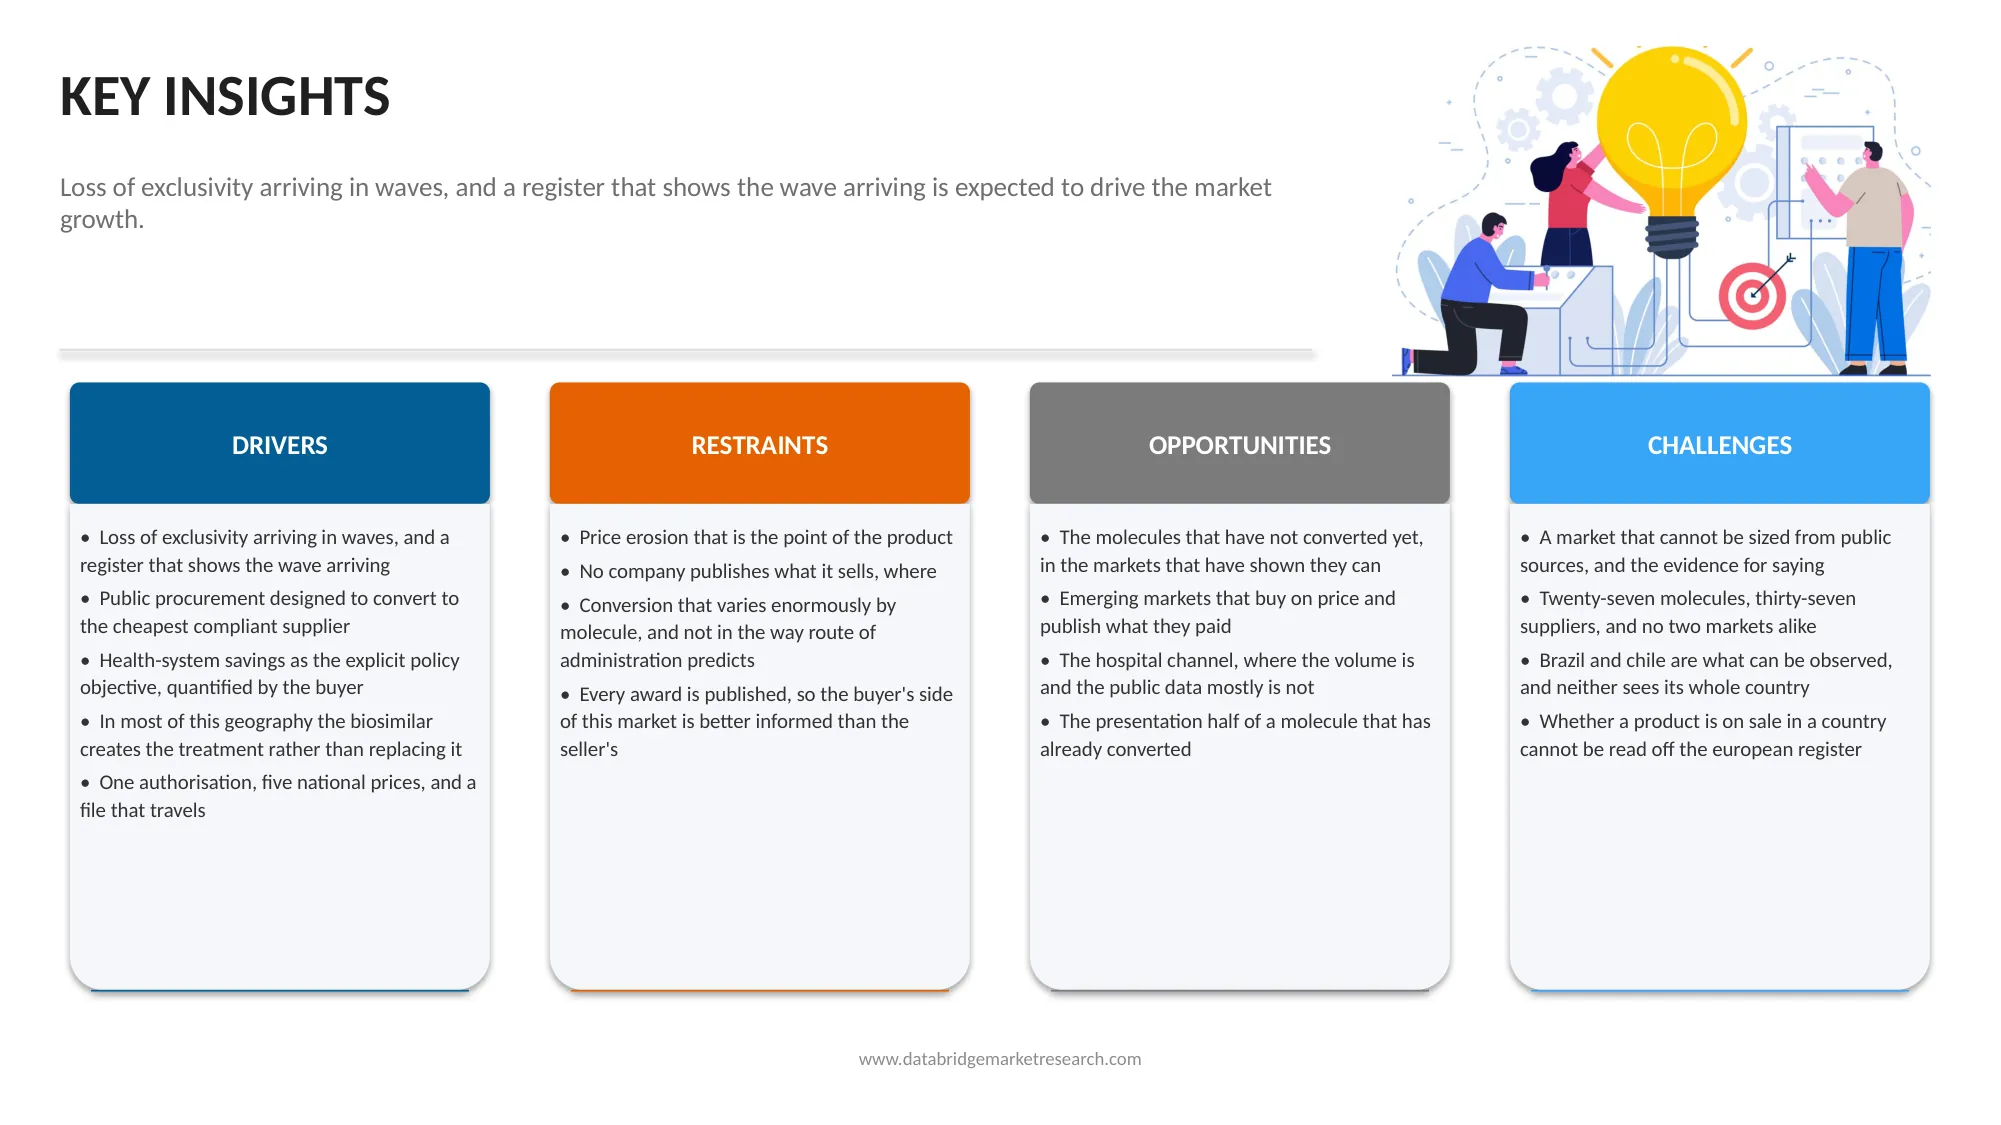
The global biosimilar market is segmented into five notable segments based on molecule, therapeutic group, market status, channel, and distribution channel.
- By molecule
On the basis of molecule, the global biosimilar market is segmented into denosumab, aflibercept, ustekinumab, adalimumab, pegfilgrastim, bevacizumab, ranibizumab, trastuzumab, filgrastim, rituximab, teriparatide, etanercept, tocilizumab, epoetin alfa, infliximab, insulin aspart, insulin glargine, eculizumab, epoetin zeta, follitropin alfa, golimumab, insulin lispro, enoxaparin sodium, natalizumab, omalizumab, pertuzumab, and somatropi. In 2025, the adalimumab segment is expected to dominate the global biosimilars market with a market share of 18.99%, due to its extensive use in treating autoimmune and inflammatory conditions, including rheumatoid arthritis, psoriasis, Crohn’s disease, ulcerative colitis, and ankylosing spondylitis. The expiration of exclusivity for Humira, the reference biologic, has enabled the entry of multiple adalimumab biosimilars, increasing competition and expanding treatment options.
The tocilizumab segment is projected to register the fastest CAGR of 18.58% from 2026 to 2033, owing to increasing demand for cost-effective biologic treatments for autoimmune and inflammatory conditions, particularly rheumatoid arthritis and giant cell arteritis. Tocilizumab biosimilars offer lower-cost alternatives to the reference biologic, Actemra, supporting efforts to reduce healthcare expenditure and improve patient access.
- By therapeutic group
On the basis of therapeutic group, the global biosimilar market is segmented into immunology and inflammation, oncology, ophthalmology, haematology and supportive care, bone and metabolic, diabetes, endocrinology and fertility, and respiratory and allergy. In 2025, the Immunology and Inflammation segment is expected to dominate the global biosimilars market with a market share of 44.69%, due to the rising prevalence of autoimmune and chronic inflammatory diseases, including rheumatoid arthritis, psoriasis, Crohn’s disease, and ulcerative colitis. The widespread use of biologic medicines such as adalimumab, infliximab, and etanercept, along with the availability of biosimilar alternatives, is supporting segment growth.
The immunology and inflammation segment is projected to register the fastest CAGR of 13.33% from 2026 to 2033, owing to the rising prevalence of autoimmune and chronic inflammatory diseases, increasing demand for long-term biologic therapies, and growing availability of cost-effective biosimilar alternatives. The expiration of patents for established biologics, including adalimumab, infliximab, and etanercept, is creating opportunities for manufacturers to introduce competing products and expand treatment access.
- By market status
On the basis of market status, the global biosimilar market is segmented into marketed, approved not launched, filed, not present, and not known. In 2025, the marketed segment is expected to dominate the global biosimilars market with a market share of 99.52%, due to the established commercial availability of approved biosimilar products across multiple therapeutic areas, including immunology, oncology, haematology, and diabetes. These products have completed the required regulatory review and are available for use in eligible markets, supporting adoption among healthcare providers, hospitals, and patients.
The marketed segment is projected to register the fastest CAGR of 12.00% from 2026 to 2033, owing to the increasing commercial availability and adoption of approved biosimilar products across therapeutic areas, including immunology, oncology, haematology, and diabetes. Growing demand for cost-effective alternatives to reference biologics, combined with the expiration of patents for major biologic medicines, is creating opportunities for marketed biosimilars to expand their market presence.
- By channel
On the basis of channel, the global biosimilar market is segmented into public tender, hospital, retail pharmacy, and private market. In 2025, the public tender segment is expected to dominate the global biosimilars market with a market share of 50.00%, due to the increasing procurement of biologic medicines through government healthcare programs, public hospitals, and centralized purchasing agencies. Public tenders enable healthcare systems to negotiate competitive prices by inviting bids from multiple biosimilar manufacturers, helping reduce treatment costs and improve access to essential biologic therapies.
The public tender segment is projected to register the fastest CAGR of 13.80% from 2026 to 2033, owing to the increasing focus of governments and public healthcare systems on reducing biologic treatment costs and improving access to affordable medicines. Competitive bidding enables healthcare authorities to negotiate favorable prices from multiple biosimilar manufacturers, encouraging wider adoption across public hospitals and national healthcare programs.
Biosimilars Market Regional Analysis
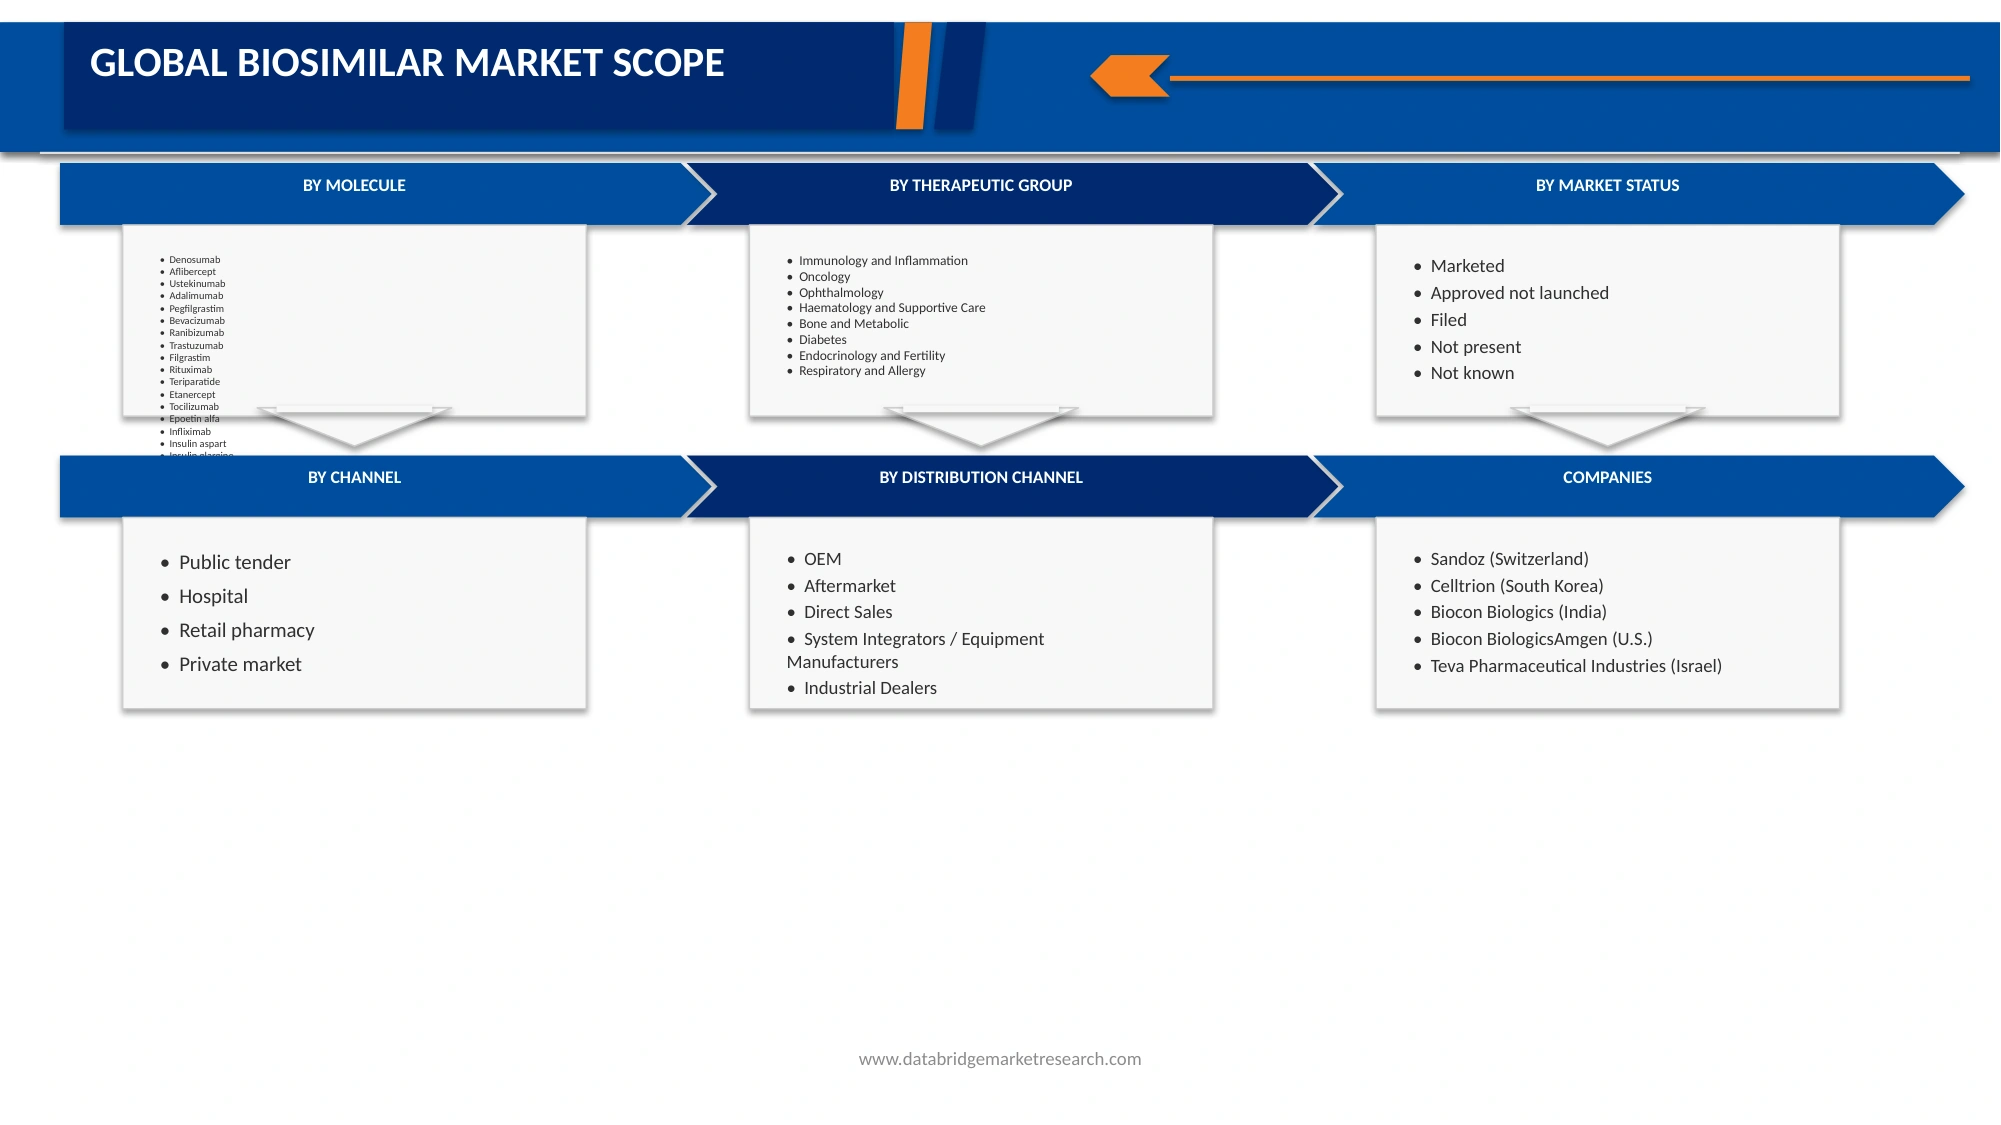
Europe dominated the global biosimilars market and accounted for the largest revenue share of 57.43% in 2025, driven by the region’s well-established regulatory framework, early adoption of biosimilar medicines, and strong emphasis on reducing healthcare expenditure. The European Medicines Agency (EMA) has played a significant role in establishing regulatory pathways that support biosimilar development, approval, and market entry. In addition, the widespread use of biosimilars across oncology, immunology, and inflammatory diseases, combined with supportive reimbursement policies, competitive procurement practices, and increasing acceptance among healthcare professionals, has strengthened regional market growth.
Moreover, the Europe region is projected to register the highest CAGR of 12.00% during 2026–2033, driven by the increasing adoption of cost-effective biosimilar medicines, rising demand for treatments for chronic and autoimmune diseases, and continued efforts to reduce healthcare expenditure. The region’s established regulatory framework, supported by the European Medicines Agency, facilitates biosimilar development and market entry. In addition, the expiration of patents for major biologic drugs, expanding product availability, competitive tendering practices, and growing acceptance among healthcare professionals are expected to accelerate biosimilar uptake across hospitals and healthcare systems throughout Europe.
China Biosimilars Market Insight
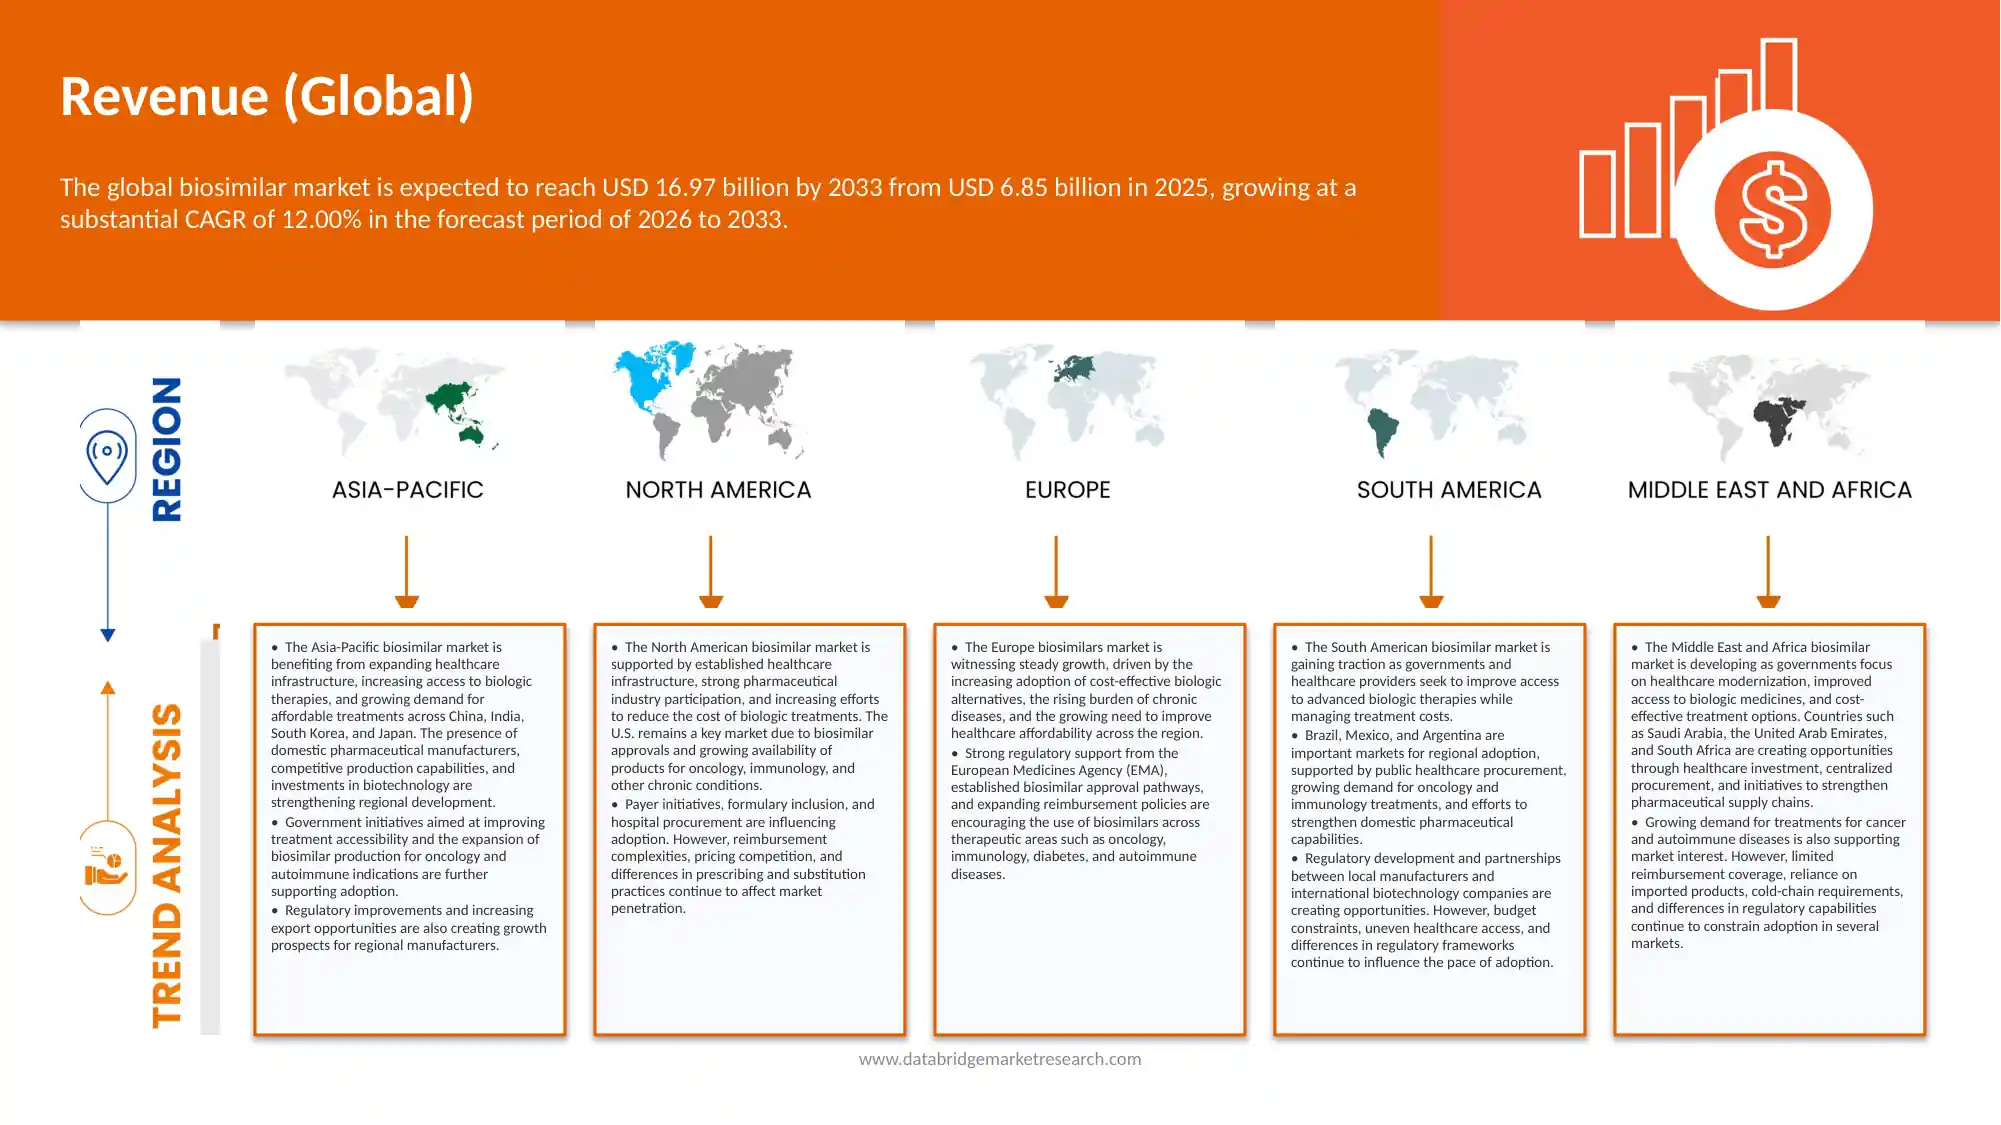
The China biosimilars market is experiencing growth due to the rising prevalence of chronic diseases, increasing demand for affordable biologic therapies, and government initiatives to improve healthcare accessibility. The National Medical Products Administration (NMPA) has established regulatory pathways supporting biosimilar development and approval, encouraging domestic pharmaceutical companies to expand their product portfolios. In addition, centralized procurement programs, growing biotechnology investments, and the expiration of patents for major biologic medicines are strengthening market competition. Increasing applications in oncology, immunology, and inflammatory diseases are expected to support market expansion throughout the forecast period.
Japan Biosimilars Market Insight
The Japan biosimilars market is expected to grow steadily, driven by the rising prevalence of chronic diseases, an aging population, and increasing healthcare expenditure. Growing demand for affordable treatments for cancer, autoimmune disorders, and inflammatory conditions is encouraging the adoption of biosimilar medicines. Japan’s established regulatory framework, supported by the Pharmaceuticals and Medical Devices Agency, facilitates the review and approval of biosimilar products. In addition, government initiatives to promote generic and biosimilar utilization, reduce medical costs, and improve access to advanced biologic therapies are expected to support market expansion during the forecast period.
Europe Biosimilars Market Insight
The Europe biosimilars market is experiencing strong growth, supported by an established regulatory framework, increasing healthcare cost-containment initiatives, and widespread acceptance of biosimilar medicines. The region benefits from the European Medicines Agency’s regulatory pathways, which facilitate the approval and commercialization of biosimilars. Rising demand for affordable treatments for oncology, autoimmune disorders, and inflammatory diseases is further supporting market expansion. In addition, patent expirations of major biologic medicines, competitive tendering practices, and growing adoption across hospitals and public healthcare systems are expected to strengthen the market throughout the forecast period.
North America Biosimilars Market Insight
The North America biosimilars market is driven by increasing demand for cost-effective biologic therapies, rising healthcare expenditure, and the growing prevalence of cancer, autoimmune disorders, and chronic inflammatory diseases. The U.S. accounts for a significant share of regional demand, supported by expanding biosimilar approvals, increasing competition among manufacturers, and initiatives to improve patient access to affordable treatments. In addition, patent expirations of major biologic medicines and growing participation by pharmaceutical companies are creating opportunities for market expansion. However, reimbursement complexities, pricing pressures, and variations in physician acceptance may influence adoption across the region.
Biosimilars Market Share
The global biosimilars industry is primarily led by well-established companies, including:
- Sandoz (Switzerland)
- Celltrion (South Korea)
- Biocon Biologics (India)
- Amgen (U.S.)
- Teva Pharmaceutical Industries (Israel)
- Organon (U.S.)
- Samsung Bioepis (South Korea)
- Fresenius Kabi (Germany)
- STADA Arzneimittel AG (Germany)
- Accord Healthcare (U.K.)
- Viatris (U.S.)
- Pfizer (U.S.)
- Coherus BioSciences (U.S.)
- Gan & Lee Pharmaceuticals (China)
Latest Developments in Biosimilars Market
- In October 2026, Samsung Bioepis and Teva expanded their partnership to develop and commercialize up to six biosimilar candidates, including candidates referencing Fasenra and Ilaris. Strengthens the development pipeline and commercial reach across the U.S., Europe, and Canada.
- In August 2026, Amneal Pharmaceuticals completed its acquisition of Kashiv BioSciences. Combines biosimilar research, development, manufacturing, and commercialization capabilities to support future product launches.
- In July 2026, Formycon partnered with OneSource Specialty Pharma for biosimilar manufacturing. Expands drug-substance and drug-product manufacturing capabilities to support global biosimilar programs.
- In May 2026, Formycon and Klinge Biopharma launched the aflibercept biosimilar products Ahzantive and Baiama in the EU, with initial rollouts in Germany, France, and Italy. Expands competition in ophthalmology and provides additional treatment options for retinal diseases.
- In March 2026, Samsung Bioepis partnered with Sandoz to develop and commercialize up to five biosimilar candidates, including a vedolizumab candidate referencing Entyvio. Strengthens the biosimilar pipeline in immunology and supports broader commercialization across global markets.
- Interactive Data Analysis Dashboard
- Company Analysis Dashboard for high growth potential opportunities
- Research Analyst Access for customization & queries
- Competitor Analysis with Interactive dashboard
- Latest News, Updates & Trend analysis
- Harness the Power of Benchmark Analysis for Comprehensive Competitor Tracking
Table of Content
1 EXECUTIVE SUMMARY
2 MARKET DEFINITION, SCOPE AND SEGMENTATION
2.1 PRODUCTS INCLUDED AND EXCLUDED
2.2 SEGMENTATION AXES AND THEIR VALUES
2.3 COUNTRIES AND REGIONAL GROUPINGS
2.4 PRODUCTS APPEARING IN BOTH REPORTS
3 RESEARCH METHODOLOGY AND DATA SOURCES
3.1 SOURCE HIERARCHY AND WHAT EACH SOURCE COVERS
3.2 REPORTED, DERIVED AND ESTIMATED: EX-U.S. AND EX-INDIA
3.3 COVERAGE MAP: EX-U.S. AND EX-INDIA
3.4 ASSUMPTIONS AND LIMITATIONS
4 BIOSIMILARS MARKET OVERVIEW
5 MARKET DYNAMICS
5.1 DRIVERS
5.1.1 LOSS OF EXCLUSIVITY ARRIVING IN WAVES, AND A REGISTER THAT SHOWS THE WAVE ARRIVING
5.1.2 PUBLIC PROCUREMENT DESIGNED TO CONVERT TO THE CHEAPEST COMPLIANT SUPPLIER
5.1.3 HEALTH-SYSTEM SAVINGS AS THE EXPLICIT POLICY OBJECTIVE, QUANTIFIED BY THE BUYER
5.1.4 IN MOST OF THIS GEOGRAPHY THE BIOSIMILAR CREATES THE TREATMENT RATHER THAN REPLACING IT
5.1.5 ONE AUTHORISATION, FIVE NATIONAL PRICES, AND A FILE THAT TRAVELS
5.2 RESTRAINTS
5.2.1 PRICE EROSION THAT IS THE POINT OF THE PRODUCT
5.2.2 NO COMPANY PUBLISHES WHAT IT SELLS, WHERE
5.2.3 CONVERSION THAT VARIES ENORMOUSLY BY MOLECULE, AND NOT IN THE WAY ROUTE OF ADMINISTRATION PREDICTS
5.2.4 EVERY AWARD IS PUBLISHED, SO THE BUYER'S SIDE OF THIS MARKET IS BETTER INFORMED THAN THE SELLER'S
5.3 OPPORTUNITIES
5.3.1 THE MOLECULES THAT HAVE NOT CONVERTED YET, IN THE MARKETS THAT HAVE SHOWN THEY CAN
5.3.2 EMERGING MARKETS THAT BUY ON PRICE AND PUBLISH WHAT THEY PAID
5.3.3 THE HOSPITAL CHANNEL, WHERE THE VOLUME IS AND THE PUBLIC DATA MOSTLY IS NOT
5.3.4 THE PRESENTATION HALF OF A MOLECULE THAT HAS ALREADY CONVERTED
5.4 CHALLENGES
5.4.1 A MARKET THAT CANNOT BE SIZED FROM PUBLIC SOURCES, AND THE EVIDENCE FOR SAYING SO
5.4.2 TWENTY-SEVEN MOLECULES, THIRTY-SEVEN SUPPLIERS, AND NO TWO MARKETS ALIKE
5.4.3 BRAZIL AND CHILE ARE WHAT CAN BE OBSERVED, AND NEITHER SEES ITS WHOLE COUNTRY
5.4.4 WHETHER A PRODUCT IS ON SALE IN A COUNTRY CANNOT BE READ OFF THE EUROPEAN REGISTER
5.5 EMERGING TRENDS IN THE INDUSTRY
5.5.1 THE WAVE MOVING FROM INTRAVENOUS ONCOLOGY INTO SUBCUTANEOUS IMMUNOLOGY
5.5.2 CONSOLIDATION OF SUPPLY INTO A SMALL NUMBER OF INTEGRATED BIOLOGICS MANUFACTURERS
5.5.3 BUYERS PUBLISHING CONVERSION DATA AS AN INSTRUMENT OF POLICY
5.5.4 TENDER WINS BECOMING THE GROWTH LINE IN SUPPLIERS' OWN ACCOUNTS
5.5.5 THE REFERENCE PRODUCT MOVING TO A PRESENTATION NO BIOSIMILAR HAS YET COPIED
5.6 IMPACT ANALYSIS: DRIVERS, RESTRAINTS, OPPORTUNITIES, CHALLENGES
5.7 PORTER'S FIVE FORCES ANALYSIS
5.8 PESTEL ANALYSIS
5.9 SWOT ANALYSIS
6 PRICING ANALYSIS
6.1 PRICE BY TYPE: LIST, EX-FACTORY, REIMBURSED, TENDER, RETAIL
6.2 PRICE PER STANDARD UNIT BY COUNTRY
6.3 PRICE MOVEMENT, 2018-2025
6.4 PRICE OUTLOOK, 2026-2033
6.5 PRICE IN LOCAL CURRENCY AGAINST USD, WITH STATED RATE
6.6 CONSTANT-CURRENCY PRICE MOVEMENT: ARGENTINA, TURKEY, EGYPT
7 TENDER AND PUBLIC PROCUREMENT ANALYSIS
7.1 AWARDED TENDERS BY COUNTRY, BUYER AND WINNING COMPANY
7.2 AWARDED VOLUME AND PRICE BY MOLECULE
7.3 PUBLIC AGAINST PRIVATE CHANNEL MIX
7.4 TENDER PRICE AGAINST LIST PRICE BY COUNTRY
7.5 CHANNEL COVERAGE AND WHAT EACH SOURCE EXCLUDES
8 PRODUCT AND MOLECULE LANDSCAPE
8.1 PRODUCT UNIVERSE BY COUNTRY: BRAND, MOLECULE, STRENGTH, FORM
8.2 MARKETING AUTHORISATION HOLDER, MANUFACTURER, PARTNER, DISTRIBUTOR
8.3 APPROVAL AND LAUNCH DATE BY COUNTRY
8.4 MARKETED AGAINST REGISTERED-NOT-MARKETED
9 REGULATORY FRAMEWORK AND APPROVAL PATHWAYS
9.1 APPROVAL PATHWAY AND GOVERNING BODY BY COUNTRY
9.2 REGISTRATION REQUIREMENTS AND TYPICAL TIMELINES
9.3 PRICING AND REIMBURSEMENT CONTROL BY COUNTRY
10 BIOSIMILAR PENETRATION AGAINST THE ORIGINATOR
10.1 PENETRATION BY VALUE AND VOLUME, BY MOLECULE AND COUNTRY
10.2 ORIGINATOR AGAINST BIOSIMILAR PRICE AND DISCOUNT
10.3 DISCOUNT AT LAUNCH AGAINST CURRENT DISCOUNT
10.4 SHARE MOVEMENT SINCE BIOSIMILAR ENTRY
10.5 ROWS WITH NO BRAND IDENTIFIED, BY MOLECULE AND COUNTRY
11 COUNTRY-BY-MOLECULE MARKET MAP
11.1 COMPANIES AND BRANDS PRESENT PER CELL
12 BIOSIMILARS MARKET, BY MOLECULE, 2018–2033 (USD MILLION)
12.1 OVERVIEW
12.2 DENOSUMAB
12.3 AFLIBERCEPT
12.4 USTEKINUMAB
12.5 ADALIMUMAB
12.6 PEGFILGRASTIM
12.7 BEVACIZUMAB
12.8 RANIBIZUMAB
12.9 TRASTUZUMAB
12.1 FILGRASTIM
12.11 RITUXIMAB
12.12 TERIPARATIDE
12.13 ETANERCEPT
12.14 OCILIZUMAB
12.15 EPOETIN ALFA
12.16 INFLIXIMAB
12.17 INSULIN ASPART
12.18 INSULIN GLARGINE
12.19 ECULIZUMAB
12.2 EPOETIN ZETA
12.21 FOLLITROPIN ALFA
12.22 GOLIMUMAB
12.23 INSULIN LISPRO
12.24 ENOXAPARIN SODIUM
12.25 NATALIZUMAB
12.26 OMALIZUMAB
12.27 PERTUZUMAB
12.28 SOMATROPIN
13 BIOSIMILARS MARKET, BY THERAPEUTIC GROUP, 2018–2033 (USD MILLION)
13.1 OVERVIEW
13.2 IMMUNOLOGY AND INFLAMMATION
13.3 ONCOLOGY
13.4 OPHTHALMOLOGY
13.5 HAEMATOLOGY AND SUPPORTIVE CARE
13.6 BONE AND METABOLIC
13.7 DIABETES
13.8 ENDOCRINOLOGY AND FERTILITY
13.9 RESPIRATORY AND ALLERGY
14 BIOSIMILARS MARKET, BY MARKET STATUS, 2018–2033 (USD MILLION)
14.1 OVERVIEW
14.2 MARKETED
14.3 APPROVED NOT LAUNCHED
14.4 FILED
14.5 NOT PRESENT
14.6 NOT KNOWN
15 BIOSIMILARS MARKET, BY CHANNEL, 2018–2033 (USD MILLION)
15.1 OVERVIEW
15.2 PUBLIC TENDER
15.2.1 DENOSUMAB
15.2.2 AFLIBERCEPT
15.2.3 USTEKINUMAB
15.2.4 ADALIMUMAB
15.2.5 PEGFILGRASTIM
15.2.6 BEVACIZUMAB
15.2.7 RANIBIZUMAB
15.2.8 TRASTUZUMAB
15.2.9 FILGRASTIM
15.2.10 RITUXIMAB
15.2.11 TERIPARATIDE
15.2.12 ETANERCEPT
15.2.13 TOCILIZUMAB
15.2.14 EPOETIN ALFA
15.2.15 INFLIXIMAB
15.2.16 INSULIN ASPART
15.2.17 INSULIN GLARGINE
15.2.18 ECULIZUMAB
15.2.19 EPOETIN ZETA
15.2.20 FOLLITROPIN ALFA
15.2.21 GOLIMUMAB
15.2.22 INSULIN LISPRO
15.2.23 ENOXAPARIN SODIUM
15.2.24 NATALIZUMAB
15.2.25 OMALIZUMAB
15.2.26 PERTUZUMAB
15.2.27 SOMATROPIN
15.3 HOSPITAL
15.3.1 DENOSUMAB
15.3.2 AFLIBERCEPT
15.3.3 USTEKINUMAB
15.3.4 ADALIMUMAB
15.3.5 PEGFILGRASTIM
15.3.6 BEVACIZUMAB
15.3.7 RANIBIZUMAB
15.3.8 TRASTUZUMAB
15.3.9 FILGRASTIM
15.3.10 RITUXIMAB
15.3.11 TERIPARATIDE
15.3.12 ETANERCEPT
15.3.13 TOCILIZUMAB
15.3.14 EPOETIN ALFA
15.3.15 INFLIXIMAB
15.3.16 INSULIN ASPART
15.3.17 INSULIN GLARGINE
15.3.18 ECULIZUMAB
15.3.19 EPOETIN ZETA
15.3.20 FOLLITROPIN ALFA
15.3.21 GOLIMUMAB
15.3.22 INSULIN LISPRO
15.3.23 ENOXAPARIN SODIUM
15.3.24 NATALIZUMAB
15.3.25 OMALIZUMAB
15.3.26 PERTUZUMAB
15.3.27 SOMATROPIN
15.4 RETAIL PHARMACY
15.4.1 DENOSUMAB
15.4.2 AFLIBERCEPT
15.4.3 USTEKINUMAB
15.4.4 ADALIMUMAB
15.4.5 PEGFILGRASTIM
15.4.6 BEVACIZUMAB
15.4.7 RANIBIZUMAB
15.4.8 TRASTUZUMAB
15.4.9 FILGRASTIM
15.4.10 RITUXIMAB
15.4.11 TERIPARATIDE
15.4.12 ETANERCEPT
15.4.13 TOCILIZUMAB
15.4.14 EPOETIN ALFA
15.4.15 INFLIXIMAB
15.4.16 INSULIN ASPART
15.4.17 INSULIN GLARGINE
15.4.18 ECULIZUMAB
15.4.19 EPOETIN ZETA
15.4.20 FOLLITROPIN ALFA
15.4.21 GOLIMUMAB
15.4.22 INSULIN LISPRO
15.4.23 ENOXAPARIN SODIUM
15.4.24 NATALIZUMAB
15.4.25 OMALIZUMAB
15.4.26 PERTUZUMAB
15.4.27 SOMATROPIN
15.5 PRIVATE MARKET
15.5.1 DENOSUMAB
15.5.2 AFLIBERCEPT
15.5.3 USTEKINUMAB
15.5.4 ADALIMUMAB
15.5.5 PEGFILGRASTIM
15.5.6 BEVACIZUMAB
15.5.7 RANIBIZUMAB
15.5.8 TRASTUZUMAB
15.5.9 FILGRASTIM
15.5.10 RITUXIMAB
15.5.11 TERIPARATIDE
15.5.12 ETANERCEPT
15.5.13 TOCILIZUMAB
15.5.14 EPOETIN ALFA
15.5.15 INFLIXIMAB
15.5.16 INSULIN ASPART
15.5.17 INSULIN GLARGINE
15.5.18 ECULIZUMAB
15.5.19 EPOETIN ZETA
15.5.20 FOLLITROPIN ALFA
15.5.21 GOLIMUMAB
15.5.22 INSULIN LISPRO
15.5.23 ENOXAPARIN SODIUM
15.5.24 NATALIZUMAB
15.5.25 OMALIZUMAB
15.5.26 PERTUZUMAB
15.5.27 SOMATROPIN
16 BIOSIMILARS MARKET, BY GEOGRAPHY, 2018–2033 (USD MILLION)
16.1 OVERVIEW
16.2 GLOBAL
16.2.1 EU-5
16.2.1.1 GERMANY
16.2.1.2 FRANCE
16.2.1.3 ITALY
16.2.1.4 SPAIN
16.2.1.5 UNITED KINGDOM
16.2.2 LATIN AMERICA
16.2.2.1 BRAZIL
16.2.2.2 MEXICO
16.2.2.3 ARGENTINA
16.2.2.4 COLOMBIA
16.2.2.5 CHILE
16.2.3 CHINA
16.2.3.1 CHINA
16.2.4 SOUTHEAST ASIA
16.2.4.1 INDONESIA
16.2.4.2 THAILAND
16.2.4.3 VIETNAM
16.2.4.4 PHILIPPINES
16.2.4.5 MALAYSIA
16.2.4.6 SINGAPORE
16.2.5 MENA
16.2.5.1 SAUDI ARABIA
16.2.5.2 UNITED ARAB EMIRATES
16.2.5.3 EGYPT
16.2.5.4 TURKEY
17 COMPETITIVE LANDSCAPE
17.1 COMPANY SHARE BY VALUE AND VOLUME, 2025
17.2 COMPANY RANKING BY COUNTRY AND REGION
17.3 NUMBER OF MARKETED PRODUCTS PER COMPANY
17.4 SALES GROWTH BY COMPANY
18 COMPANY PROFILES
18.1 COMPANIES NAMED AS MANDATORY
18.1.1 SANDOZ
18.1.1.1 COMPANY OVERVIEW
18.1.1.2 REVENUE ANALYSIS
18.1.1.3 GEOGRAPHIC PRESENCE
18.1.1.4 M&A
18.1.1.5 PRODUCTION CAPACITY EXPANSION
18.1.1.6 PRODUCT LAUNCHES
18.1.1.7 OTHERS
18.1.1.8 PRODUCT PORTFOLIO
18.1.1.9 RECENT DEVELOPMENTS
18.1.2 CELLTRION
18.1.2.1 COMPANY OVERVIEW
18.1.2.2 REVENUE ANALYSIS
18.1.2.3 GEOGRAPHIC PRESENCE
18.1.2.4 PRODUCT LAUNCHES
18.1.2.5 OTHERS
18.1.2.6 PRODUCT PORTFOLIO
18.1.2.7 RECENT DEVELOPMENTS
18.1.3 BIOCON BIOLOGICS
18.1.3.1 COMPANY OVERVIEW
18.1.3.2 REVENUE ANALYSIS
18.1.3.3 GEOGRAPHIC PRESENCE
18.1.3.4 M&A
18.1.3.5 OTHERS
18.1.3.6 PRODUCT PORTFOLIO
18.1.3.7 RECENT DEVELOPMENTS
18.1.4 AMGEN
18.1.4.1 COMPANY OVERVIEW
18.1.4.2 REVENUE ANALYSIS
18.1.4.3 GEOGRAPHIC PRESENCE
18.1.4.4 OTHERS
18.1.4.5 PRODUCT PORTFOLIO
18.1.4.6 RECENT DEVELOPMENTS
18.1.5 TEVA
18.1.5.1 COMPANY OVERVIEW
18.1.5.2 REVENUE ANALYSIS
18.1.5.3 GEOGRAPHIC PRESENCE
18.1.5.4 PRODUCT LAUNCHES
18.1.5.5 OTHERS
18.1.5.6 PRODUCT PORTFOLIO
18.1.5.7 RECENT DEVELOPMENTS
18.1.6 ORGANON
18.1.6.1 COMPANY OVERVIEW
18.1.6.2 REVENUE ANALYSIS
18.1.6.3 GEOGRAPHIC PRESENCE
18.1.6.4 PRODUCT LAUNCHES
18.1.6.5 OTHERS
18.1.6.6 PRODUCT PORTFOLIO
18.1.6.7 RECENT DEVELOPMENTS
18.2 OTHER COMPANIES COVERED
18.2.1 SAMSUNG BIOEPIS
18.2.1.1 COMPANY OVERVIEW
18.2.1.2 REVENUE ANALYSIS
18.2.1.3 GEOGRAPHIC PRESENCE
18.2.1.4 COLLABORATION
18.2.1.5 OTHERS
18.2.1.6 PRODUCT PORTFOLIO
18.2.1.7 RECENT DEVELOPMENTS
18.2.2 FRESENIUS KABI
18.2.2.1 COMPANY OVERVIEW
18.2.2.2 REVENUE ANALYSIS
18.2.2.3 GEOGRAPHIC PRESENCE
18.2.2.4 COLLABORATION
18.2.2.5 PRODUCT LAUNCHES
18.2.2.6 OTHERS
18.2.2.7 PRODUCT PORTFOLIO
18.2.2.8 RECENT DEVELOPMENTS
18.2.3 STADA
18.2.3.1 COMPANY OVERVIEW
18.2.3.2 REVENUE ANALYSIS
18.2.3.3 GEOGRAPHIC PRESENCE
18.2.3.4 COLLABORATION
18.2.3.5 OTHERS
18.2.3.6 PRODUCT PORTFOLIO
18.2.3.7 RECENT DEVELOPMENTS
18.2.4 ACCORD HEALTHCARE
18.2.4.1 COMPANY OVERVIEW
18.2.4.2 REVENUE ANALYSIS
18.2.4.3 GEOGRAPHIC PRESENCE
18.2.4.4 PRODUCT ACQUISITION
18.2.4.5 OTHERS
18.2.4.6 PRODUCT PORTFOLIO
18.2.4.7 RECENT DEVELOPMENTS
18.2.5 VIATRIS
18.2.5.1 COMPANY OVERVIEW
18.2.5.2 REVENUE ANALYSIS
18.2.5.3 GEOGRAPHIC PRESENCE
18.2.5.4 M&A
18.2.5.5 OTHERS
18.2.5.6 PRODUCT PORTFOLIO
18.2.5.7 RECENT DEVELOPMENTS
18.2.6 PFIZER
18.2.6.1 COMPANY OVERVIEW
18.2.6.2 REVENUE ANALYSIS
18.2.6.3 GEOGRAPHIC PRESENCE
18.2.6.4 OTHERS
18.2.6.5 PRODUCT PORTFOLIO
18.2.6.6 RECENT DEVELOPMENTS
18.2.7 COHERUS
18.2.7.1 COMPANY OVERVIEW
18.2.7.2 GEOGRAPHIC PRESENCE
18.2.7.3 MAJOR DEALS
18.2.7.4 M&A
18.2.7.5 OTHERS
18.2.7.6 PRODUCT PORTFOLIO
18.2.7.7 RECENT DEVELOPMENTS
18.2.8 GAN & LEE
18.2.8.1 COMPANY OVERVIEW
18.2.8.2 REVENUE ANALYSIS
18.2.8.3 GEOGRAPHIC PRESENCE
18.2.8.4 PRODUCTION CAPACITY EXPANSION
18.2.8.5 OTHERS
18.2.8.6 PRODUCT PORTFOLIO
18.2.8.7 RECENT DEVELOPMENTS
19 COMMERCIAL PRESENCE AND ROUTE TO MARKET
19.1 DIRECT AGAINST PARTNER-LED MODEL BY COUNTRY
19.2 NAMED DISTRIBUTORS AND MARKETS HANDLED
19.3 FIELD FORCE SIZE, WHERE OBTAINABLE
20 COUNTRY DEEP-DIVES
21 DELIVERABLES, SOURCES AND LIMITATIONS
21.1 ACCOMPANYING DATABASES AND THEIR CONTENTS
21.2 SOURCES BY CLASS, WITH COVERAGE AND DATE ACCESSED
21.3 WHAT COULD NOT BE OBTAINED, AND WHY
List of Table
TABLE 1 IMPACT OF EACH FORCE, BY SEGMENT
TABLE 2 PESTEL ANALYSIS
TABLE 3 SWOT: STRENGTHS AND WEAKNESSES
TABLE 4 SWOT: OPPORTUNITIES AND THREATS
TABLE 5 PRICE BY TYPE: LIST, EX-FACTORY, REIMBURSED, TENDER, RETAIL
TABLE 6 PRICE PER STANDARD UNIT BY COUNTRY
TABLE 7 OBSERVED MONTHLY PURCHASING RECORD, AS PUBLISHED
TABLE 8 PRICE IN LOCAL CURRENCY AGAINST USD, WITH STATED RATE
TABLE 9 APPROVAL AND LAUNCH DATE BY COUNTRY
TABLE 10 MARKETED AGAINST REGISTERED-NOT-MARKETED
TABLE 11 APPROVAL PATHWAY AND GOVERNING BODY, BY COUNTRY
TABLE 12 WHO DECIDES WHAT A BIOSIMILAR IS PAID, AND HOW
TABLE 13 PENETRATION BY VALUE AND VOLUME, BY MOLECULE AND COUNTRY
TABLE 14 ORIGINATOR AGAINST BIOSIMILAR PRICE AND DISCOUNT
TABLE 15 DISCOUNT AT FIRST AND LATEST OBSERVATION, BY MOLECULE
TABLE 16 BIOSIMILAR SHARE OF PACKS, FIRST AND LATEST OBSERVATION
TABLE 17 AWARDED LINES WITH NO BRAND RESOLVED
TABLE 18 COMPANIES AND BRANDS PRESENT PER CELL
TABLE 19 BIOSIMILARS MARKET, BY MOLECULE, 2018-2025 (USD MILLION)
TABLE 20 BIOSIMILARS MARKET, BY MOLECULE, 2026-2033 (USD MILLION)
TABLE 21 BIOSIMILARS MARKET, BY THERAPEUTIC GROUP, 2018-2025 (USD MILLION)
TABLE 22 BIOSIMILARS MARKET, BY THERAPEUTIC GROUP, 2026-2033 (USD MILLION)
TABLE 23 BIOSIMILARS MARKET, BY MARKET STATUS, 2018-2025 (USD MILLION)
TABLE 24 BIOSIMILARS MARKET, BY MARKET STATUS, 2026-2033 (USD MILLION)
TABLE 25 BIOSIMILARS MARKET, BY CHANNEL, 2018-2025 (USD MILLION)
TABLE 26 BIOSIMILARS MARKET, BY CHANNEL, 2026-2033 (USD MILLION)
TABLE 27 PUBLIC TENDER, BY TYPE, 2018-2025 (USD MILLION)
TABLE 28 PUBLIC TENDER, BY TYPE, 2026-2033 (USD MILLION)
TABLE 29 HOSPITAL, BY TYPE, 2018-2025 (USD MILLION)
TABLE 30 HOSPITAL, BY TYPE, 2026-2033 (USD MILLION)
TABLE 31 RETAIL PHARMACY, BY TYPE, 2018-2025 (USD MILLION)
TABLE 32 RETAIL PHARMACY, BY TYPE, 2026-2033 (USD MILLION)
TABLE 33 PRIVATE MARKET, BY TYPE, 2018-2025 (USD MILLION)
TABLE 34 PRIVATE MARKET, BY TYPE, 2026-2033 (USD MILLION)
TABLE 35 BIOSIMILARS MARKET, BY GEOGRAPHY, 2018-2025 (USD MILLION)
TABLE 36 BIOSIMILARS MARKET, BY GEOGRAPHY, 2026-2033 (USD MILLION)
TABLE 37 EU-5, BY COUNTRY, 2018-2025 (USD MILLION)
TABLE 38 EU-5, BY COUNTRY, 2026-2033 (USD MILLION)
TABLE 39 EU-5, BY MOLECULE, 2018-2025 (USD MILLION)
TABLE 40 EU-5, BY MOLECULE, 2026-2033 (USD MILLION)
TABLE 41 EU-5, BY THERAPEUTIC GROUP, 2018-2025 (USD MILLION)
TABLE 42 EU-5, BY THERAPEUTIC GROUP, 2026-2033 (USD MILLION)
TABLE 43 EU-5, BY MARKET STATUS, 2018-2025 (USD MILLION)
TABLE 44 EU-5, BY MARKET STATUS, 2026-2033 (USD MILLION)
TABLE 45 EU-5, BY CHANNEL, 2018-2025 (USD MILLION)
TABLE 46 EU-5, BY CHANNEL, 2026-2033 (USD MILLION)
TABLE 47 GERMANY, BY MOLECULE, 2018-2025 (USD MILLION)
TABLE 48 GERMANY, BY MOLECULE, 2026-2033 (USD MILLION)
TABLE 49 GERMANY, BY THERAPEUTIC GROUP, 2018-2025 (USD MILLION)
TABLE 50 GERMANY, BY THERAPEUTIC GROUP, 2026-2033 (USD MILLION)
TABLE 51 GERMANY, BY MARKET STATUS, 2018-2025 (USD MILLION)
TABLE 52 GERMANY, BY MARKET STATUS, 2026-2033 (USD MILLION)
TABLE 53 GERMANY, BY CHANNEL, 2018-2025 (USD MILLION)
TABLE 54 GERMANY, BY CHANNEL, 2026-2033 (USD MILLION)
TABLE 55 FRANCE, BY MOLECULE, 2018-2025 (USD MILLION)
TABLE 56 FRANCE, BY MOLECULE, 2026-2033 (USD MILLION)
TABLE 57 FRANCE, BY THERAPEUTIC GROUP, 2018-2025 (USD MILLION)
TABLE 58 FRANCE, BY THERAPEUTIC GROUP, 2026-2033 (USD MILLION)
TABLE 59 FRANCE, BY MARKET STATUS, 2018-2025 (USD MILLION)
TABLE 60 FRANCE, BY MARKET STATUS, 2026-2033 (USD MILLION)
TABLE 61 FRANCE, BY CHANNEL, 2018-2025 (USD MILLION)
TABLE 62 FRANCE, BY CHANNEL, 2026-2033 (USD MILLION)
TABLE 63 ITALY, BY MOLECULE, 2018-2025 (USD MILLION)
TABLE 64 ITALY, BY MOLECULE, 2026-2033 (USD MILLION)
TABLE 65 ITALY, BY THERAPEUTIC GROUP, 2018-2025 (USD MILLION)
TABLE 66 ITALY, BY THERAPEUTIC GROUP, 2026-2033 (USD MILLION)
TABLE 67 ITALY, BY MARKET STATUS, 2018-2025 (USD MILLION)
TABLE 68 ITALY, BY MARKET STATUS, 2026-2033 (USD MILLION)
TABLE 69 ITALY, BY CHANNEL, 2018-2025 (USD MILLION)
TABLE 70 ITALY, BY CHANNEL, 2026-2033 (USD MILLION)
TABLE 71 SPAIN, BY MOLECULE, 2018-2025 (USD MILLION)
TABLE 72 SPAIN, BY MOLECULE, 2026-2033 (USD MILLION)
TABLE 73 SPAIN, BY THERAPEUTIC GROUP, 2018-2025 (USD MILLION)
TABLE 74 SPAIN, BY THERAPEUTIC GROUP, 2026-2033 (USD MILLION)
TABLE 75 SPAIN, BY MARKET STATUS, 2018-2025 (USD MILLION)
TABLE 76 SPAIN, BY MARKET STATUS, 2026-2033 (USD MILLION)
TABLE 77 SPAIN, BY CHANNEL, 2018-2025 (USD MILLION)
TABLE 78 SPAIN, BY CHANNEL, 2026-2033 (USD MILLION)
TABLE 79 UNITED KINGDOM, BY MOLECULE, 2018-2025 (USD MILLION)
TABLE 80 UNITED KINGDOM, BY MOLECULE, 2026-2033 (USD MILLION)
TABLE 81 UNITED KINGDOM, BY THERAPEUTIC GROUP, 2018-2025 (USD MILLION)
TABLE 82 UNITED KINGDOM, BY THERAPEUTIC GROUP, 2026-2033 (USD MILLION)
TABLE 83 UNITED KINGDOM, BY MARKET STATUS, 2018-2025 (USD MILLION)
TABLE 84 UNITED KINGDOM, BY MARKET STATUS, 2026-2033 (USD MILLION)
TABLE 85 UNITED KINGDOM, BY CHANNEL, 2018-2025 (USD MILLION)
TABLE 86 UNITED KINGDOM, BY CHANNEL, 2026-2033 (USD MILLION)
TABLE 87 LATIN AMERICA, BY COUNTRY, 2018-2025 (USD MILLION)
TABLE 88 LATIN AMERICA, BY COUNTRY, 2026-2033 (USD MILLION)
TABLE 89 LATIN AMERICA, BY MOLECULE, 2018-2025 (USD MILLION)
TABLE 90 LATIN AMERICA, BY MOLECULE, 2026-2033 (USD MILLION)
TABLE 91 LATIN AMERICA, BY THERAPEUTIC GROUP, 2018-2025 (USD MILLION)
TABLE 92 LATIN AMERICA, BY THERAPEUTIC GROUP, 2026-2033 (USD MILLION)
TABLE 93 LATIN AMERICA, BY MARKET STATUS, 2018-2025 (USD MILLION)
TABLE 94 LATIN AMERICA, BY MARKET STATUS, 2026-2033 (USD MILLION)
TABLE 95 LATIN AMERICA, BY CHANNEL, 2018-2025 (USD MILLION)
TABLE 96 LATIN AMERICA, BY CHANNEL, 2026-2033 (USD MILLION)
TABLE 97 BRAZIL, BY MOLECULE, 2018-2025 (USD MILLION)
TABLE 98 BRAZIL, BY MOLECULE, 2026-2033 (USD MILLION)
TABLE 99 BRAZIL, BY THERAPEUTIC GROUP, 2018-2025 (USD MILLION)
TABLE 100 BRAZIL, BY THERAPEUTIC GROUP, 2026-2033 (USD MILLION)
TABLE 101 BRAZIL, BY MARKET STATUS, 2018-2025 (USD MILLION)
TABLE 102 BRAZIL, BY MARKET STATUS, 2026-2033 (USD MILLION)
TABLE 103 BRAZIL, BY CHANNEL, 2018-2025 (USD MILLION)
TABLE 104 BRAZIL, BY CHANNEL, 2026-2033 (USD MILLION)
TABLE 105 MEXICO, BY MOLECULE, 2018-2025 (USD MILLION)
TABLE 106 MEXICO, BY MOLECULE, 2026-2033 (USD MILLION)
TABLE 107 MEXICO, BY THERAPEUTIC GROUP, 2018-2025 (USD MILLION)
TABLE 108 MEXICO, BY THERAPEUTIC GROUP, 2026-2033 (USD MILLION)
TABLE 109 MEXICO, BY MARKET STATUS, 2018-2025 (USD MILLION)
TABLE 110 MEXICO, BY MARKET STATUS, 2026-2033 (USD MILLION)
TABLE 111 MEXICO, BY CHANNEL, 2018-2025 (USD MILLION)
TABLE 112 MEXICO, BY CHANNEL, 2026-2033 (USD MILLION)
TABLE 113 ARGENTINA, BY MOLECULE, 2018-2025 (USD MILLION)
TABLE 114 ARGENTINA, BY MOLECULE, 2026-2033 (USD MILLION)
TABLE 115 ARGENTINA, BY THERAPEUTIC GROUP, 2018-2025 (USD MILLION)
TABLE 116 ARGENTINA, BY THERAPEUTIC GROUP, 2026-2033 (USD MILLION)
TABLE 117 ARGENTINA, BY MARKET STATUS, 2018-2025 (USD MILLION)
TABLE 118 ARGENTINA, BY MARKET STATUS, 2026-2033 (USD MILLION)
TABLE 119 ARGENTINA, BY CHANNEL, 2018-2025 (USD MILLION)
TABLE 120 ARGENTINA, BY CHANNEL, 2026-2033 (USD MILLION)
TABLE 121 COLOMBIA, BY MOLECULE, 2018-2025 (USD MILLION)
TABLE 122 COLOMBIA, BY MOLECULE, 2026-2033 (USD MILLION)
TABLE 123 COLOMBIA, BY THERAPEUTIC GROUP, 2018-2025 (USD MILLION)
TABLE 124 COLOMBIA, BY THERAPEUTIC GROUP, 2026-2033 (USD MILLION)
TABLE 125 COLOMBIA, BY MARKET STATUS, 2018-2025 (USD MILLION)
TABLE 126 COLOMBIA, BY MARKET STATUS, 2026-2033 (USD MILLION)
TABLE 127 COLOMBIA, BY CHANNEL, 2018-2025 (USD MILLION)
TABLE 128 COLOMBIA, BY CHANNEL, 2026-2033 (USD MILLION)
TABLE 129 CHILE, BY MOLECULE, 2018-2025 (USD MILLION)
TABLE 130 CHILE, BY MOLECULE, 2026-2033 (USD MILLION)
TABLE 131 CHILE, BY THERAPEUTIC GROUP, 2018-2025 (USD MILLION)
TABLE 132 CHILE, BY THERAPEUTIC GROUP, 2026-2033 (USD MILLION)
TABLE 133 CHILE, BY MARKET STATUS, 2018-2025 (USD MILLION)
TABLE 134 CHILE, BY MARKET STATUS, 2026-2033 (USD MILLION)
TABLE 135 CHILE, BY CHANNEL, 2018-2025 (USD MILLION)
TABLE 136 CHILE, BY CHANNEL, 2026-2033 (USD MILLION)
TABLE 137 CHINA, BY COUNTRY, 2018-2025 (USD MILLION)
TABLE 138 CHINA, BY COUNTRY, 2026-2033 (USD MILLION)
TABLE 139 CHINA, BY MOLECULE, 2018-2025 (USD MILLION)
TABLE 140 CHINA, BY MOLECULE, 2026-2033 (USD MILLION)
TABLE 141 CHINA, BY THERAPEUTIC GROUP, 2018-2025 (USD MILLION)
TABLE 142 CHINA, BY THERAPEUTIC GROUP, 2026-2033 (USD MILLION)
TABLE 143 CHINA, BY MARKET STATUS, 2018-2025 (USD MILLION)
TABLE 144 CHINA, BY MARKET STATUS, 2026-2033 (USD MILLION)
TABLE 145 CHINA, BY CHANNEL, 2018-2025 (USD MILLION)
TABLE 146 CHINA, BY CHANNEL, 2026-2033 (USD MILLION)
TABLE 147 CHINA, BY MOLECULE, 2018-2025 (USD MILLION)
TABLE 148 CHINA, BY MOLECULE, 2026-2033 (USD MILLION)
TABLE 149 CHINA, BY THERAPEUTIC GROUP, 2018-2025 (USD MILLION)
TABLE 150 CHINA, BY THERAPEUTIC GROUP, 2026-2033 (USD MILLION)
TABLE 151 CHINA, BY MARKET STATUS, 2018-2025 (USD MILLION)
TABLE 152 CHINA, BY MARKET STATUS, 2026-2033 (USD MILLION)
TABLE 153 CHINA, BY CHANNEL, 2018-2025 (USD MILLION)
TABLE 154 CHINA, BY CHANNEL, 2026-2033 (USD MILLION)
TABLE 155 SOUTHEAST ASIA, BY COUNTRY, 2018-2025 (USD MILLION)
TABLE 156 SOUTHEAST ASIA, BY COUNTRY, 2026-2033 (USD MILLION)
TABLE 157 SOUTHEAST ASIA, BY MOLECULE, 2018-2025 (USD MILLION)
TABLE 158 SOUTHEAST ASIA, BY MOLECULE, 2026-2033 (USD MILLION)
TABLE 159 SOUTHEAST ASIA, BY THERAPEUTIC GROUP, 2018-2025 (USD MILLION)
TABLE 160 SOUTHEAST ASIA, BY THERAPEUTIC GROUP, 2026-2033 (USD MILLION)
TABLE 161 SOUTHEAST ASIA, BY MARKET STATUS, 2018-2025 (USD MILLION)
TABLE 162 SOUTHEAST ASIA, BY MARKET STATUS, 2026-2033 (USD MILLION)
TABLE 163 SOUTHEAST ASIA, BY CHANNEL, 2018-2025 (USD MILLION)
TABLE 164 SOUTHEAST ASIA, BY CHANNEL, 2026-2033 (USD MILLION)
TABLE 165 INDONESIA, BY MOLECULE, 2018-2025 (USD MILLION)
TABLE 166 INDONESIA, BY MOLECULE, 2026-2033 (USD MILLION)
TABLE 167 INDONESIA, BY THERAPEUTIC GROUP, 2018-2025 (USD MILLION)
TABLE 168 INDONESIA, BY THERAPEUTIC GROUP, 2026-2033 (USD MILLION)
TABLE 169 INDONESIA, BY MARKET STATUS, 2018-2025 (USD MILLION)
TABLE 170 INDONESIA, BY MARKET STATUS, 2026-2033 (USD MILLION)
TABLE 171 INDONESIA, BY CHANNEL, 2018-2025 (USD MILLION)
TABLE 172 INDONESIA, BY CHANNEL, 2026-2033 (USD MILLION)
TABLE 173 THAILAND, BY MOLECULE, 2018-2025 (USD MILLION)
TABLE 174 THAILAND, BY MOLECULE, 2026-2033 (USD MILLION)
TABLE 175 THAILAND, BY THERAPEUTIC GROUP, 2018-2025 (USD MILLION)
TABLE 176 THAILAND, BY THERAPEUTIC GROUP, 2026-2033 (USD MILLION)
TABLE 177 THAILAND, BY MARKET STATUS, 2018-2025 (USD MILLION)
TABLE 178 THAILAND, BY MARKET STATUS, 2026-2033 (USD MILLION)
TABLE 179 THAILAND, BY CHANNEL, 2018-2025 (USD MILLION)
TABLE 180 THAILAND, BY CHANNEL, 2026-2033 (USD MILLION)
TABLE 181 VIETNAM, BY MOLECULE, 2018-2025 (USD MILLION)
TABLE 182 VIETNAM, BY MOLECULE, 2026-2033 (USD MILLION)
TABLE 183 VIETNAM, BY THERAPEUTIC GROUP, 2018-2025 (USD MILLION)
TABLE 184 VIETNAM, BY THERAPEUTIC GROUP, 2026-2033 (USD MILLION)
TABLE 185 VIETNAM, BY MARKET STATUS, 2018-2025 (USD MILLION)
TABLE 186 VIETNAM, BY MARKET STATUS, 2026-2033 (USD MILLION)
TABLE 187 VIETNAM, BY CHANNEL, 2018-2025 (USD MILLION)
TABLE 188 VIETNAM, BY CHANNEL, 2026-2033 (USD MILLION)
TABLE 189 PHILIPPINES, BY MOLECULE, 2018-2025 (USD MILLION)
TABLE 190 PHILIPPINES, BY MOLECULE, 2026-2033 (USD MILLION)
TABLE 191 PHILIPPINES, BY THERAPEUTIC GROUP, 2018-2025 (USD MILLION)
TABLE 192 PHILIPPINES, BY THERAPEUTIC GROUP, 2026-2033 (USD MILLION)
TABLE 193 PHILIPPINES, BY MARKET STATUS, 2018-2025 (USD MILLION)
TABLE 194 PHILIPPINES, BY MARKET STATUS, 2026-2033 (USD MILLION)
TABLE 195 PHILIPPINES, BY CHANNEL, 2018-2025 (USD MILLION)
TABLE 196 PHILIPPINES, BY CHANNEL, 2026-2033 (USD MILLION)
TABLE 197 MALAYSIA, BY MOLECULE, 2018-2025 (USD MILLION)
TABLE 198 MALAYSIA, BY MOLECULE, 2026-2033 (USD MILLION)
TABLE 199 MALAYSIA, BY THERAPEUTIC GROUP, 2018-2025 (USD MILLION)
TABLE 200 MALAYSIA, BY THERAPEUTIC GROUP, 2026-2033 (USD MILLION)
TABLE 201 MALAYSIA, BY MARKET STATUS, 2018-2025 (USD MILLION)
TABLE 202 MALAYSIA, BY MARKET STATUS, 2026-2033 (USD MILLION)
TABLE 203 MALAYSIA, BY CHANNEL, 2018-2025 (USD MILLION)
TABLE 204 MALAYSIA, BY CHANNEL, 2026-2033 (USD MILLION)
TABLE 205 SINGAPORE, BY MOLECULE, 2018-2025 (USD MILLION)
TABLE 206 SINGAPORE, BY MOLECULE, 2026-2033 (USD MILLION)
TABLE 207 SINGAPORE, BY THERAPEUTIC GROUP, 2018-2025 (USD MILLION)
TABLE 208 SINGAPORE, BY THERAPEUTIC GROUP, 2026-2033 (USD MILLION)
TABLE 209 SINGAPORE, BY MARKET STATUS, 2018-2025 (USD MILLION)
TABLE 210 SINGAPORE, BY MARKET STATUS, 2026-2033 (USD MILLION)
TABLE 211 SINGAPORE, BY CHANNEL, 2018-2025 (USD MILLION)
TABLE 212 SINGAPORE, BY CHANNEL, 2026-2033 (USD MILLION)
TABLE 213 MENA, BY COUNTRY, 2018-2025 (USD MILLION)
TABLE 214 MENA, BY COUNTRY, 2026-2033 (USD MILLION)
TABLE 215 MENA, BY MOLECULE, 2018-2025 (USD MILLION)
TABLE 216 MENA, BY MOLECULE, 2026-2033 (USD MILLION)
TABLE 217 MENA, BY THERAPEUTIC GROUP, 2018-2025 (USD MILLION)
TABLE 218 MENA, BY THERAPEUTIC GROUP, 2026-2033 (USD MILLION)
TABLE 219 MENA, BY MARKET STATUS, 2018-2025 (USD MILLION)
TABLE 220 MENA, BY MARKET STATUS, 2026-2033 (USD MILLION)
TABLE 221 MENA, BY CHANNEL, 2018-2025 (USD MILLION)
TABLE 222 MENA, BY CHANNEL, 2026-2033 (USD MILLION)
TABLE 223 SAUDI ARABIA, BY MOLECULE, 2018-2025 (USD MILLION)
TABLE 224 SAUDI ARABIA, BY MOLECULE, 2026-2033 (USD MILLION)
TABLE 225 SAUDI ARABIA, BY THERAPEUTIC GROUP, 2018-2025 (USD MILLION)
TABLE 226 SAUDI ARABIA, BY THERAPEUTIC GROUP, 2026-2033 (USD MILLION)
TABLE 227 SAUDI ARABIA, BY MARKET STATUS, 2018-2025 (USD MILLION)
TABLE 228 SAUDI ARABIA, BY MARKET STATUS, 2026-2033 (USD MILLION)
TABLE 229 SAUDI ARABIA, BY CHANNEL, 2018-2025 (USD MILLION)
TABLE 230 SAUDI ARABIA, BY CHANNEL, 2026-2033 (USD MILLION)
TABLE 231 UNITED ARAB EMIRATES, BY MOLECULE, 2018-2025 (USD MILLION)
TABLE 232 UNITED ARAB EMIRATES, BY MOLECULE, 2026-2033 (USD MILLION)
TABLE 233 UNITED ARAB EMIRATES, BY THERAPEUTIC GROUP, 2018-2025 (USD MILLION)
TABLE 234 UNITED ARAB EMIRATES, BY THERAPEUTIC GROUP, 2026-2033 (USD MILLION)
TABLE 235 UNITED ARAB EMIRATES, BY MARKET STATUS, 2018-2025 (USD MILLION)
TABLE 236 UNITED ARAB EMIRATES, BY MARKET STATUS, 2026-2033 (USD MILLION)
TABLE 237 UNITED ARAB EMIRATES, BY CHANNEL, 2018-2025 (USD MILLION)
TABLE 238 UNITED ARAB EMIRATES, BY CHANNEL, 2026-2033 (USD MILLION)
TABLE 239 EGYPT, BY MOLECULE, 2018-2025 (USD MILLION)
TABLE 240 EGYPT, BY MOLECULE, 2026-2033 (USD MILLION)
TABLE 241 EGYPT, BY THERAPEUTIC GROUP, 2018-2025 (USD MILLION)
TABLE 242 EGYPT, BY THERAPEUTIC GROUP, 2026-2033 (USD MILLION)
TABLE 243 EGYPT, BY MARKET STATUS, 2018-2025 (USD MILLION)
TABLE 244 EGYPT, BY MARKET STATUS, 2026-2033 (USD MILLION)
TABLE 245 EGYPT, BY CHANNEL, 2018-2025 (USD MILLION)
TABLE 246 EGYPT, BY CHANNEL, 2026-2033 (USD MILLION)
TABLE 247 TURKEY, BY MOLECULE, 2018-2025 (USD MILLION)
TABLE 248 TURKEY, BY MOLECULE, 2026-2033 (USD MILLION)
TABLE 249 TURKEY, BY THERAPEUTIC GROUP, 2018-2025 (USD MILLION)
TABLE 250 TURKEY, BY THERAPEUTIC GROUP, 2026-2033 (USD MILLION)
TABLE 251 TURKEY, BY MARKET STATUS, 2018-2025 (USD MILLION)
TABLE 252 TURKEY, BY MARKET STATUS, 2026-2033 (USD MILLION)
TABLE 253 TURKEY, BY CHANNEL, 2018-2025 (USD MILLION)
TABLE 254 TURKEY, BY CHANNEL, 2026-2033 (USD MILLION)
TABLE 255 COMPANY SHARE BY VALUE AND VOLUME, 2025
TABLE 256 EU-5: COMPANY SHARE BY VOLUME, 2025
TABLE 257 LATIN AMERICA: COMPANY SHARE BY VOLUME, 2025
TABLE 258 SOUTHEAST ASIA: COMPANY SHARE BY VOLUME, 2025
TABLE 259 MENA: COMPANY SHARE BY VOLUME, 2025
TABLE 260 CHINA: COMPANY SHARE BY VOLUME, 2025
TABLE 261 EU-5: COMPANY SHARE BY VALUE, 2025
TABLE 262 LATIN AMERICA: COMPANY SHARE BY VALUE, 2025
TABLE 263 SOUTHEAST ASIA: COMPANY SHARE BY VALUE, 2025
TABLE 264 MENA: COMPANY SHARE BY VALUE, 2025
TABLE 265 CHINA: COMPANY SHARE BY VALUE, 2025
TABLE 266 NUMBER OF MARKETED PRODUCTS PER COMPANY
TABLE 267 SALES GROWTH BY COMPANY
TABLE 268 SANDOZ: PRODUCT PORTFOLIO
TABLE 269 SANDOZ: RECENT DEVELOPMENTS
TABLE 270 CELLTRION: PRODUCT PORTFOLIO
TABLE 271 CELLTRION: RECENT DEVELOPMENTS
TABLE 272 BIOCON BIOLOGICS: PRODUCT PORTFOLIO
TABLE 273 BIOCON BIOLOGICS: RECENT DEVELOPMENTS
TABLE 274 AMGEN: PRODUCT PORTFOLIO
TABLE 275 AMGEN: RECENT DEVELOPMENTS
TABLE 276 TEVA: PRODUCT PORTFOLIO
TABLE 277 TEVA: RECENT DEVELOPMENTS
TABLE 278 ORGANON: PRODUCT PORTFOLIO
TABLE 279 ORGANON: RECENT DEVELOPMENTS
TABLE 280 SAMSUNG BIOEPIS: PRODUCT PORTFOLIO
TABLE 281 SAMSUNG BIOEPIS: RECENT DEVELOPMENTS
TABLE 282 FRESENIUS KABI: PRODUCT PORTFOLIO
TABLE 283 FRESENIUS KABI: RECENT DEVELOPMENTS
TABLE 284 STADA: PRODUCT PORTFOLIO
TABLE 285 STADA: RECENT DEVELOPMENTS
TABLE 286 ACCORD HEALTHCARE: PRODUCT PORTFOLIO
TABLE 287 ACCORD HEALTHCARE: RECENT DEVELOPMENTS
TABLE 288 VIATRIS: PRODUCT PORTFOLIO
TABLE 289 VIATRIS: RECENT DEVELOPMENTS
TABLE 290 PFIZER: PRODUCT PORTFOLIO
TABLE 291 PFIZER: RECENT DEVELOPMENTS
TABLE 292 COHERUS: PRODUCT PORTFOLIO
TABLE 293 COHERUS: RECENT DEVELOPMENTS
TABLE 294 GAN & LEE: PRODUCT PORTFOLIO
TABLE 295 GAN & LEE: RECENT DEVELOPMENTS
TABLE 296 NAMED DISTRIBUTORS AND WHOLESALERS, AND HOW MANY EACH COMPANY USES
TABLE 297 SOURCES BY CLASS, WITH COVERAGE AND DATE ACCESSED
TABLE 298 WHAT COULD NOT BE OBTAINED, AND WHY
List of Figure
FIGURE 1 EX-U.S. AND EX-INDIA BIOSIMILARS MARKET, 2018-2033 (USD MILLION)
FIGURE 2 EX-U.S. AND EX-INDIA BIOSIMILARS MARKET: SEGMENTATION AT A GLANCE, 2025
FIGURE 3 EX-U.S. AND EX-INDIA BIOSIMILARS MARKET: DRIVERS IMPACT ANALYSIS
FIGURE 4 EX-U.S. AND EX-INDIA BIOSIMILARS MARKET: PORTER'S FIVE FORCES
FIGURE 5 EX-U.S. AND EX-INDIA BIOSIMILARS MARKET: PESTLE ANALYSIS
FIGURE 6 EX-U.S. AND EX-INDIA BIOSIMILARS: SWOT ANALYSIS
FIGURE 7 BIOSIMILARS MARKET, BY MOLECULE: KEY FINDINGS
FIGURE 8 BIOSIMILARS MARKET, BY MOLECULE, 2025
FIGURE 9 EX-U.S. AND EX-INDIA BIOSIMILARS MARKET, BY MOLECULE, 2033 (USD MILLION)
FIGURE 10 BIOSIMILARS MARKET, BY THERAPEUTIC GROUP: KEY FINDINGS
FIGURE 11 BIOSIMILARS MARKET, BY THERAPEUTIC GROUP, 2025
FIGURE 12 BIOSIMILARS MARKET, BY MARKET STATUS: KEY FINDINGS
FIGURE 13 BIOSIMILARS MARKET, BY MARKET STATUS, 2025
FIGURE 14 BIOSIMILARS MARKET, BY CHANNEL: KEY FINDINGS
FIGURE 15 BIOSIMILARS MARKET, BY CHANNEL, 2025
FIGURE 16 BIOSIMILARS MARKET, BY GEOGRAPHY: KEY FINDINGS
FIGURE 17 BIOSIMILARS MARKET, BY GEOGRAPHY, 2025
FIGURE 18 EU-5, BY COUNTRY, 2025
FIGURE 19 LATIN AMERICA, BY COUNTRY, 2025
FIGURE 20 CHINA, BY COUNTRY, 2025
FIGURE 21 SOUTHEAST ASIA, BY COUNTRY, 2025
FIGURE 22 MENA, BY COUNTRY, 2025
FIGURE 23 SANDOZ, SHARE OF THE EX-U.S. AND EX-INDIA BIOSIMILARS MARKET, 2025
FIGURE 24 SANDOZ: COMPANY SNAPSHOT
FIGURE 25 CELLTRION, SHARE OF THE EX-U.S. AND EX-INDIA BIOSIMILARS MARKET, 2025
FIGURE 26 CELLTRION: COMPANY SNAPSHOT
FIGURE 27 BIOCON BIOLOGICS, SHARE OF THE EX-U.S. AND EX-INDIA BIOSIMILARS MARKET, 2025
FIGURE 28 BIOCON BIOLOGICS: COMPANY SNAPSHOT
FIGURE 29 AMGEN, SHARE OF THE EX-U.S. AND EX-INDIA BIOSIMILARS MARKET, 2025
FIGURE 30 AMGEN: COMPANY SNAPSHOT
FIGURE 31 TEVA: COMPANY SNAPSHOT
FIGURE 32 ORGANON, SHARE OF THE EX-U.S. AND EX-INDIA BIOSIMILARS MARKET, 2025
FIGURE 33 ORGANON: COMPANY SNAPSHOT
FIGURE 34 SAMSUNG BIOEPIS, SHARE OF THE EX-U.S. AND EX-INDIA BIOSIMILARS MARKET, 2025
FIGURE 35 SAMSUNG BIOEPIS: COMPANY SNAPSHOT
FIGURE 36 FRESENIUS KABI: COMPANY SNAPSHOT
FIGURE 37 STADA: COMPANY SNAPSHOT
FIGURE 38 ACCORD HEALTHCARE: COMPANY SNAPSHOT
FIGURE 39 VIATRIS: COMPANY SNAPSHOT
FIGURE 40 PFIZER: COMPANY SNAPSHOT
FIGURE 41 COHERUS: COMPANY SNAPSHOT
FIGURE 42 GAN & LEE: COMPANY SNAPSHOT

Data collection and base year analysis are done using data collection modules with large sample sizes. The stage includes obtaining market information or related data through various sources and strategies. It includes examining and planning all the data acquired from the past in advance. It likewise envelops the examination of information inconsistencies seen across different information sources. The market data is analysed and estimated using market statistical and coherent models. Also, market share analysis and key trend analysis are the major success factors in the market report. To know more, please request an analyst call or drop down your inquiry.
The key research methodology used by DBMR research team is data triangulation which involves data mining, analysis of the impact of data variables on the market and primary (industry expert) validation. Data models include Vendor Positioning Grid, Market Time Line Analysis, Market Overview and Guide, Company Positioning Grid, Patent Analysis, Pricing Analysis, Company Market Share Analysis, Standards of Measurement, Global versus Regional and Vendor Share Analysis. To know more about the research methodology, drop in an inquiry to speak to our industry experts.
Data Bridge Market Research is a leader in advanced formative research. We take pride in servicing our existing and new customers with data and analysis that match and suits their goal. The report can be customized to include price trend analysis of target brands understanding the market for additional countries (ask for the list of countries), clinical trial results data, literature review, refurbished market and product base analysis. Market analysis of target competitors can be analyzed from technology-based analysis to market portfolio strategies. We can add as many competitors that you require data about in the format and data style you are looking for. Our team of analysts can also provide you data in crude raw excel files pivot tables (Fact book) or can assist you in creating presentations from the data sets available in the report.